
Comprehensive Profile: Daybrook Fisheries
Gulf Menhaden Fishmeal and Fish Oil Processing Company
Region:United States
Author(s):Prahaladh Hariharan
Product Code:KR855
Region:United States
Author(s):Prahaladh Hariharan
Product Code:KR855
August 2019
27

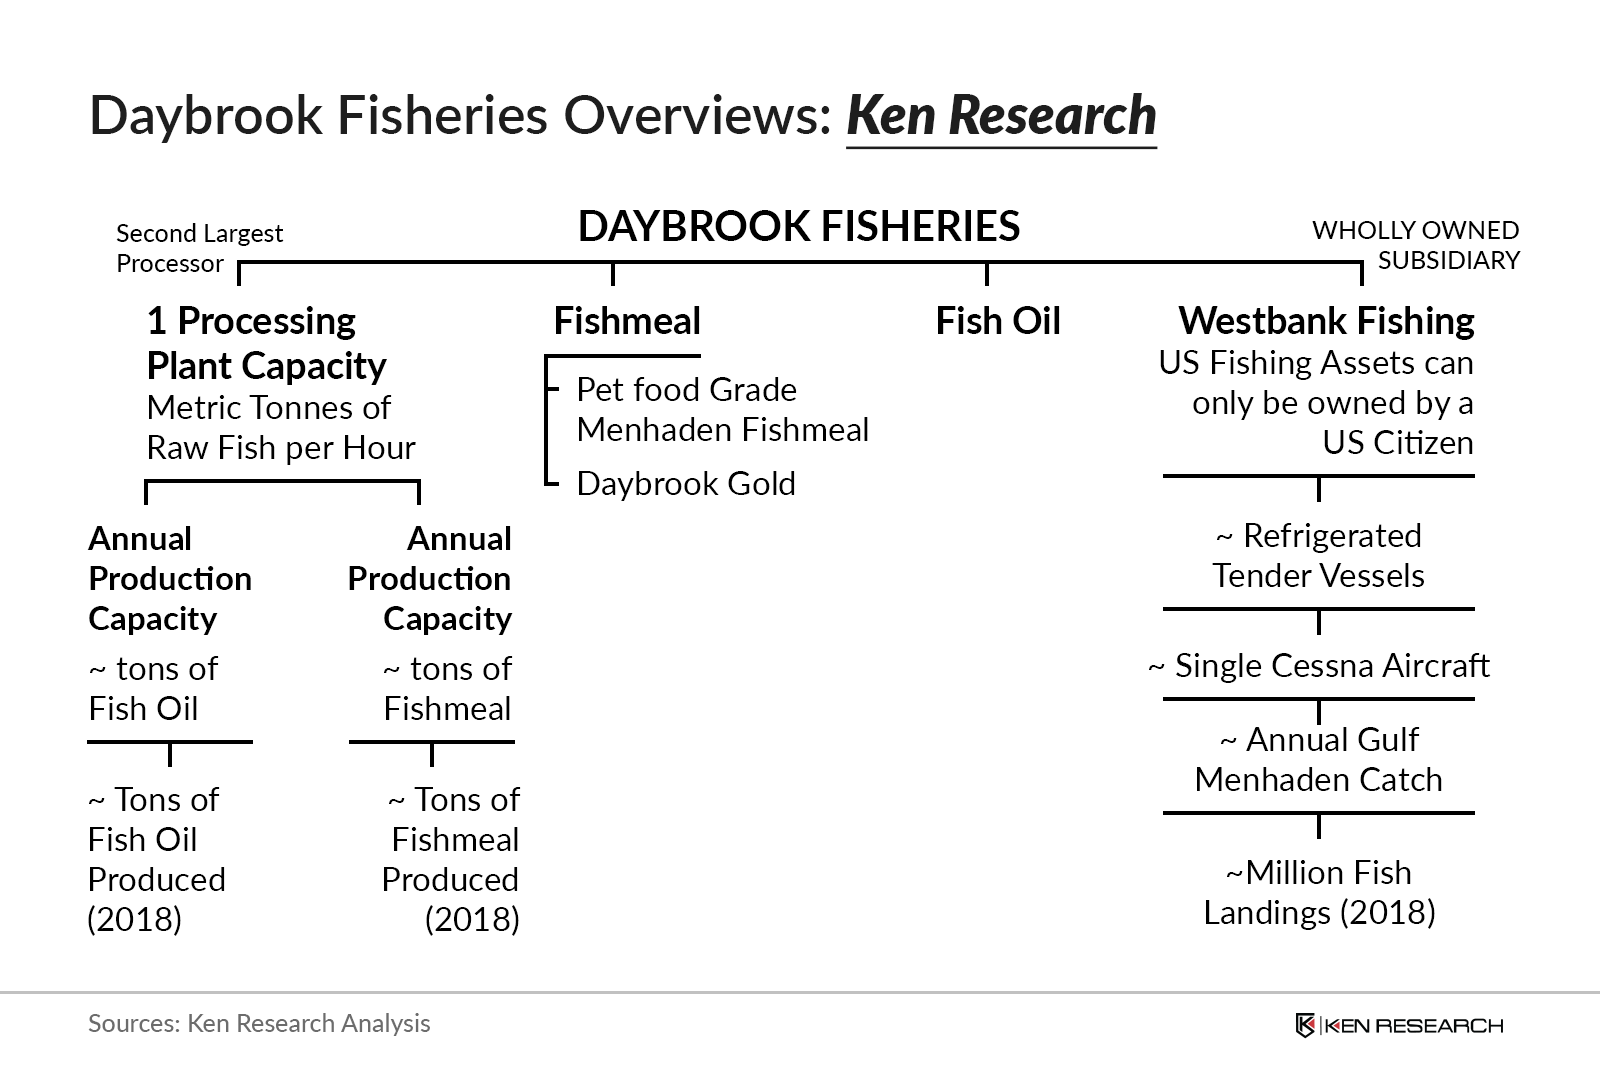
1.1. Overview of Daybrook Fisheries
1.2. Overview of Oceana Group
1.3. How the Acquisition of Daybrook Fisheries helped Oceana Group
1.4. Trends and Developments
1.5. Competitive Landscape
1.6. Future Outlook
2.1. Daybrook Fisheries Company Profile
Transaction and Summarized Group Structure
4. Financial Metrics Daybrook Fisheries (Including Revenue, Production Volume, EBITDA Margin and Revenue Split by Country), 2012- 2014
4.1. Daybrook Fisheries Revenue Split by Country, 2014
5.1. Competitive Landscape of Major Companies (Global)
6.1. Resignation of Oceana’s CEO
 Framework")
What makes us stand out is that our consultants follows Robust, Refine and Result (RRR) methodology. i.e. Robust for clear definitions, approaches and sanity checking, Refine for differentiating respondents facts and opinions and Result for presenting data with story

We have set a benchmark in the industry by offering our clients with syndicated and customized market research reports featuring coverage of entire market as well as meticulous research and analyst insights.

While we don't replace traditional research, we flip the method upside down. Our dual approach of Top Bottom & Bottom Top ensures quality deliverable by not just verifying company fundamentals but also looking at the sector and macroeconomic factors.

With one step in the future, our research team constantly tries to show you the bigger picture. We help with some of the tough questions you may encounter along the way: How is the industry positioned? Best marketing channel? KPI's of competitors? By aligning every element, we help maximize success.

Our report gives you instant access to the answers and sources that other companies might choose to hide. We elaborate each steps of research methodology we have used and showcase you the sample size to earn your trust.

If you need any support, we are here! We pride ourselves on universe strength, data quality, and quick, friendly, and professional service.