Learning Management System (LMS) Adoption Survey: Why India's Buyers Now Measure Platforms by Active Use, Not Feature Lists
Ken Research
July 31, 2026 - 7 min read

July 31, 2026
by Ken ResearchIndia's LMS Market Is Booming, but Adoption Is Quietly Lagging the Spend
India's learning technology market has entered a steep growth phase. The India LMS market was valued at roughly USD 877 million in 2025 and is projected to grow at a double-digit CAGR through the early 2030s, riding a corporate e-learning and upskilling base estimated in the billions of dollars and pushed forward by NEP-led digital learning and AI integration. Yet the rush to buy has outrun the discipline to deploy.
The gap between licenses purchased and platforms actually used is now the defining problem. To map it, Ken Research conducted its Learning Management System (LMS) Adoption Survey across India, pairing the L&D and HR leaders who buy the platforms with the administrators who run them day to day. The first chart frames the whole study: adoption is decided early, and the onboarding model sets the ceiling.
The curves are unambiguous. Platforms launched with structured onboarding reach about 91% active usage of licensed seats and plateau high, while self-serve rollouts stall near 60%, a 31-point activation gap that opens in the first ninety days and never closes. The licence count looks identical on the invoice; the realised value does not.
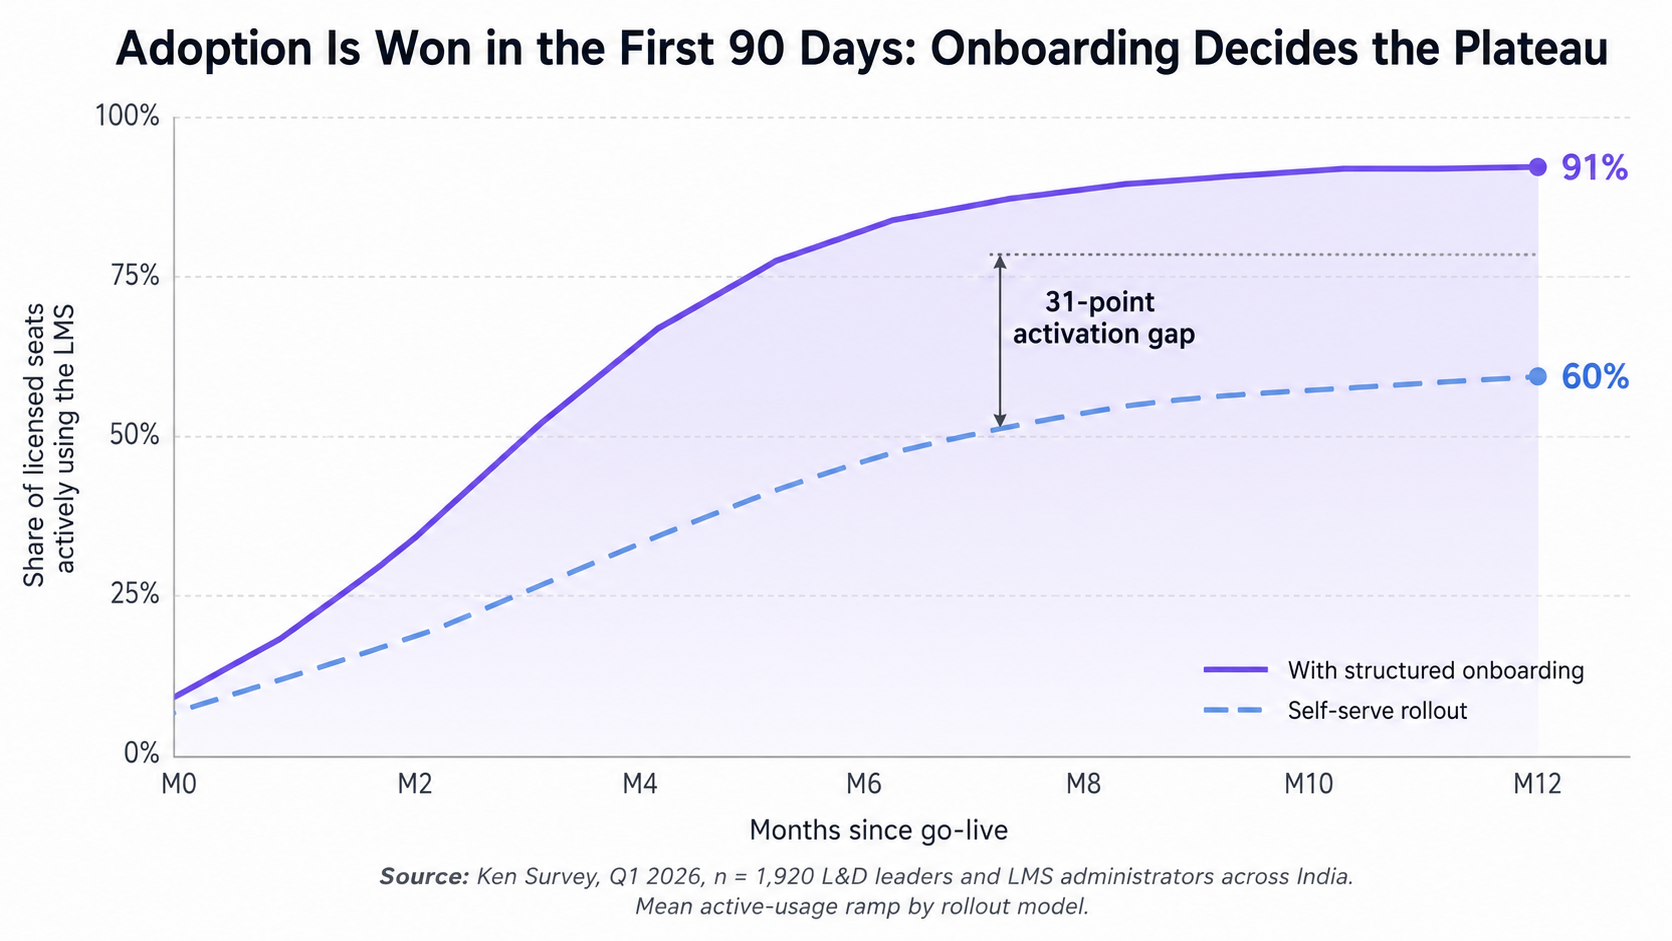
The implication reframes the buying decision. An LMS is not won at signature, it is won in the rollout, and a platform that licenses a workforce it never activates is a cost centre wearing the badge of a capability.
Survey Profile: Who We Studied, Where, and Why It Matters
Sample and Geography
The survey was conducted in Q1 of 2026 across a stratified sample of 1,920 L&D and HR leaders and LMS administrators spanning metro, Tier-1, and Tier-2 India, including Delhi-NCR, Mumbai, Bengaluru, Chennai, Hyderabad, Pune, and Ahmedabad. The frame covered IT and ITeS, BFSI, manufacturing, healthcare, retail, and professional services, weighted to reflect workforce size. Fieldwork combined online panels, platform-usage audits, and assisted telephone interviews.
Respondent Profile
- Buyer mix: 44% enterprise L&D and HR heads, 31% learning administrators, 16% IT and systems owners, and 9% business-unit training sponsors
- Organisation size: 38% large enterprises above 5,000 staff, 41% mid-market, 21% smaller firms scaling their first formal LMS
- Deployment maturity: 57% on their second or later LMS, typically replacing a platform that failed on adoption rather than features
- Primary use case: compliance and mandatory training, role-based upskilling, and onboarding dominate the workload across sectors
The Adoption Gap: Where the LMS Promise Meets Reality
Buyers select a platform on a wishlist of capabilities, but value is decided by what those capabilities deliver in production. The chart below sets what buyers expected at purchase against what they reported twelve months on.
Every dimension fell short, and the largest gaps are the most strategic. Ease of use slipped from an 88% expectation to 61% in reality, integration with HRIS and Teams from 82% to 48%, and measurable ROI on learning from 64% to just 36%. The features that close on the brochure, integration, reporting, and admin efficiency, are precisely the ones that erode once real workflows hit the platform.
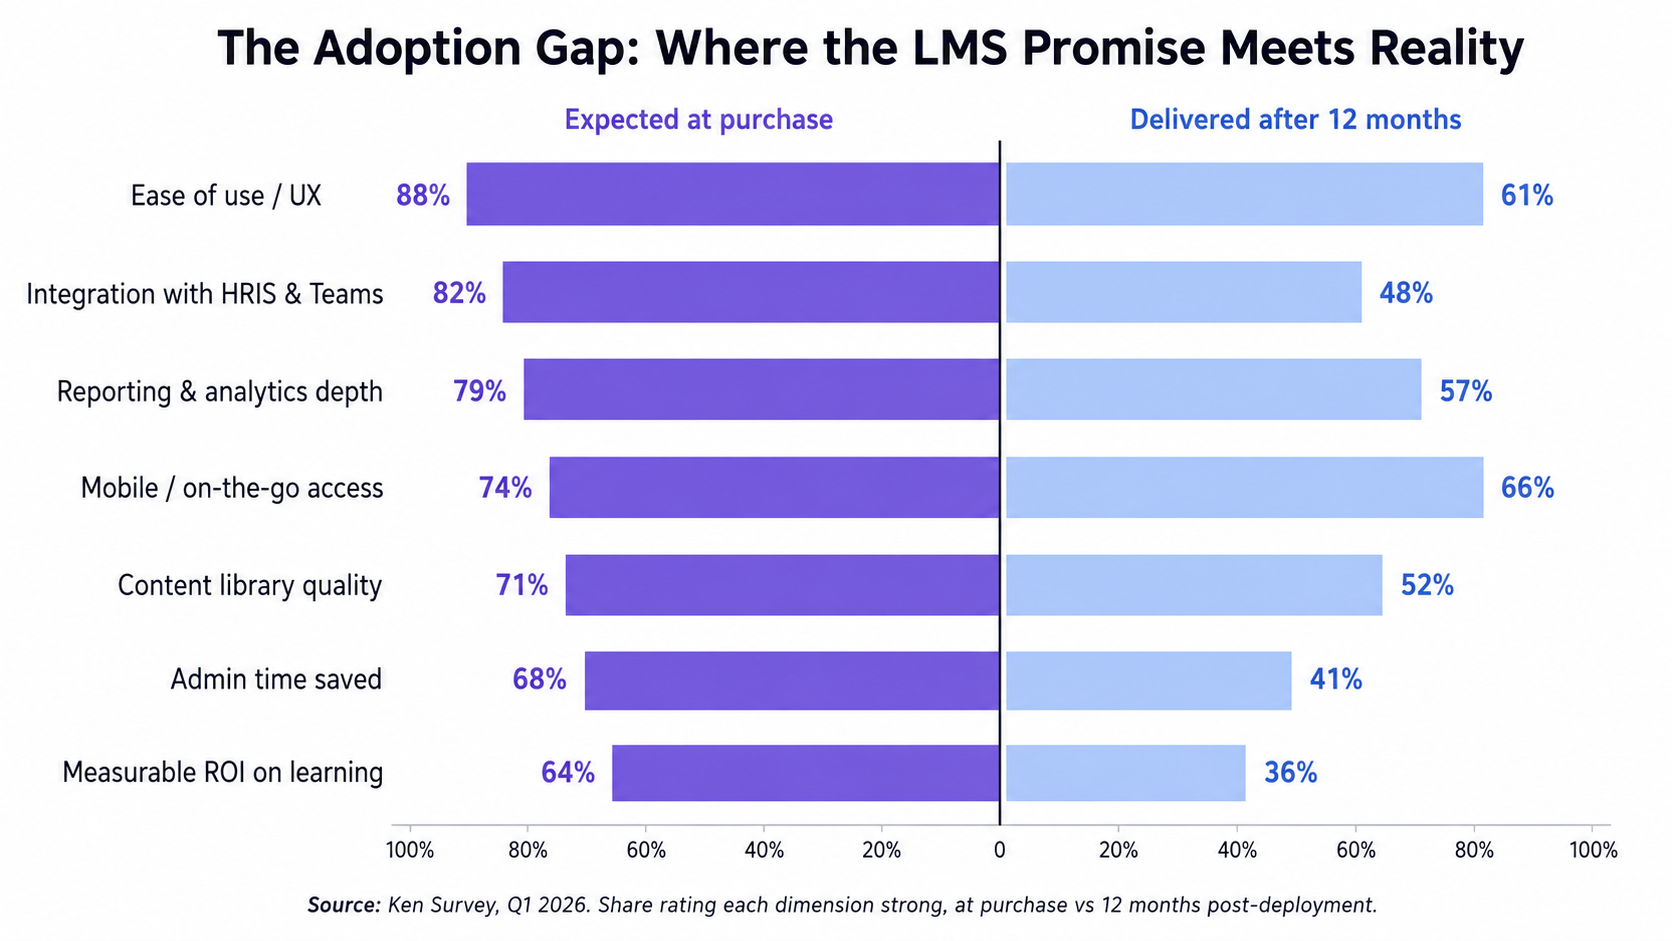
The lesson for buyers is to test for the gap, not the demo. A platform that demos brilliantly but cannot integrate or prove ROI loses adoption, and adoption, not features, is what the organisation actually paid for.
From Enrolment to Completion: Where Learners Fall Away
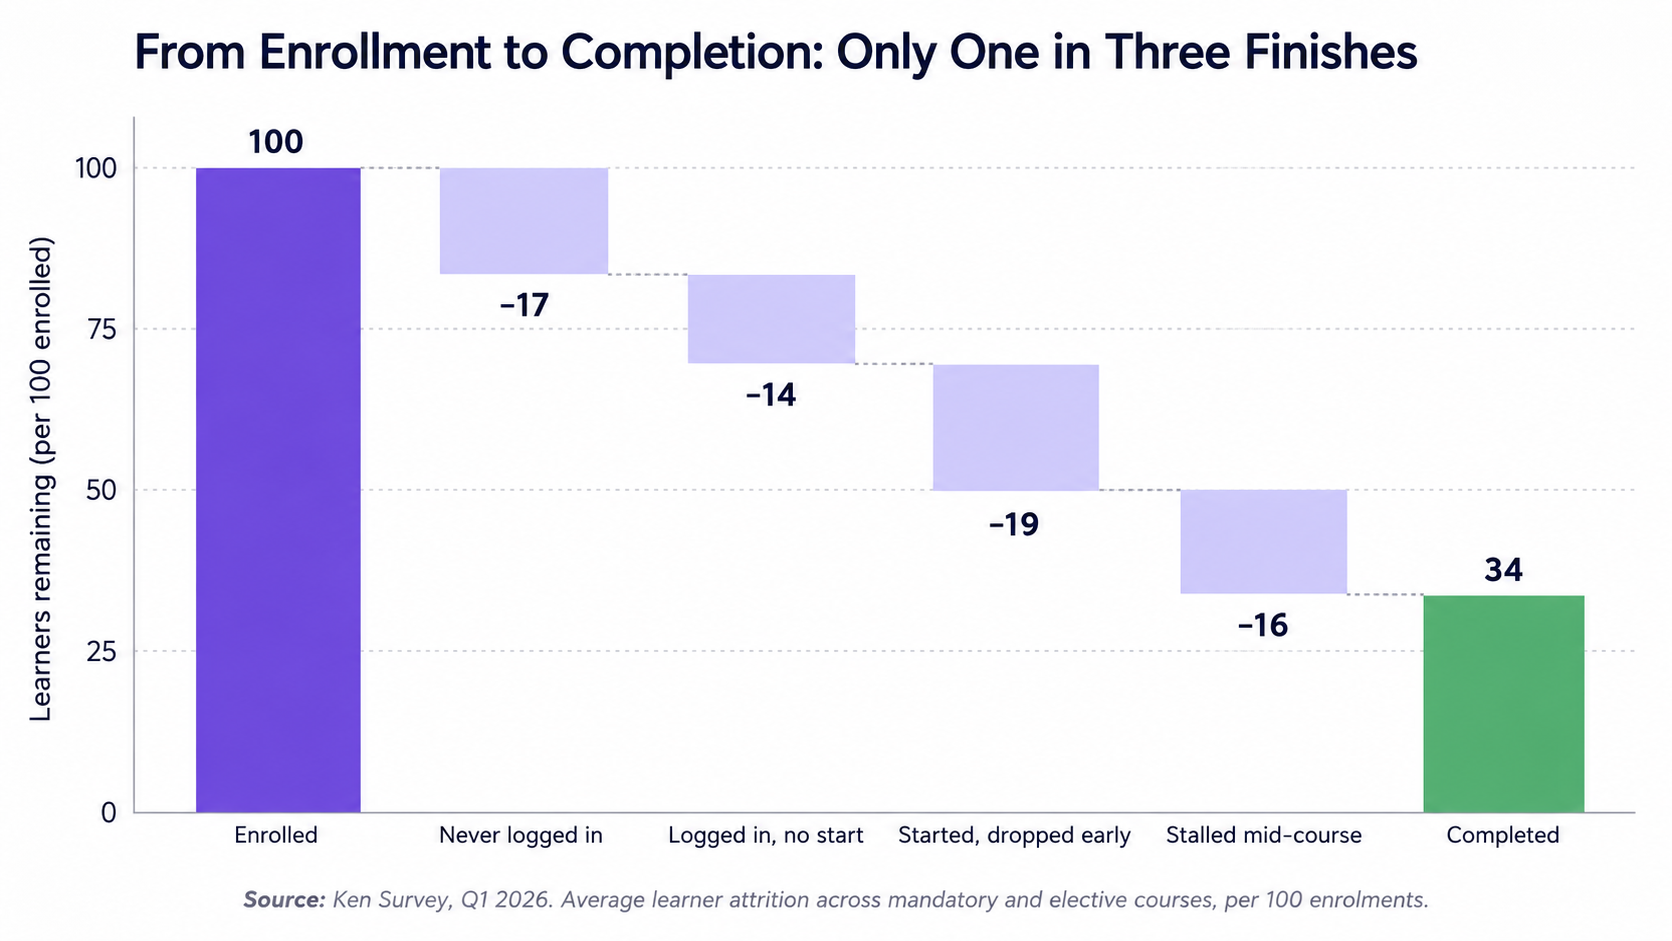
Even an activated platform only creates value when learners finish what they start. The waterfall below traces what happens to every 100 enrolments, step by step to completion.
The attrition is steep and front-loaded. Of every 100 learners enrolled, 17 never log in and another 14 log in but never start; early drop-off and mid-course stalls remove a further 35, leaving just 34 who complete. Roughly two-thirds of enrolments produce no finished learning at all, a leakage that no amount of content investment fixes if the experience and the workday do not support it.
What the Drop-Off Reveals
- The first click is the cliff: nearly a third of learners are lost before they start, so access friction and enrolment overload matter more than course quality.
- Completion is a workflow problem: mid-course stalls track to no protected time, not weak content, and reflect a workforce already stretched thin.
- Realised learning is the real KPI: organisations fund 100 enrolments but build capability on the 34 that finish, a ratio few dashboards surface.
The Vital Few: What Actually Suppresses Adoption
When administrators were asked what holds adoption back, the answers concentrated tightly. The Pareto chart below ranks the barriers and tracks their cumulative weight.
A short list does most of the damage. Poor integration with work tools (24%), a clunky user experience (21%), irrelevant or stale content (17%), and no time in the workday (14%) together account for roughly three-quarters of all adoption failure. These echo the global pattern, where integration challenges and weak user experience are the leading sources of LMS dissatisfaction. Fixing the first four barriers, rather than chasing the long tail, is where the leverage sits.
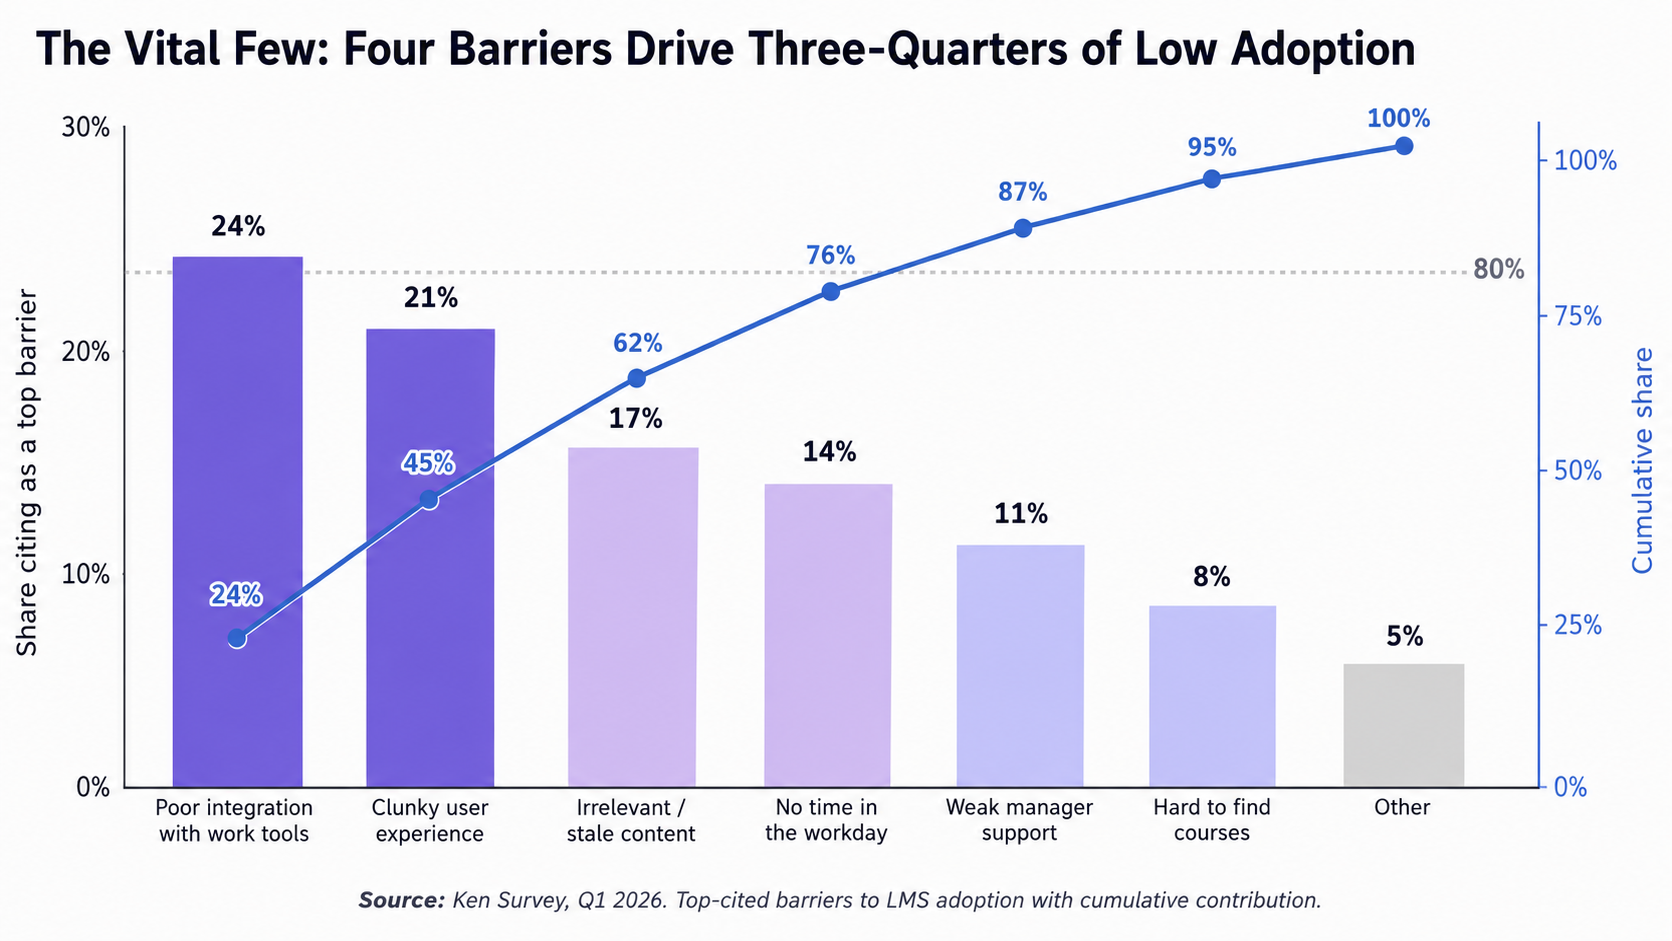
For buyers and administrators, the message is focus. Solve integration, experience, content relevance, and protected time, and the rest of the adoption problem largely dissolves, because the vital few barriers are doing most of the work.
Feature Reality Check: What Learners Actually Use
Procurement decks are won on long feature lists, but learners use only a fraction of them. The radial chart below shows the share of active learners using each feature at least monthly.
Usage is concentrated in the practical. The mobile app (78%), microlearning (71%), and compliance tracking (69%) carry adoption, while AI recommendations (39%), social learning (33%), and VR or simulations (14%) sit largely unused. The features that win deals in the demo are frequently the features that gather dust in production, a misalignment between what is bought and what is needed.
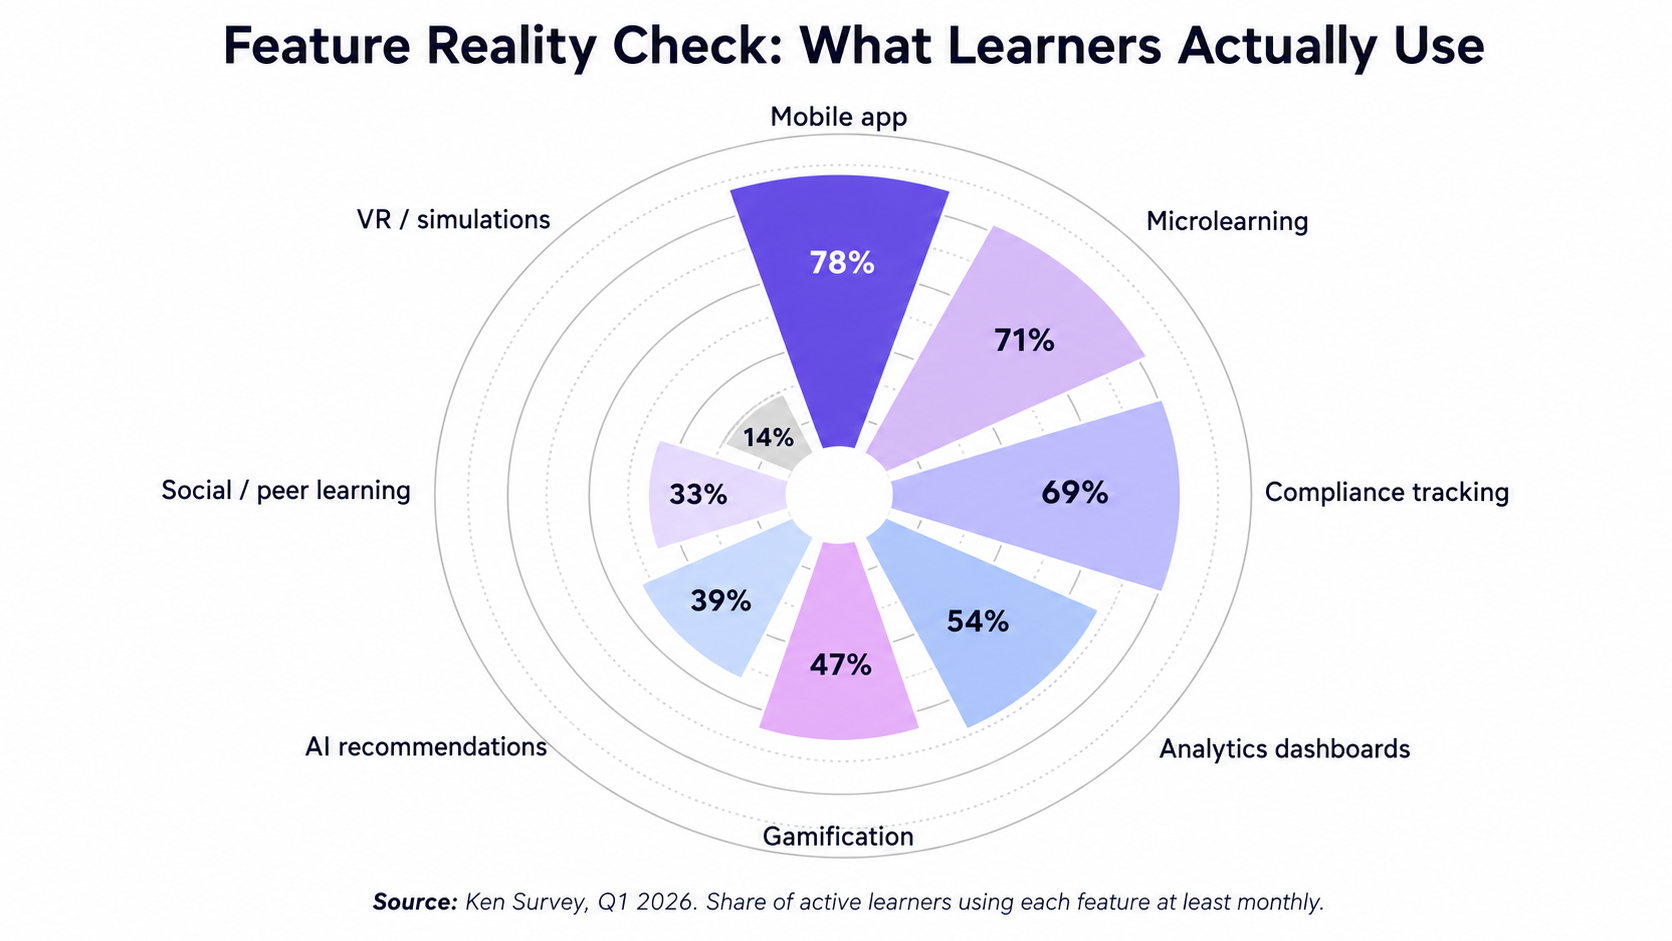
This is the discipline the market now demands. Pay for the features learners use daily, not the ones that impress in a sales meeting, because an unused capability is a cost the organisation carries without return.
What Lies Ahead: The Strategic Reckoning for India's L&D Leaders
The rise of active usage as the deciding metric has turned India's LMS market into an adoption contest as much as a procurement one. Rapid market growth, a workforce under engagement pressure, a regulatory and skills agenda pushing continuous learning, and AI reshaping content all point the same way: the platform that wins is the one a workforce actually uses, every week, not the one with the longest feature list.
L&D leaders and administrators must now confront hard strategic questions:
Do they invest in structured onboarding that lifts the adoption ceiling, or keep launching platforms self-serve and accept the plateau?
Do they treat integration and user experience as IT details, or as the decisive drivers of whether the platform is used at all?
Do they buy the longest feature list, or the narrow set of capabilities their learners actually reach for each week?
Selecting on feature count, while learners allocate their scarce time to whatever is genuinely usable, is no longer sufficient. India's learning budgets are being judged by realised usage, not licences signed, and the return is earned by adoption, not by the brochure.
The data shows that value does not require the richest platform, it requires the lowest friction and a learner who comes back. For L&D leaders the message is direct: onboard deliberately, integrate ruthlessly, fund the features people use, and earn the next week's logins, or watch the licences sit idle.
About the Author
Pranshu Mittal is a survey research associate at Ken Research with expertise in primary research, survey analytics, and consumer behaviour studies. He supports organisations by converting research findings into actionable insights that drive strategic decision-making and market understanding.
From the Author:
“At Ken Research, we have been mapping LMS choice at the level of the people who buy and run these platforms, the L&D leaders and administrators shaping how India's workforce learns, and the data tells a clear story. Buyers are not short of features; they are short of adoption. The gap between the licences an organisation signs and the seats it activates is what decides the return. India's LMS market is no longer a feature game, it is an adoption game, and the winners will be those who get more of their workforce genuinely using the platform than their competitors do.”
About Ken Research:
Ken Research is a market intelligence and strategy consulting firm delivering actionable insights across the various sectors in dynamic markets. We support industry stakeholders with data-driven analysis on emerging trends, competitive benchmarking, pricing strategies, and shifting consumer preferences. Our expertise enables clients to refine market entry and penetration strategies, optimize product positioning, and respond effectively to evolving competitive landscapes.
Related tags
Education and Recruitment
Get started
We've helped companies around the world future-proof
their businesses - and we can do the same for you.