CHAPTER 1 - MARKET SUMMARY
Market Overview
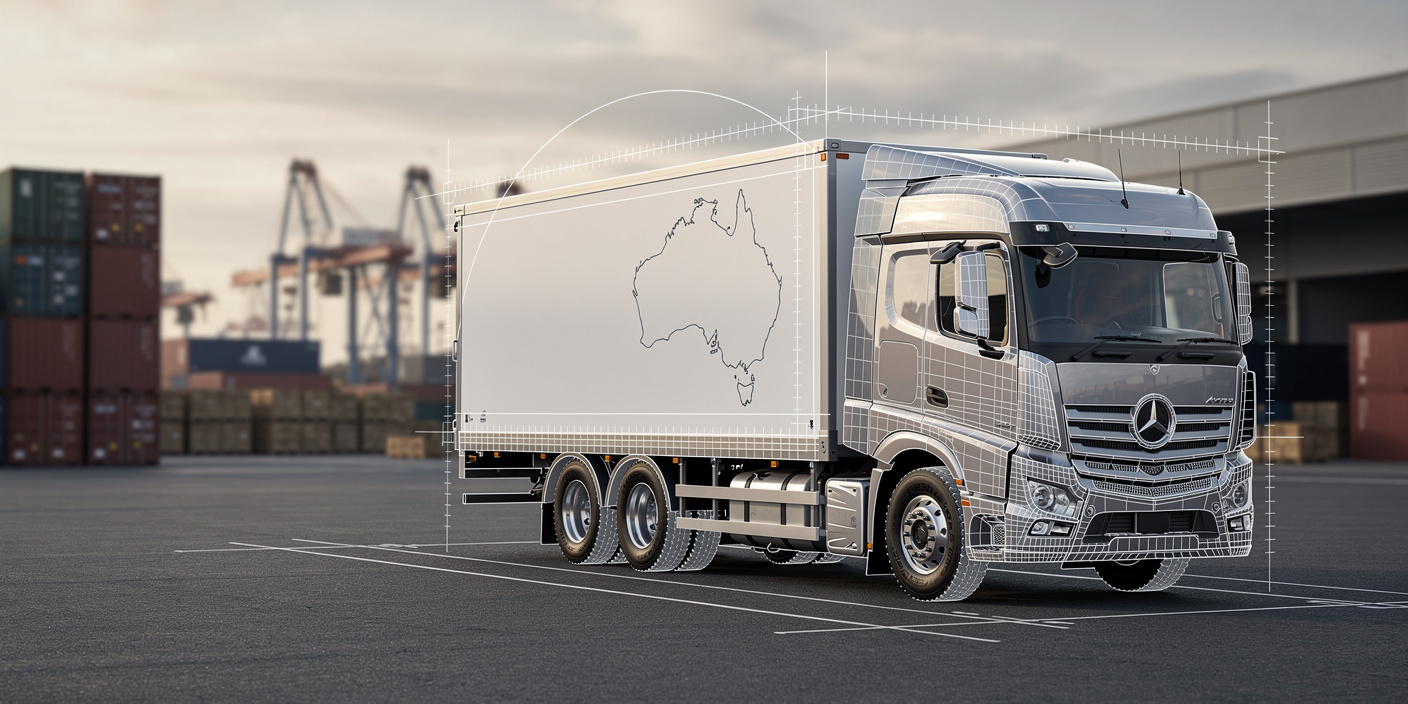
The Australia Logistics Market converts geographically dispersed production and consumption into freight transport, forwarding, storage and parcel revenue. Domestic freight activity reached approximately 700 Bn tonne-km across road and rail in 2024-25, before coastal shipping and pipeline movements. Long distances between mines, farms, ports and capital cities make network density, backhaul utilisation and contract duration central to operator economics.
New South Wales, Victoria and Queensland form the dominant eastern logistics spine. Melbourne handled 3.39 Mn TEU in FY2024-25, while Port Botany handles about 2.8 Mn TEU annually. These gateways concentrate warehouses, intermodal terminals and import distribution within short drayage radii, raising asset utilisation but also intensifying land, labour and congestion costs around Sydney and Melbourne for high-frequency national distribution.
Market Value
USD 99.08 billion
2025
Dominant Region
New South Wales
2025
Dominant Segment
Courier, Express and Parcel
fastest growing, 2026-2031
Total Number of Players
125,000
2025
Future Outlook
The Australia Logistics Market is projected to increase from USD 99.08 Bn in 2025 to USD 126.52 Bn by 2031. The historical CAGR was 3.83% during 2020-2025, reflecting pandemic disruption, strong post-reopening freight income, and later normalisation in commodity and consumer volumes. Forecast growth of 4.16% during 2026-2031 is supported by parcel density, port throughput, contract logistics outsourcing and intermodal infrastructure. Market value is expected to grow faster than physical freight volume because specialised fulfilment, cold-chain handling, compliance services and time-definite delivery carry higher revenue per movement than conventional linehaul. This favours operators with scalable systems, compliant networks and sector expertise.
Operationally, the next phase will reward providers that combine national coverage with disciplined asset turns. Road freight remains the largest revenue pool, but its share is expected to ease as rail capacity, port-linked intermodal terminals and managed transport platforms scale. The 1,600 km Inland Rail program is designed to reduce Melbourne-Brisbane rail transit from 33 hours to less than 24 hours, improving modal competitiveness. Base-case closure assumes freight volume growth near 2.1% annually, service-mix and rate uplift near 2.0%, and no prolonged collapse in mineral exports, retail demand or international container flows. Capital discipline remains essential as infrastructure benefits materialise unevenly nationwide.
4.16%
Forecast CAGR
$126,520 Mn
2030 Projection
Base Year
2025
Historical Period
2020-2025
Forecast Period
2026-2031
Historical CAGR
3.83%
CHAPTER 2 - SCOPE OF REPORT
Scope of the Market
CHAPTER 3 - Key Stakeholders
Key Target Audience
Key stakeholders who can leverage from this market analysis for investment, strategy, and operational planning.
Investors
CAGR, asset turns, capex intensity, margin resilience
Corporates
freight spend, SLA performance, inventory, network design
Government
corridor capacity, resilience, emissions, regional connectivity
Operators
fleet utilization, warehouse productivity, pricing, automation
Financial institutions
infrastructure finance, covenants, volume stability, counterparty risk
CHAPTER 4 - Market Size & Growth
Market Size, Growth Forecast and Trends
This section evaluates the historical market size, analyzes year-over-year growth dynamics, and presents forecast projections supported by market performance indicators and demand-side drivers.
Historical & Projected Market Size ($ Million)
Year-over-Year Growth Rate (%)
Market Value vs Volume Growth (%)
Historical Market Performance (2020-2025)
Market value increased from USD 82.10 Bn in 2020 to USD 99.08 Bn in 2025. The strongest annual expansion occurred in 2022 at 5.44%, when reopening demand, elevated freight rates and inventory rebuilding supported revenue. Growth moderated to 2.36% in 2025 as rate normalisation offset record port throughput and parcel activity. Physical freight volume rose from 718 Bn tonne-km to 802 Bn tonne-km, showing that pricing and service mix supplied roughly half of cumulative value expansion.
Forecast Market Outlook (2026-2031)
Market value is forecast to reach USD 126.52 Bn by 2031, representing a 4.16% CAGR from 2026. Annual growth remains near 4.1%-4.2%, supported by stable freight volumes and higher-value services rather than a single demand spike. Domestic freight task is projected to approach 912 Bn tonne-km, while container throughput increases to about 10.9 Mn TEU. Road revenue share gradually declines to 64.7% as rail, managed transport and specialised forwarding capture incremental spend.
CHAPTER 5 - Market Data
Market Breakdown
The Australia Logistics Market combines a mature national transport base with faster-growing parcel, contract logistics and intermodal services. For CEOs and investors, the key issue is not only volume growth, but whether operators can convert corridor density, asset utilisation and technology into defensible margins.
Year | Market Size (USD Mn) | YoY Growth (%) | Domestic Freight Task (Bn tonne-km) | Container Throughput (Mn TEU) | Road Revenue Share (%) | Period |
|---|---|---|---|---|---|---|
| 2020 | $82,100 Mn | +- | 718 | 7.2 | Forecast | |
| 2021 | $84,600 Mn | +3.05% | 731 | 7.5 | Forecast | |
| 2022 | $89,200 Mn | +5.44% | 755 | 7.8 | Forecast | |
| 2023 | $93,100 Mn | +4.37% | 777 | 8.1 | Forecast | |
| 2024 | $96,800 Mn | +3.97% | 793 | 8.7 | Forecast | |
| 2025 | $99,080 Mn | +2.36% | 802 | 9.0 | Forecast | |
| 2026F | $103,200 Mn | +4.16% | 819 | 9.3 | Forecast | |
| 2027F | $107,550 Mn | +4.22% | 837 | 9.6 | Forecast | |
| 2028F | $112,000 Mn | +4.14% | 855 | 9.9 | Forecast | |
| 2029F | $116,600 Mn | +4.11% | 874 | 10.2 | Forecast | |
| 2030F | $121,450 Mn | +4.16% | 893 | 10.5 | Forecast | |
| 2031F | $126,520 Mn | +4.17% | 912 | 10.9 | Forecast |
Domestic Freight Task
700 Bn tonne-km, 2024-25, Australia road and rail. High bulk and interstate volumes create scale advantages for intermodal operators, but low-density regional lanes require pricing discipline. Rail moved 447 Bn tonne-km and road 253 Bn tonne-km.
Container Throughput
3.39 Mn TEU, FY2024-25, Port of Melbourne. Port-linked warehouse and drayage capacity are critical profit pools because import distribution is geographically concentrated. Melbourne's throughput was 3.7% above FY2023-24.
Road Revenue Share
67.1%, 2025, Australia. Road remains essential for first and last mile, but intermodal substitution can reduce long-haul exposure. One Inland Rail train is designed to carry the equivalent of 110 B-double trucks.
CHAPTER 6 - Segmentation
Market Segmentation Framework
Comprehensive analysis across key dimensions providing insights into market structure, consumer preferences, and distribution patterns.
No of Segments
7
Dominant Segment
Service Type
Fastest Growing Segment
Business Model
Service Type
Mode of Transport
Shipment Flow
Customer Type
End-Use Industry
Business Model
Geography
Key Segmentation Takeaways
Comprehensive analysis across all extracted segmentation dimensions providing insights into market structure, consumer preferences, and distribution patterns.
Service Type
Freight transport is the largest revenue pool because Australia's production centres, ports and consumers are separated by long distances. Road linehaul and metropolitan distribution dominate contracted spend, while freight forwarding and warehousing improve customer retention. Courier, express and parcel is smaller but benefits from rising delivery frequency and premium time-definite service requirements.
Business Model
Digital on-demand logistics is expanding faster than traditional asset ownership as shippers seek spot capacity, shipment visibility and dynamic carrier procurement. The fastest-growing Level-2 sub-segment is Freight Brokerage and Managed Transport, where providers monetise orchestration, control towers and carrier networks without matching every revenue dollar with owned fleet or warehouse capital.
CHAPTER 8 - INDUSTRY ANALYSIS
Growth Drivers, Market Challenges & Market Opportunities
Comprehensive analysis of key factors shaping the Australia Logistics Market, including growth catalysts, operational challenges, and emerging opportunities across production, distribution, and consumer segments.
Growth Drivers
E-commerce Parcel Density
- Online sales were 8.4% higher year-on-year (May 2025, Australia), supporting higher throughput for parcel carriers and outsourced fulfilment providers with dense metropolitan networks.
- Australia Post delivered 514.3 Mn parcels (FY2025, Australia), demonstrating the scale available to operators that can automate sorting, optimise routes and monetise returns.
- Non-food online penetration reached 19.0% (June 2025, Australia), increasing demand for bulky-item handling, delivery-slot management and urban micro-fulfilment capacity.
Multimodal Infrastructure Investment
- Target transit time falls from 33 hours to less than 24 hours (project design, Australia), improving rail competitiveness for time-sensitive interstate freight and reducing inventory buffers.
- Each 1,800 metre train can carry freight equivalent to 110 B-double trucks (project design, Australia), creating asset productivity and emissions advantages for intermodal operators.
- Port Botany has capacity above 7 Mn TEU (current capacity, Australia), enabling long-term import growth and adjacent warehousing investment without immediate greenfield port substitution.
Trade and Bulk Freight Scale
- Rail carried 447 Bn tonne-km (2024-25, Australia), anchoring high-volume bulk and interstate corridors where long contracts support fleet and terminal investment.
- Resource and energy export earnings were forecast at USD 251 Bn equivalent (2024-25, Australia), supporting mine-to-port logistics despite lower commodity prices.
- Domestic freight is projected to increase 26% from 2020 to 2050 (Australia), giving infrastructure owners and national carriers a durable volume base.
Market Challenges
Labour Availability and Wage Pressure
- Median weekly earnings reached USD 1,045 equivalent (2026, Australia), raising the break-even load factor for labour-intensive road, warehouse and parcel operations.
- Wages and salaries increased 7.2% (FY2024-25, Australia), outpacing base-year market growth and pressuring contracts without indexation or productivity sharing.
- Women represented only 22% of the workforce (2026, Australia), narrowing the labour pool and strengthening the case for automation, flexible rosters and safer job design.
Decarbonisation and Fleet Costs
- Transport produced 90 Mt CO2-e (2022, Australia) and is projected to become the largest emitting sector by 2030, raising transition risk for long-lived diesel assets.
- Qube reported 437,451 tCO2-e net Scope 1 and 2 emissions (FY2025, company operations), illustrating the scale of energy transition required for integrated operators.
- The heavy-vehicle fleet exceeds 900,000 registered vehicles and trailers (2020 benchmark, Australia), making replacement cycles and charging or refuelling infrastructure capital intensive.
Fragmented Operator Base and Service Variance
- Business counts increased 5.1% in FY2024-25 (Australia), adding capacity faster than demand in some lanes and limiting spot-market pricing power.
- The market is assessed as low concentration (2025, Australia), so scale alone does not secure margins without network density, vertical specialisation or technology differentiation.
- Heavy vehicles above 4.5 tonnes gross vehicle mass (current law, participating jurisdictions) face national compliance obligations that can burden smaller subcontractors and raise audit costs for lead logistics providers.
Market Opportunities
Automated Fulfilment and Control Towers
- managed fulfilment, robotics-as-a-service and control-tower subscriptions can convert variable shipment data into recurring fees and higher customer switching costs. Australia Post parcel revenue reached USD 4.97 Bn equivalent (FY2025, Australia).
- 3PLs, warehouse developers and automation integrators serving retail, technology and automotive customers. DHL opened a 21,078 square metre facility (2026, Western Sydney).
- operators need interoperable warehouse, transport and customer systems because online sales already represent 12.7% of retail (June 2025, Australia).
Port Rail and Inland Intermodal Hubs
- terminal handling, rail slots, container storage and depot services can produce infrastructure-like revenue with multi-year customer contracts. One million TEU shifted to rail removes 900 truck movements per day (Australia).
- intermodal operators, industrial property owners and exporters located along the 1,600 km Inland Rail corridor (Australia) gain lower linehaul and better port access.
- reliable train paths, terminal capacity and first-mile road connections must support the project's less than 24-hour Melbourne-Brisbane target (Australia).
Cold Chain and Regional Distribution
- refrigerated storage, validated transport and value-added packaging support premium rates because failure costs are higher than in ambient freight. Lineage expanded national cold capacity by 25% (2024, Australia).
- cold-store investors, food exporters, pharmaceutical distributors and regional producers requiring compliance and inventory proximity. Port of Melbourne exported more than 660,000 TEU of overseas containers (2025, Australia).
- renewable energy, backup power and route visibility must reduce operating risk as transport remains 22% of national emissions (2025, Australia).
CHAPTER 9 - Competitive Landscape
Competitive Landscape Overview
The market is fragmented, with national leaders competing against specialised regional carriers. Entry barriers are moderate in basic haulage but high in integrated networks, regulated freight, automation and port-linked infrastructure.
Market Share Distribution
Top 5 Players
Market Dynamics
8 new entrants in the past 5 years, indicating strong market attractiveness and growth potential.
Company Name | Market Share | Headquarters | Founding Year | Core Market Focus |
|---|---|---|---|---|
Australia Post | - | Melbourne, Australia | 1809 | Parcel delivery, postal logistics and national last-mile networks |
Toll Group | - | Melbourne, Australia | 1888 | Contract logistics, freight forwarding and specialised transport |
Linfox Logistics | - | Melbourne, Australia | 1956 | Large-scale contract logistics, road transport and warehousing |
Qube Holdings | - | Sydney, Australia | 2006 | Ports, intermodal terminals, bulk logistics and import-export services |
Team Global Express | - | Melbourne, Australia | 2021 | Express parcels, road freight and business distribution networks |
DHL Supply Chain Australia | - | Rhodes, Australia | 1969 | Contract logistics, fulfilment, transport and supply-chain orchestration |
FedEx Express Australia | - | Memphis, United States | 1971 | International express, air cargo and time-definite delivery |
Mainfreight Australia | - | Auckland, New Zealand | 1978 | Road freight, warehousing, air freight and ocean forwarding |
Kuehne+Nagel Australia | - | Schindellegi, Switzerland | 1890 | Sea freight, air freight and integrated contract logistics |
DSV Australia | - | Hedehusene, Denmark | 1976 | Air, sea, road and contract logistics following Schenker integration |
Cross Comparison Parameters
The report provides detailed cross-comparison of key players across 10 performance parameters to identify competitive strengths and weaknesses.
Warehouse Utilization
On-Time In-Full Delivery
Revenue Growth
EBITDA Margin
Analysis Covered
Market Share Analysis:
Maps operator scale across transport, warehousing, forwarding and parcel services.
Cross Comparison Matrix:
Benchmarks network reach, service quality, growth and operating profitability.
SWOT Analysis:
Assesses assets, contracts, technology, labour exposure and customer concentration risks.
Pricing Strategy Analysis:
Compares indexation, surcharges, contract tenure and value-added service premiums.
Company Profiles:
Reviews ownership, footprint, capabilities, investment priorities and strategic positioning.
CHAPTER 10 - REPORT TOC
CHAPTER 14 - Table Of Contents
Phase 1Market Assessment Phase
11
Chapters
Supply-side and competitive intelligence covering market sizing, segmentation, competitive dynamics, regulatory landscape, and future forecasts.
Phase 2Go-To-Market Strategy Phase
15
Chapters
Entry strategy evaluation, execution roadmap, partner recommendations, and profitability outlook.
Complete Report Coverage
201+ detailed sections covering every aspect of the market
143
Assessment Sections
58
Strategy Sections
CHAPTER 11 - Our Approach
Research Methodology
Desk Research
- Reviewed national freight activity statistics
- Mapped port and terminal throughput
- Analysed logistics company financial filings
- Tracked freight regulation and infrastructure
Primary Research
- Interviewed national logistics directors
- Consulted road freight fleet managers
- Engaged warehouse operations executives
- Surveyed shipper procurement leaders
Validation and Triangulation
- Validated findings across 284 respondents
- Reconciled revenue and freight volumes
- Cross-checked rates by transport mode
- Tested scenario sensitivity and closure
CHAPTER 12 - FAQ
FAQs
Still have questions?
Our research team is here to help you find the right solution
CHAPTER 13 - Related Research
Explore Related Reports
Expand your market intelligence with complementary research across regions and adjacent markets.
Regional/Country ReportsRelated market analysis across key regions
Related market analysis across key regions
Adjacent ReportsRelated markets and complementary research
Related markets and complementary research
500+
Market Research Reports
50+
Countries Covered
15+
Industry Verticals