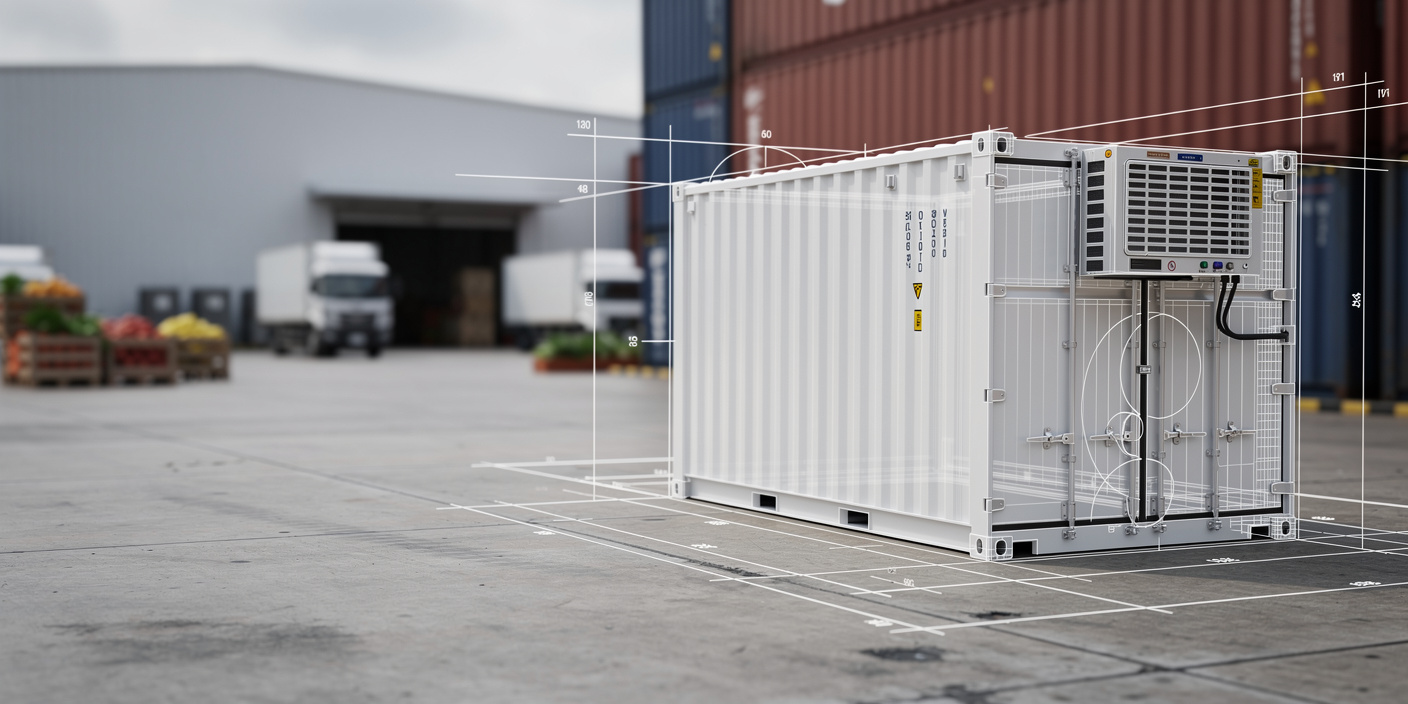
CHAPTER 1 - MARKET SUMMARY
Market Overview
The Indonesia Cold Chain Market monetizes temperature-controlled storage, refrigerated transport, handling, order fulfillment, monitoring, and related value-added services. An estimated 35.4 million tons of temperature-sensitive cargo moved through commercial cold-chain channels in 2025. Consumption is anchored by seafood, meat, poultry, dairy, frozen foods, fresh produce, vaccines, and biologics, making shipment density and product integrity primary revenue drivers.
Java remains the dominant operating hub because Jakarta, Greater Bandung, Semarang, Surabaya, major ports, processing facilities, and modern retail distribution centers are concentrated along the island's industrial corridors. Indonesia's fisheries cold-storage registry recorded 2,110 facilities with 813,966 tons of capacity, of which private operators controlled approximately 89% of facilities. This concentration supports high utilization but increases transfer costs for eastern provinces.
Market Value
USD 5.57 billion
2025
Dominant Region
Java
2025
Dominant Segment
Refrigerated Storage
54.4% of 2025 revenue
Total Number of Players
620
Future Outlook
The Indonesia Cold Chain Market is projected to expand from USD 5.57 billion in 2025 to USD 9.65 billion by 2031, representing a forecast CAGR of 9.6%. Growth is expected to exceed the historical CAGR of 8.1% during 2020-2025 as operators add capacity, extend inter-island networks, and capture rising outsourced logistics expenditure from food manufacturers, retailers, restaurant chains, exporters, and healthcare companies. Refrigerated road distribution will remain a major investment area, while storage utilization, energy efficiency, route density, and inventory turns will determine returns on new facilities.
The forecast assumes temperature-controlled cargo volume increases from 35.4 million tons in 2025 to approximately 54.3 million tons in 2031. Value growth is expected to exceed volume growth because of inflation-linked tariffs, enhanced monitoring, stricter service-level requirements, and greater use of multi-temperature facilities. The profit pool will gradually shift toward integrated 3PL contracts, pharmaceutical-grade logistics, urban fulfillment, cross-docking, and eastern Indonesia distribution. Downside risk remains linked to electricity costs, underutilized regional assets, fragmented ferry schedules, equipment financing, and limited backhaul cargo on lower-density routes.
9.6%
Forecast CAGR
USD 9,654 Mn
2030 Projection
Base Year
2025
Historical Period
2020-2025
Forecast Period
2026-2031
Historical CAGR
8.1%
CHAPTER 2 - SCOPE OF REPORT
Scope of the Market
CHAPTER 3 - Key Stakeholders
Key Target Audience
Key stakeholders who can leverage from this market analysis for investment, strategy, and operational planning.
Investors
CAGR, utilization, capex intensity, margins, exit potential, risk
Corporates
procurement cost, shrink, SLA, inventory turns, route density
Government
food security, compliance, regional capacity, resilience, trade efficiency
Operators
pallet utilization, fleet productivity, energy cost, claims, uptime
Financial institutions
project finance, covenants, occupancy, cash flow, collateral quality
CHAPTER 4 - Market Size & Growth
Market Size, Growth Forecast and Trends
This section evaluates the historical market size, analyzes year-over-year growth dynamics, and presents forecast projections supported by market performance indicators and demand-side drivers.
Historical & Projected Market Size ($ Million)
Year-over-Year Growth Rate (%)
Market Value vs Volume Growth (%)
Historical Market Performance (2020-2025)
The market's lowest annual expansion occurred in 2021, when revenue increased by 4.8% amid uneven operating restrictions and lower hospitality demand. Growth accelerated to a historical peak of 9.9% in 2022 as foodservice activity resumed and distribution networks normalized. The rate moderated to 6.9% in 2024, reflecting price normalization and delayed capacity commissioning, before recovering to 9.6% in 2025. Over the full period, market value rose by approximately 47.6%, with Java retaining the largest concentration of commercial capacity and contract volumes.
Forecast Market Outlook (2026-2031)
Market value is forecast to increase by approximately USD 4.08 billion between 2025 and 2031. Refrigerated transport, integrated 3PL contracts, pharmaceutical logistics, and multi-client fulfillment are expected to expand faster than conventional pallet storage. Volume is projected to reach 54.3 million tons by 2031, while value reaches USD 9.65 billion. Approximately two percentage points of annual value growth will be generated by pricing, service mix, monitoring, and compliance rather than physical throughput. Capacity additions outside Java will be essential to prevent congestion and improve asset productivity on inter-island routes.
CHAPTER 5 - Market Data
Market Breakdown
The Indonesia Cold Chain Market is transitioning from fragmented storage and transport services toward integrated, digitally monitored networks. For CEOs and investors, value creation depends on balancing capacity growth with utilization, route density, contract duration, energy intensity, and temperature-compliance performance.
Year | Market Size (USD Mn) | YoY Growth (%) | Cold Storage Capacity (000 Tons) | Refrigerated Fleet (Units) | Outsourced 3PL Share (%) | Period |
|---|---|---|---|---|---|---|
| 2020 | $3,773 Mn | +- | 590 | 11,900 | Forecast | |
| 2021 | $3,954 Mn | +4.8% | 625 | 12,700 | Forecast | |
| 2022 | $4,345 Mn | +9.9% | 668 | 13,900 | Forecast | |
| 2023 | $4,753 Mn | +9.4% | 721 | 15,100 | Forecast | |
| 2024 | $5,080 Mn | +6.9% | 814 | 16,600 | Forecast | |
| 2025 | $5,570 Mn | +9.6% | 873 | 18,300 | Forecast | |
| 2026 | $6,105 Mn | +9.6% | 940 | 20,200 | Forecast | |
| 2027 | $6,691 Mn | +9.6% | 1,013 | 22,200 | Forecast | |
| 2028 | $7,333 Mn | +9.6% | 1,092 | 24,300 | Forecast | |
| 2029 | $8,037 Mn | +9.6% | 1,178 | 26,600 | Forecast | |
| 2030 | $8,809 Mn | +9.6% | 1,271 | 29,000 | Forecast | |
| 2031 | $9,654 Mn | +9.6% | 1,372 | 31,600 | Forecast |
Cold Storage Capacity
813,966 tons, 2024, Indonesia. Capacity is concentrated in private facilities, creating opportunities for network consolidation and regional expansion. The Ministry of Marine Affairs and Fisheries registry identified 2,110 cold-storage units, with private operators accounting for 1,882 units.
Refrigerated Fleet
18,300 modeled units, 2025, Indonesia. Fleet scale determines route coverage and service reliability, but operator economics depend on loaded kilometers and backhaul utilization. MGM Bosco reported a fleet exceeding 1,000 refrigerated trucks, illustrating the scale advantage available to national operators.
Outsourced 3PL Share
50%, 2025, Indonesia. Outsourcing expands the addressable revenue pool by transferring asset ownership and compliance responsibility to specialist providers. Indonesia's transportation and storage sector recorded 8.98% year-on-year growth in the fourth quarter of 2025, supporting continued contract-logistics adoption.
CHAPTER 6 - Segmentation
Market Segmentation Framework
Comprehensive analysis across key dimensions providing insights into market structure, customer requirements, service models, and distribution patterns.
No of Segments
7
Dominant Segment
Service Type
Fastest Growing Segment
Business Model
Service Type
Mode of Transport
Shipment Flow
Customer Type
End-Use Industry
Business Model
Geography
Key Segmentation Takeaways
Comprehensive analysis across all extracted segmentation dimensions providing insights into market structure, customer requirements, service models, and distribution patterns.
Service Type
Refrigerated storage remains the largest revenue pool because capacity is capital-intensive, utilization is contracted over longer periods, and customers require inventory control alongside temperature assurance. Frozen warehousing is the dominant Level-2 sub-segment, supported by seafood, poultry, meat, ice cream, and prepared-food inventories. Transport and value-added services increasingly attach to storage contracts, improving customer retention and revenue per pallet.
Business Model
Integrated 3PL is the fastest-growing commercial model as customers seek single accountability for inbound transport, warehousing, order preparation, monitoring, and outbound distribution. End-to-end fulfillment contracts reduce handover risk and allow providers to spread control-tower and quality-assurance costs across larger networks. Operators with multi-temperature assets, national route coverage, and standardized digital reporting are positioned to capture the highest-value contracts.
CHAPTER 7 - Regional Analysis
Regional Analysis
Indonesia is the largest cold-chain market among the selected Southeast Asian peers due to its population scale, food-production base, archipelagic distribution requirements, and extensive domestic shipment flows. Its market position is supported by higher absolute cold-chain expenditure, although Malaysia and Vietnam offer stronger growth in selected specialized logistics segments.
Peer-Country Ranking
1st
Indonesia Market Size (2025)
USD 5.57 Bn
Indonesia CAGR (2026-2031)
9.6%
Peer-Country Ranking
1st
Indonesia Market Size (2025)
USD 5.57 Bn
Indonesia CAGR (2026-2031)
9.6%
Regional Analysis (Current Year)
Market Position
Indonesia ranks first among the five selected peers, with a normalized 2025 market size of USD 5.57 billion, more than twice Thailand's estimated revenue pool.
Growth Advantage
Indonesia's 9.6% forecast CAGR is above Thailand's 3.8% and the Philippines' 8.7%, but below Malaysia's 12.9% specialized-market trajectory.
Competitive Strengths
Indonesia combines 813,966 tons of registered fisheries capacity, over 17,000 islands, and the region's largest national consumer base, creating recurring inter-island logistics demand.
CHAPTER 8 - INDUSTRY ANALYSIS
Growth Drivers, Market Challenges & Market Opportunities
Comprehensive analysis of key factors shaping the Indonesia Cold Chain Market Outlook to 2026F, including growth catalysts, operational challenges, and emerging opportunities across production, distribution, and consumer segments.
Growth Drivers
Expansion of Perishable Food Distribution
- Indonesia's large seafood and aquaculture base requires freezing, pre-cooling, consolidation, and reefer transport, allowing operators near fishing ports to monetize storage turns and export handling. The fisheries cold-storage registry includes 2,110 facilities (latest available, Indonesia).
- Modern retail, restaurant chains, and frozen-food producers require frequent replenishment and narrower delivery windows. Indonesia's digital food-delivery transaction value was reported at approximately USD 4.5 billion (2022, Indonesia), increasing demand for urban temperature-controlled fulfillment.
- Transportation and storage activity expanded by 8.98% year-on-year (Q4 2025, Indonesia), indicating strong underlying freight demand. National cold-chain providers capture value through route density, cross-docking, and bundled warehousing contracts.
Healthcare and Pharmaceutical Compliance
- Vaccines and biologics commonly require controlled temperatures of 2°C to 8°C (health-policy standard, Indonesia), making validation, monitoring, contingency power, and deviation management essential service components.
- Good Distribution Practices require documented controls for pharmaceutical cold-chain products. Compliance raises switching costs because healthcare customers prioritize audited procedures, calibrated equipment, and traceable custody over the lowest transport rate.
- Planned cold-chain procurement included 1,524 vaccine refrigerators and 11,116 carriers or coolboxes (2024 plan, Indonesia). Equipment deployment creates maintenance, replenishment, training, and temperature-monitoring opportunities for specialized logistics providers.
Outsourcing and Integrated 3PL Adoption
- Manufacturers outsource to avoid heavy investment in insulated buildings, refrigeration systems, backup power, vehicles, monitoring platforms, and compliance teams. A national-scale operator reported more than 1,000 refrigerated trucks (2025, Indonesia), demonstrating the capital intensity required.
- Integrated contracts combine storage, transport, inventory management, packaging, and reporting. Bundling raises revenue per customer and reduces handover failures, while multi-client facilities spread fixed energy and labor expenses across broader demand.
- The National Logistics Ecosystem connects public and private logistics processes, supporting documentation and service coordination. Government implementation reached approximately 95.2% of its 2024 action-plan target, improving the environment for digitally integrated logistics services.
Market Challenges
Geographic Fragmentation and Low Route Density
- Inter-island cold freight may require road, port, vessel, and final-mile handovers. Every transfer increases temperature-excursion and dwell-time risk, requiring buffer packaging, monitoring, and backup capacity that raise unit logistics costs.
- Facilities remain concentrated around major Java corridors, while Papua, Maluku, Kalimantan, and parts of Sulawesi have lower shipment density. Regional assets can therefore operate below economically sustainable utilization despite visible unmet demand.
- Indonesia's 2023 LPI score of 3.0 and rank of 63 indicate continuing infrastructure, service-quality, and shipment-reliability constraints. Operators must price route volatility and additional inventory into customer contracts.
Energy and Capital Intensity
- Storage facilities require continuous power, creating exposure to electricity tariffs, grid interruptions, generator fuel, refrigerant maintenance, and peak-load charges. These expenses compress margins when customer contracts lack energy pass-through mechanisms.
- Only 228 of 2,110 registered cold-storage units were government-owned, placing most expansion requirements on private capital. Investors must manage long construction periods and demand risk before facilities reach optimal occupancy.
- Reefer trucks carry higher acquisition, maintenance, and fuel costs than conventional vehicles. Weak return loads can convert commercially attractive outbound routes into low-margin round trips, particularly outside major industrial corridors.
Fragmented Standards and Execution Quality
- Cold-chain performance depends on calibrated sensors, door discipline, pre-cooling, loading practices, sanitation, maintenance, and staff training. Failure at one stage can invalidate performance across the entire custody chain.
- Indonesia's large base of smaller operators creates variation in equipment quality and digital traceability. Customers may face inconsistent reporting, limited insurance coverage, and weak root-cause analysis after product loss.
- Research on fish distribution found that product quality declined between landing and consumption, with handling, sanitation, transport, and hygiene influencing outcomes. These weaknesses create avoidable spoilage and reduce processor realization.
Market Opportunities
Regional Multi-Client Cold Hubs
- Multi-client hubs can generate pallet rent, handling fees, blast-freezing revenue, cross-docking charges, transport margins, and seasonal overflow income from one asset base.
- Fisheries cooperatives, food processors, retailers, restaurants, and pharmaceutical distributors gain access to compliant capacity without constructing proprietary facilities, while infrastructure investors capture contracted cash flow.
- Projects require anchor tenants, reliable grid connections, backup generation, port access, standardized warehouse systems, and enough recurring volume to maintain utilization above investment thresholds.
Pharmaceutical-Grade Cold Logistics
- Providers can charge premiums for validated lanes, continuous monitoring, qualified packaging, calibration, audit support, excursion management, and emergency replenishment services.
- Pharmaceutical manufacturers, distributors, hospitals, laboratories, vaccine programs, and investors benefit from lower product-loss risk and a more defensible, compliance-led service margin.
- Operators need qualified equipment, audited standard operating procedures, trained personnel, contingency plans, data retention, and validated temperature mapping across storage and transport environments.
Digital Control Towers and Energy Optimization
- Subscription-based visibility, route optimization, predictive maintenance, temperature analytics, and automated compliance reporting can add recurring software and managed-service revenue to physical logistics contracts.
- Operators gain higher utilization and lower claims, customers receive shipment transparency, insurers obtain stronger risk evidence, and investors improve asset-level performance monitoring.
- Adoption requires interoperable sensors, standardized data fields, reliable connectivity, cybersecurity controls, energy metering, and customer willingness to integrate order and inventory systems.
CHAPTER 9 - Competitive Landscape
Competitive Landscape Overview
The market combines scaled domestic cold-chain specialists, integrated food distributors, and multinational contract-logistics companies. Entry barriers include capital requirements, route density, energy management, customer audits, temperature compliance, qualified personnel, and the ability to operate reliably across multiple islands.
Market Share Distribution
Top 5 Players
Market Dynamics
8 new entrants in the past 5 years, indicating strong market attractiveness and growth potential.
Company Name | Market Share | Headquarters | Founding Year | Core Market Focus |
|---|---|---|---|---|
MGM Bosco Logistics | - | Jakarta, Indonesia | - | Integrated cold storage, refrigerated transport, fulfillment, and value-added services |
PT Diamond Cold Storage | - | Bekasi, Indonesia | 1974 | Temperature-controlled storage and distribution for dairy, frozen, and processed foods |
PT Wahana Coldstorage Indonesia | - | Surabaya, Indonesia | - | Cold warehousing, seafood storage, and refrigerated distribution |
PT Adib Cold Logistics | - | Jakarta, Indonesia | - | Food and pharmaceutical cold-chain logistics |
GAC Samudera Logistics | - | Jakarta, Indonesia | 1997 | Integrated logistics, warehousing, project cargo, and temperature-controlled services |
DHL Supply Chain Indonesia | - | Bonn, Germany | 1969 | Contract logistics, healthcare logistics, warehousing, and distribution |
Maersk Indonesia | - | Copenhagen, Denmark | 1904 | Reefer ocean transport, inland logistics, and integrated supply-chain services |
Kuehne+Nagel Indonesia | - | Schindellegi, Switzerland | 1890 | Sea, air, road, healthcare, and temperature-controlled contract logistics |
Yusen Logistics Indonesia | - | Tokyo, Japan | 1955 | International forwarding, warehousing, healthcare, and food logistics |
Kamadjaja Logistics | - | Surabaya, Indonesia | 1968 | Domestic distribution, warehousing, transport management, and cold-chain solutions |
Cross Comparison Parameters
The report provides detailed cross-comparison of key players across 10 performance parameters to identify competitive strengths and weaknesses.
Temperature-Controlled Storage Capacity
Refrigerated Fleet and Route Coverage
Cold-Chain Revenue Growth
EBITDA Margin
Analysis Covered
Market Share Analysis:
Compares revenue scale across domestic and multinational cold-chain operators.
Cross Comparison Matrix:
Benchmarks capacity, fleets, growth, margins, coverage, and capabilities.
SWOT Analysis:
Evaluates strategic advantages, operating constraints, risks, and expansion options.
Pricing Strategy Analysis:
Assesses tariff structures, surcharges, contracts, and service premiums.
Company Profiles:
Reviews ownership, networks, service portfolios, customers, and positioning.
CHAPTER 10 - REPORT TOC
Table Of Contents
Market Assessment Phase
Supply-side and competitive intelligence covering market sizing, segmentation, competitive dynamics, regulatory landscape, and future forecasts.
Go-To-Market Strategy Phase
15 chapters
Entry strategy evaluation, execution roadmap, partner recommendations, and profitability outlook.
Survey Phase
8 chapters
Demand-side primary research conducted through structured interviews and online surveys with end users across priority metros and Tier 2/3 cities to capture consumption behavior, unmet needs, and purchase drivers.
Complete Report Coverage
201+ detailed sections covering every aspect of the market
143
Assessment Sections
58
Strategy Sections
CHAPTER 11 - Our Approach
Research Methodology
Desk Research
- Mapped registered cold-storage infrastructure
- Reviewed refrigerated logistics regulations
- Analyzed fisheries and food flows
- Benchmarked operator capacity and fleets
Primary Research
- Cold-chain operations director interviews
- Refrigerated fleet manager interviews
- Food procurement head interviews
- Pharmaceutical quality manager interviews
Validation and Triangulation
- Validated findings across 284 respondents
- Reconciled storage and transport revenues
- Checked throughput against utilization
- Stress-tested pricing and demand assumptions
CHAPTER 12 - FAQ
FAQs
Still have questions?
Our research team is here to help you find the right solution
CHAPTER 13 - Related Research
Explore Related Reports
Expand your market intelligence with complementary research across regions and adjacent markets.
Regional/Country ReportsRelated market analysis across key regions
Related market analysis across key regions
- Kuwait Cold Chain Market Size, Share & Forecast, By Service Type, Mode of Transport & End-Use Industry, 2025-2032
- Vietnam Cold Chain Market Size, Share & Forecast, By Service Type, Mode of Transport & End-Use Industry, 2026-2032
- Mexico Cold Chain Market Size, Share & Forecast, By Service Type, Mode of Transport & End-Use Industry, 2026–2032
- Egypt Cold Chain Market Size, Share & Forecast, By Service Type, Mode of Transport & End-Use Industry, 2026–2032
- Colombia Cold Chain Market Size, Share & Forecast, By Service Type, End-Use Industry & Geography, 2026–2032
Adjacent ReportsRelated markets and complementary research
Related markets and complementary research
- UAE Temperature-Controlled Warehousing Market
- KSA Reefer Transport Services Market
- Egypt Cold Storage Packaging Solutions Market
- South Korea Food Traceability Technology Market
- South Africa Pharmaceutical Logistics Market
500+
Market Research Reports
50+
Countries Covered
15+
Industry Verticals