Iran Fertilizer Distribution & Trading Competition Benchmarking 2025: Distributor Network, Channel Coverage, Product Portfolio & Company Performance
Published on: January 2026
Report Overview
Iran Fertilizer Distribution Market Overview
Market Highlights
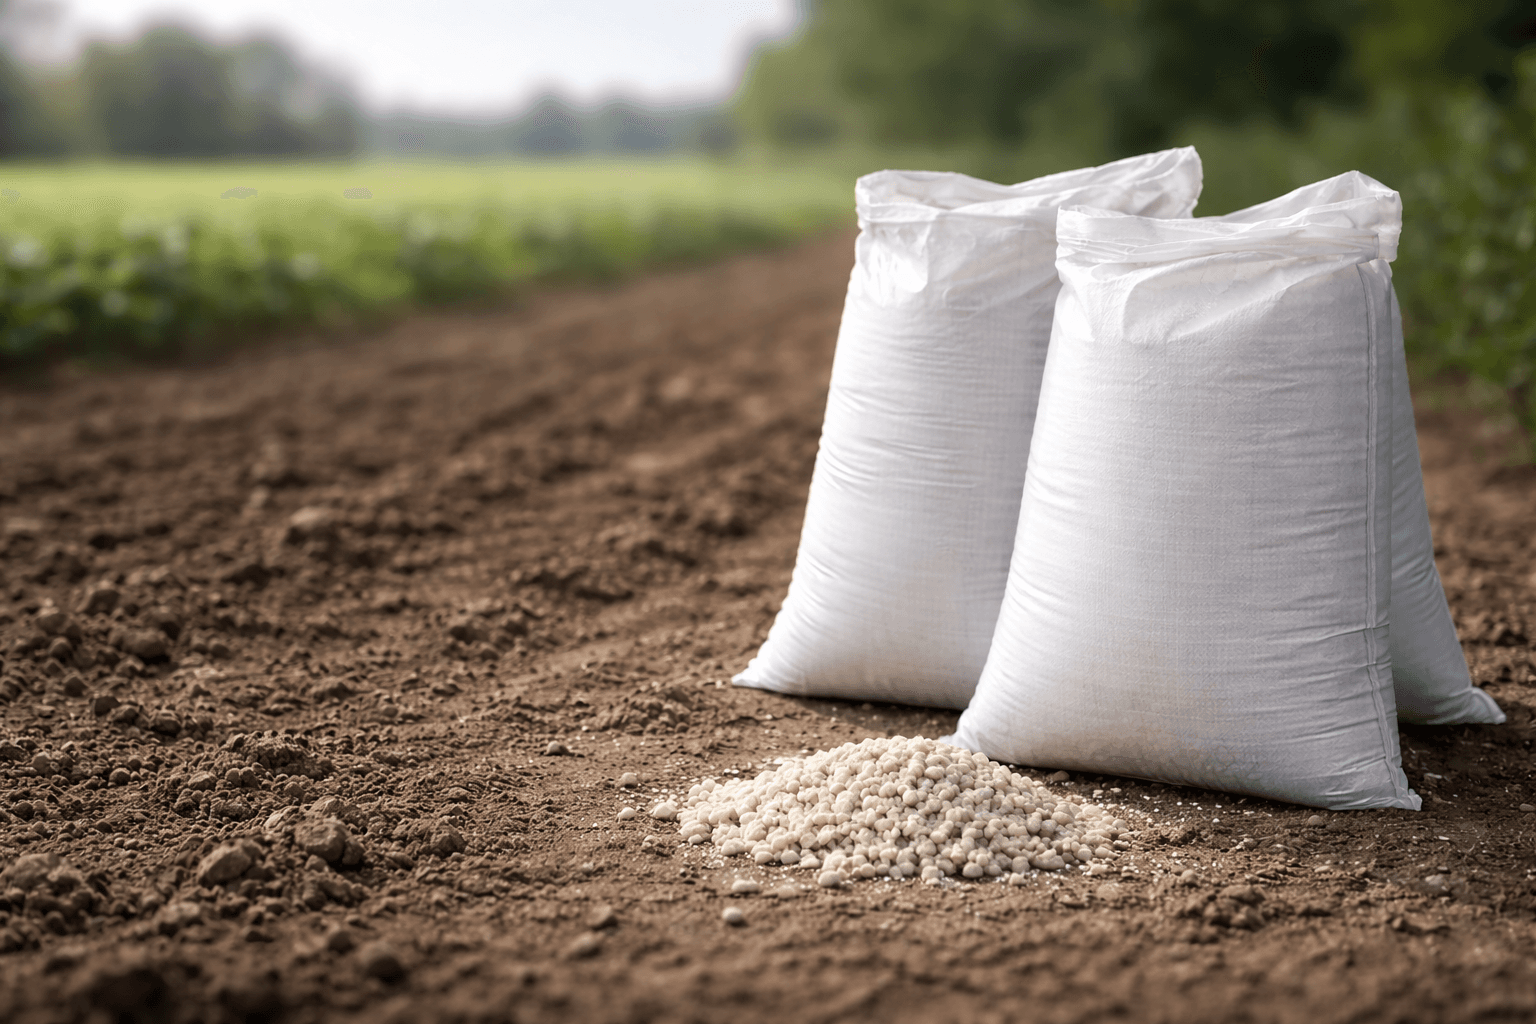
The Iran Fertilizer Distribution Market showcases a diverse competitive structure, where multinational corporations, regional manufacturers, and local firms engage in a dynamic interplay. Multinationals leverage their extensive resources for efficiency, while regional players focus on tailored solutions that resonate with local agricultural practices, and local firms capitalize on agility and niche expertise to carve out market segments.
Innovation from global players is seamlessly integrated with localized strategies, as companies adapt their product offerings to meet the unique needs of Iranian farmers. This includes the development of fertilizers that cater to specific soil types and climatic conditions, ensuring that technological advancements are relevant and effective in the local context.
The distribution and aftersales ecosystem is critical, with a network of partnerships among manufacturers, distributors, and retailers enhancing product accessibility and customer support. Effective aftersales services, including technical assistance and timely delivery, are essential for maintaining customer loyalty and ensuring optimal product performance in the field.
Strategic business approaches emphasize cost management, technology integration, and sustainability, with firms increasingly adopting eco-friendly practices and innovative solutions. The competitive landscape is evolving, driven by a focus on agility and responsiveness, as companies seek to navigate market challenges and capitalize on emerging opportunities in the fertilizer sector.
Ecosystem Matrix
The competitive landscape is shaped by a producer-and-state-led distribution structure, where large entities influence supply continuity and channel control, while mid-tier players compete through regional reach and differentiated distribution partnerships across provinces.
Market competitiveness is largely determined by allocation access, logistics efficiency, and last-mile coverage, with smaller provincial actors strengthening availability in non-metro agrarian belts, where seasonality and working-capital cycles define execution strength.
Leading Player Profiles
Company Profile Overview
The market is structurally anchored by NPC-linked entities and state-linked trading systems, creating high supply predictability and channel discipline, while limiting fragmentation typically seen in open-market distribution environments.
Provincial and institutional arms play a critical role in availability and penetration, making reach, fulfillment speed, and seasonal execution as important as scale in sustaining competitive advantage.
Key Operational Performance Metrics
Company Performance Overview
Unlock Market Insights
Dive deeper into production, distribution, and pricing intelligence.
Get Customized ReportCompetitive outcomes are primarily determined by volume throughput and pricing leverage, while dealer depth, provincial reach, and logistics cost efficiency decide last-mile performance and revenue capture during peak seasonal demand cycles.
Players with stronger allocation access and tighter working-capital cycles generally demonstrate higher execution reliability, while commercial-share expansion depends on network density, service responsiveness, and optimized distribution economics.
Core Financial Performance Metrics
Financial outcomes are typically driven by scale economics, procurement access, and pricing structure, resulting in relatively steadier margin profiles for large integrated entities versus higher variability among regionally focused distributors.
Profitability dispersion is often influenced by working-capital intensity, settlement cycles, and logistics cost management, making operational discipline a primary lever for EBITDA and PAT resilience.
Table of Contents
1. Ecosystem Matrix
1.1 Large Players
1.1.1 Petrochemical Commercial Company (PCC)
1.1.2 Government Trading Corporation of Iran (GTC)
1.1.3 Shiraz Petrochemical Company
1.1.4 Razi Petrochemical Company
1.1.5 Kermanshah Petrochemical Industries
1.1.6 Khark Petrochemical Company
1.2 Medium Players
1.2.1 Fanavaran Petrochemical Company
1.2.2 Lordegan Urea Company
1.2.3 Masjed Soleyman Petrochemical Company
1.2.4 Marvdasht Petrochemical Company
1.2.5 Kimia Pars Middle East
1.3 Small Players
1.3.1 Fars Agricultural Support Company
1.3.2 Khorasan Agricultural Support Company
1.3.3 Mazandaran Agricultural Support Company
1.3.4 Iran Soil & Water Research Institute – Trading Arm
2. Leading Player Profiles
2.1 Company Name
2.2 Group Name
2.3 Headquarters
2.4 Establishment Year
2.5 Mode of Functioning
2.6 Core Service
3. Key Operational Performance Metrics
3.1 Distribution Volume (USD Mn)
3.2 Pricing (USD)
3.3 Dealer / Retail Network
3.4 Provincial Coverage
3.5 Logistics Cost (USD Mn)
3.6 Working Capital Cycle (Days)
3.7 Government Allocation Share (%)
3.8 Commercial / Private Share (%)
4. Core Financial Performance Metrics
4.1 Parameters
4.1.1 Revenue (USD Mn)
4.1.2 Revenue Growth (%)
4.1.3 COGS (USD Mn)
4.1.4 COGS Growth (%)
4.1.5 EBITDA (USD Mn)
4.1.6 EBITDA Growth (%)
4.1.7 EBITDA Margin (%)
4.1.8 PAT (USD Mn)
4.1.9 PAT Margin (%)
5. Methodology
5.1 Approach
5.1.1 Desk Sources
5.1.2 Primary Interviews
5.1.3 Sanity Checking & Validation
5.2 Benchmarking Process
5.2.1 Data Collection
5.2.2 Primary Validation
5.2.3 Proxy KPI Modelling
5.2.4 Normalization & Indexing
5.2.5 Gap Analysis
5.2.6 Peer Review
5.3 Sample Composition
5.3.1 Scope Items
5.3.2 Sample Size
5.3.3 Target Respondents
Methodology
Ken Research will deploy its proprietary, multi-layered research framework combining robust secondary research, targeted primary outreach, and rigorous data validation to deliver an authoritative competitive benchmarking analysis of the Iran fertilizer distribution market.
Desk Sources
- Industry reports from Ken Research proprietary databases and fertilizer & agro-inputs archives
- Company annual reports, statutory filings, and disclosures of NPC-linked entities
- Government publications, including Ministry of Agriculture Jihad, NPC releases, and trade bulletins
- Trade journals, agro-input magazines, and regional fertilizer market bulletins
- Financial and commodity databases
- Logistics, warehousing, and trade-flow databases to assess movement and distribution dynamics
Primary Interviews
- CATI and structured interviews with key market stakeholders
- Category heads and operations managers at fertilizer producers and distributors
- Senior sales and channel leads at leading fertilizer distribution companies
- Regional distributors and last-mile channel partners
- Logistics providers and warehousing operators
- Industry experts and fertilizer market consultants
Sanity Checking & Validation
- Triangulation through cross-verification of secondary data, primary inputs, and proxy KPI outputs
- Proxy KPI synthesis using distribution volumes, allocation share, dealer network size, and provincial coverage to estimate revenues
- Outlier analysis to identify abnormal cost, pricing, or volume metrics and reconcile through follow-up interviews
- Assumption tracking with detailed documentation of pricing controls, subsidy mechanisms, and allocation assumptions
- Internal peer review and validation of models, assumptions, and analytical outputs by senior Ken Research analysts