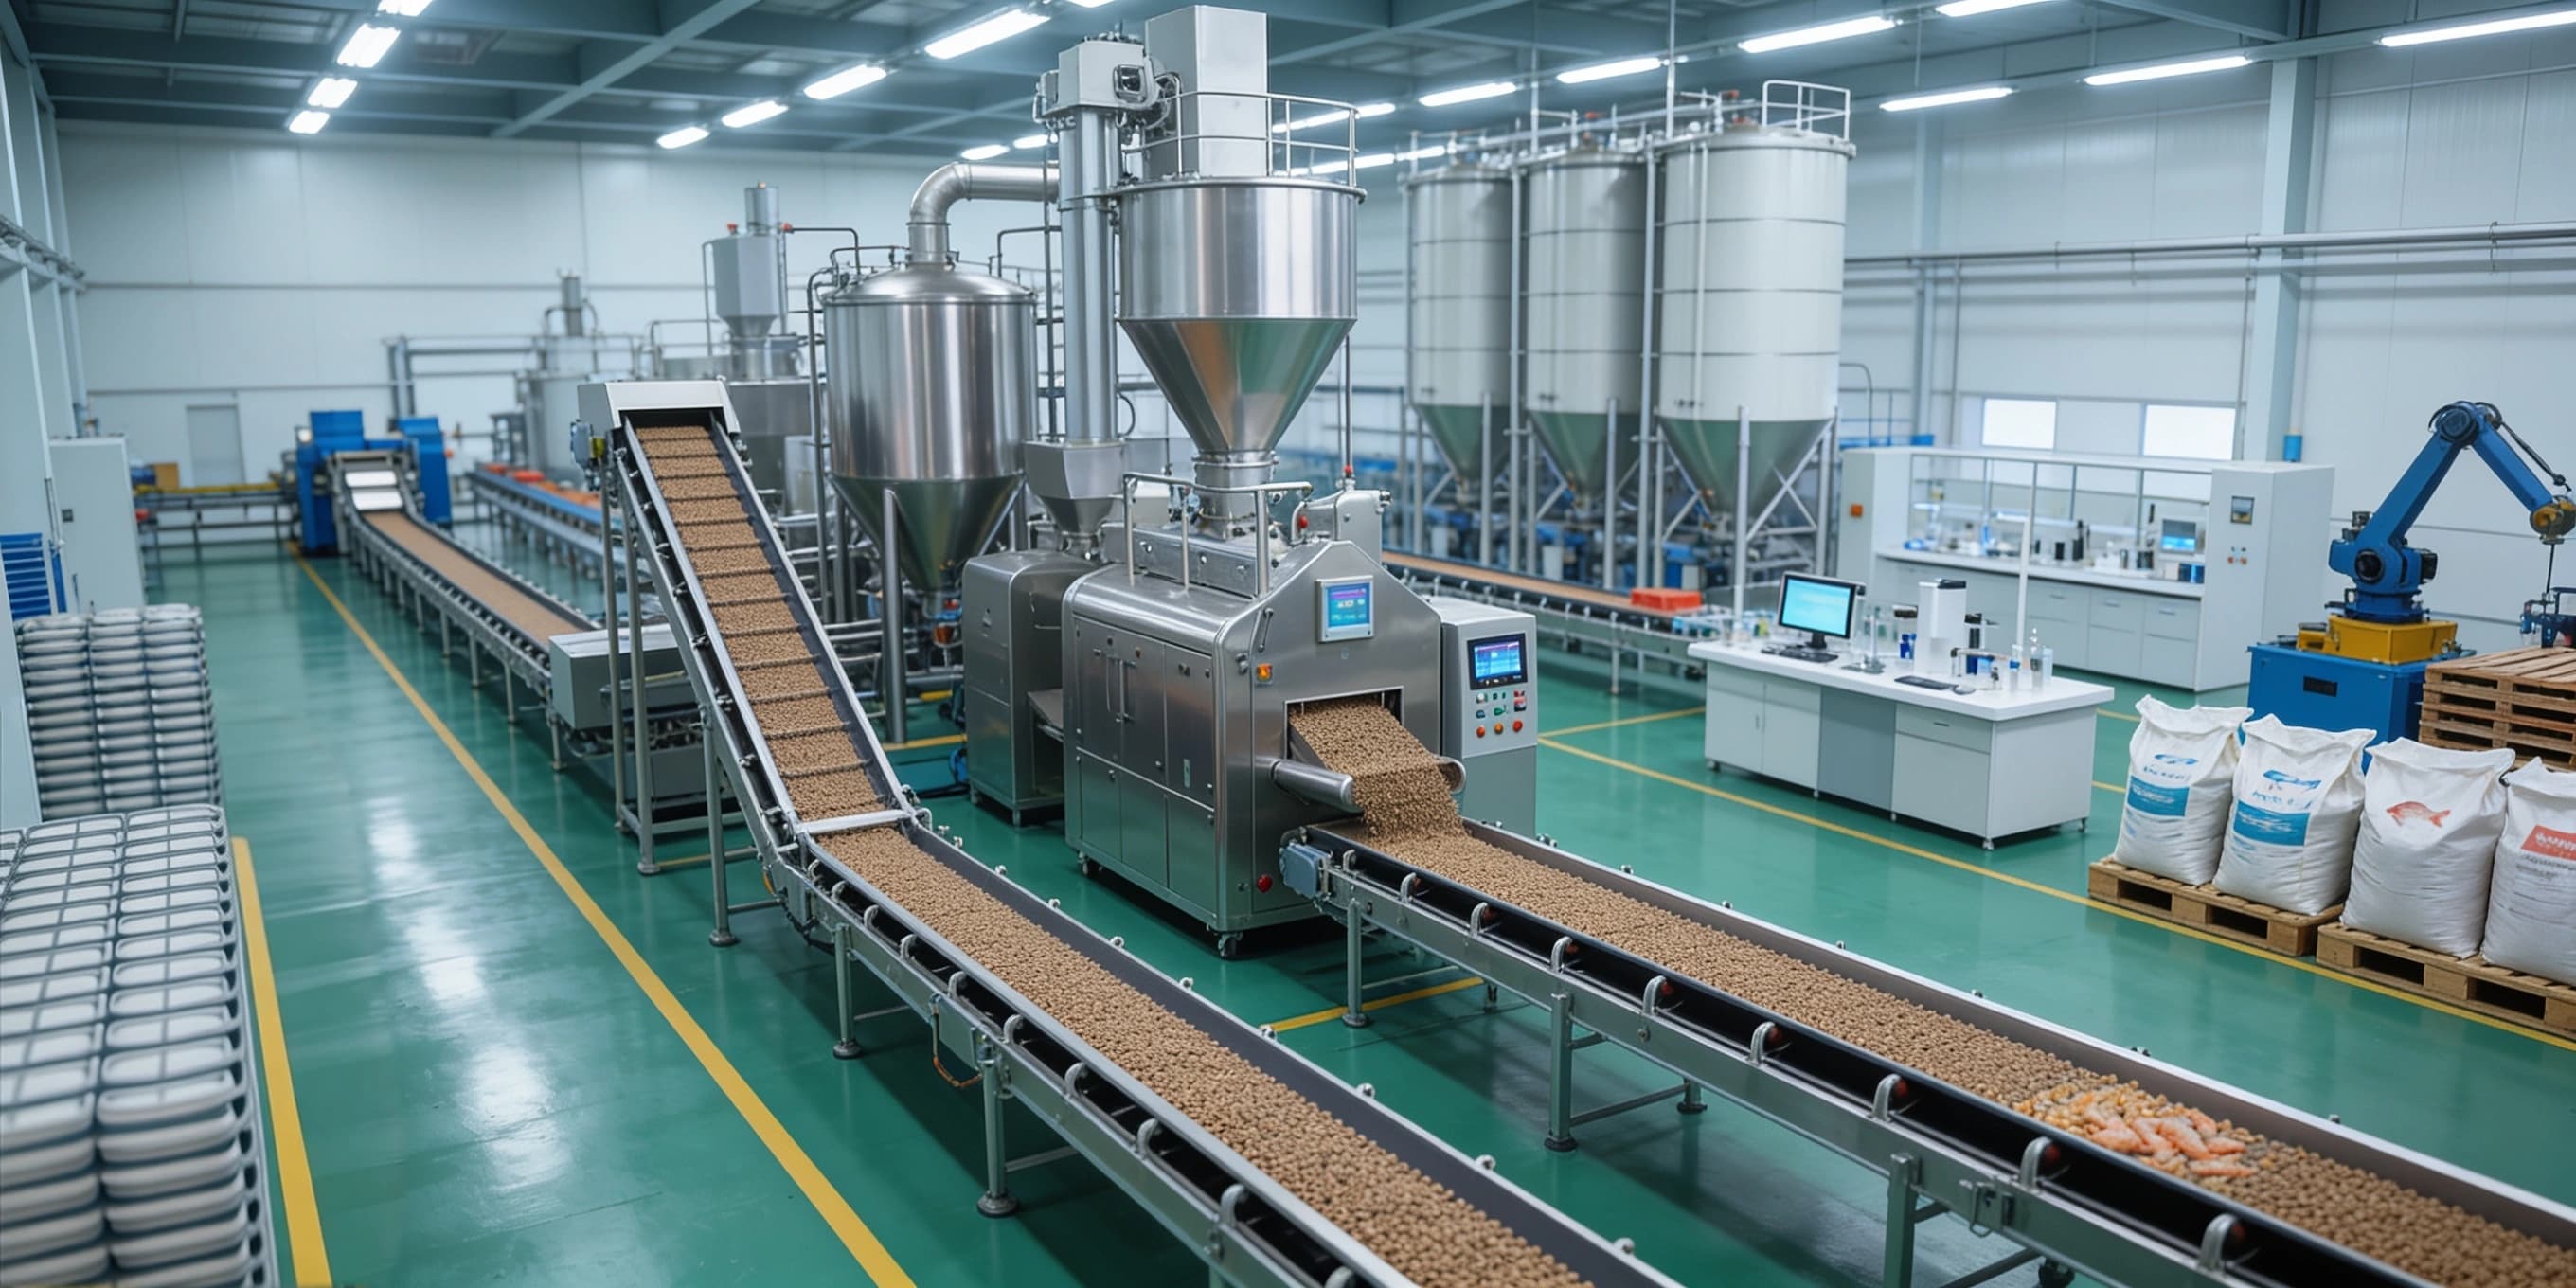
Vietnam Aquaculture Feed & Farm Input Competition Benchmarking 2025: Feed Volume Market Share, FCR Benchmarks, Species Coverage, Certification Portfolio & Farmer Reach
Published on: July 2026
Report Overview
Vietnam Aquaculture Feed & Farm Input Market Overview
Market Highlights
Vietnam’s aquaculture feed and farm input market in 2025 is supported by strong aquaculture output growth, rising seafood demand, and steady modernization of feeding practices. The market size is still expanding, but competition is already intense because scale, formulation quality, and farmer loyalty all matter simultaneously.
Species coverage is a major differentiator because the market serves shrimp, pangasius, tilapia, and other freshwater species with very different feed requirements. Companies that can manage multiple species portfolios while keeping feed efficiency strong are better positioned to protect volume share across changing farm economics.
FCR performance is becoming one of the most visible competitive benchmarks because farmers are highly sensitive to conversion efficiency and total production cost. That means companies with better nutritional science, stable pellet quality, and strong field advisory services are more likely to win repeat demand.
Certification portfolio and farmer reach also matter because buyers increasingly value product safety, technical support, and reliable distribution coverage. The strongest players are those that can combine manufacturing scale, export capability, and dense dealer or direct-to-farm coverage across the main aquaculture belts.
Ecosystem Matrix
The Vietnam aquaculture feed market is dominated by large multinational corporations, leveraging their global expertise and resources to maintain a competitive edge. This dominance is supported by strong local partnerships and extensive distribution networks.
The ecosystem maturity in Vietnam's aquaculture feed sector is evident through the presence of both established local companies and international players. This blend fosters innovation and competition, driving improvements in feed quality and sustainability practices.
Leading Player Profiles
Company Profile Overview
Vietnam's aquaculture feed market in 2025 is characterized by strategic partnerships and technological innovations, with companies focusing on sustainable practices and advanced nutrition solutions to enhance productivity and environmental stewardship.
Operational efficiency is achieved through vertical integration and localised production, allowing companies to maintain a competitive advantage by reducing costs, ensuring quality control, and responding swiftly to market demands.
Key Operational Performance Metrics
Company Performance Overview
Unlock Market Insights
Dive deeper into production, distribution, and pricing intelligence.
Get Customized ReportFeed volume sold, farm client retention, and new aquaculture farm contracts are the primary revenue drivers in Vietnam's aquaculture feed market, reflecting scale, customer loyalty, and market expansion. Pricing is benchmarked by the average price per metric ton in USD Mn, critical for revenue optimization.
Operational metrics such as feed conversion ratio improvement, delivery lead time, and feed quality compliance rate are key competitive levers. Companies differentiate through specialized feed sales, local ingredient sourcing, and on-farm technical support, enhancing customer value and market positioning.
Core Financial Performance Metrics
Large-tier companies like C.P. Vietnam Corporation exhibit superior scale, pricing power, and margin resilience compared to smaller peers, enabling them to maintain robust financial health and competitive advantage in the Vietnam aquaculture feed market.
Top-tier players demonstrate greater cost efficiency and financial stability, with lower-tier companies facing challenges in optimizing operations and sustaining profitability, highlighting significant gaps in operational effectiveness and financial robustness.
Table of Contents
1. Ecosystem Matrix
1.1 Large Players
1.1.1 C.P. Vietnam Corporation
1.1.2 De Heus Vietnam Co., Ltd.
1.1.3 GreenFeed Vietnam Joint Stock Company
1.1.4 Cargill Vietnam Co., Ltd.
1.1.5 Uni-President Vietnam Co., Ltd.
1.1.6 Skretting Vietnam Ltd.
1.1.7 Grobest Vietnam Co., Ltd.
1.2 Medium Players
1.2.1 Proconco Vietnam
1.2.2 Dabaco Group (Feed Division)
1.2.3 New Hope Vietnam Co., Ltd.
1.2.4 Haid Vietnam Co., Ltd.
1.2.5 Tongwei Vietnam Co., Ltd.
1.2.6 CJ Vina Agri Co., Ltd.
1.2.7 Anova Feed Joint Stock Company
1.2.8 BioMar Vietnam Co., Ltd.
1.2.9 Viet Thang Feed Joint Stock Company
1.3 Small Players
1.3.1 AFIEX Aquafeed
1.3.2 Sao Mai Feed
2. Leading Player Profiles
2.1 Parameters
2.1.1 Company Name
2.1.2 Group Name
2.1.3 Headquarters
2.1.4 Established Year
2.1.5 Core Services
2.1.6 Mode of Functioning
2.2. Players
2.2.1 C.P. Vietnam Corporation
2.2.2 De Heus Vietnam Co., Ltd.
2.2.3 GreenFeed Vietnam Joint Stock Company
2.2.4 Cargill Vietnam Co., Ltd.
2.2.5 Uni-President Vietnam Co., Ltd.
2.2.6 Skretting Vietnam Ltd.
2.2.7 Grobest Vietnam Co., Ltd.
2.2.8 Proconco Vietnam
2.2.9 Dabaco Group (Feed Division)
2.2.10 New Hope Vietnam Co., Ltd.
2.2.11 Haid Vietnam Co., Ltd.
2.2.12 Tongwei Vietnam Co., Ltd.
2.2.13 CJ Vina Agri Co., Ltd.
2.2.14 Anova Feed Joint Stock Company
2.2.15 BioMar Vietnam Co., Ltd.
2.2.16 Viet Thang Feed Joint Stock Company
2.2.17 AFIEX Aquafeed
2.2.18 Sao Mai Feed
3. Key Operational Performance Metrics
3.1 Parameters
3.1.1 Feed Volume Sold (tons)
3.1.2 Farm Client Retention Rate (%)
3.1.3 New Aquaculture Farm Contracts (units)
3.1.4 Average Price per Metric Ton (USD Mn)
3.1.5 Feed Conversion Ratio Improvement (%)
3.1.6 Delivery Lead Time (days)
3.1.7 Percentage of Specialized Feed Sales (%)
3.1.8 On-Farm Technical Support Visits (visits/month)
3.1.9 Local Ingredient Sourcing Ratio (%)
3.1.10 Feed Quality Compliance Rate (%)
4. Core Financial Performance Metrics
4.1 Parameters
4.1.1 Revenue (USD Mn)
4.1.2 Revenue Growth (%)
4.1.3 COGS (USD Mn)
4.1.4 COGS Growth (%)
4.1.5 EBITDA (USD Mn)
4.1.6 EBITDA Growth (%)
4.1.7 EBITDA Margin (%)
4.1.8 PAT (USD Mn)
4.1.9 PAT Margin (%)
5. Methodology
5.1 Approach
5.1.1 Desk Sources
5.1.2 Primary Interviews
5.1.3 Sanity Checking & Validation
5.2 Benchmarking Process
5.2.1 Data Collection
5.2.2 Primary Validation
5.2.3 Proxy KPI Modelling
5.2.4 Normalization & Indexing
5.2.5 Gap Analysis
5.2.6 Peer Review
5.3 Sample Composition
5.3.1 Scope Items
5.3.2 Sample Size
5.3.3 Target Respondents
Methodology
Ken Research will deploy its proprietary, multi-layered research framework—combining robust secondary research, targeted primary outreach, and rigorous data validation—to deliver an authoritative competitive landscape analysis of the Vietnam Aquaculture Feed & Farm Input Competition Benchmarking 2025: Feed Volume Market.
Desk Sources
- Industry reports (Proprietary databases, Ken Research archives, and major regional or global market sources relevant to Vietnam Aquaculture Feed & Farm Input Competition Benchmarking 2025: Feed Volume Market)
- Company annual reports & investor presentations of large and emerging players in the Vietnam Aquaculture Feed & Farm Input Competition Benchmarking 2025: Feed Volume Market
- Government & trade association publications related to the Vietnam Aquaculture Feed & Farm Input Competition Benchmarking 2025: Feed Volume Market sector
- Trade magazines, journals, and e-articles specific to Vietnam Aquaculture Feed & Farm Input Competition Benchmarking 2025: Feed Volume Market
- Financial databases (Bloomberg, Capital IQ, Factiva)
- Web traffic & app-usage dashboards (SimilarWeb, App Annie, or equivalents) for online or digital players in this market
Primary Interviews
- Category Managers / R&D Heads of key Vietnam Aquaculture Feed & Farm Input Competition Benchmarking 2025: Feed Volume Market producers or service providers
- Senior Sales/Marketing Leads at leading firms
- Distributors, channel partners, or trade buyers active in this market
- Technology/service providers supporting the ecosystem
- Industry analysts and consultants with expertise in Vietnam Aquaculture Feed & Farm Input Competition Benchmarking 2025: Feed Volume Market
Sanity Checking and Validation
- Triangulation: Cross-verify estimates from secondary data, primary inputs, and proxy model outputs
- Proxy KPI synthesis: Use related KPIs (e.g., capacity, throughput, transaction volumes, web traffic, or installation base) to approximate market performance
- Outlier analysis: Identify and reconcile anomalous data points via follow-up validation
- Assumption tracking: Maintain a log of all benchmarking assumptions, with clear notes on limitations and proxy KPI sources
- Peer review: Internal expert review of methodology, models, and key outputs before finalization