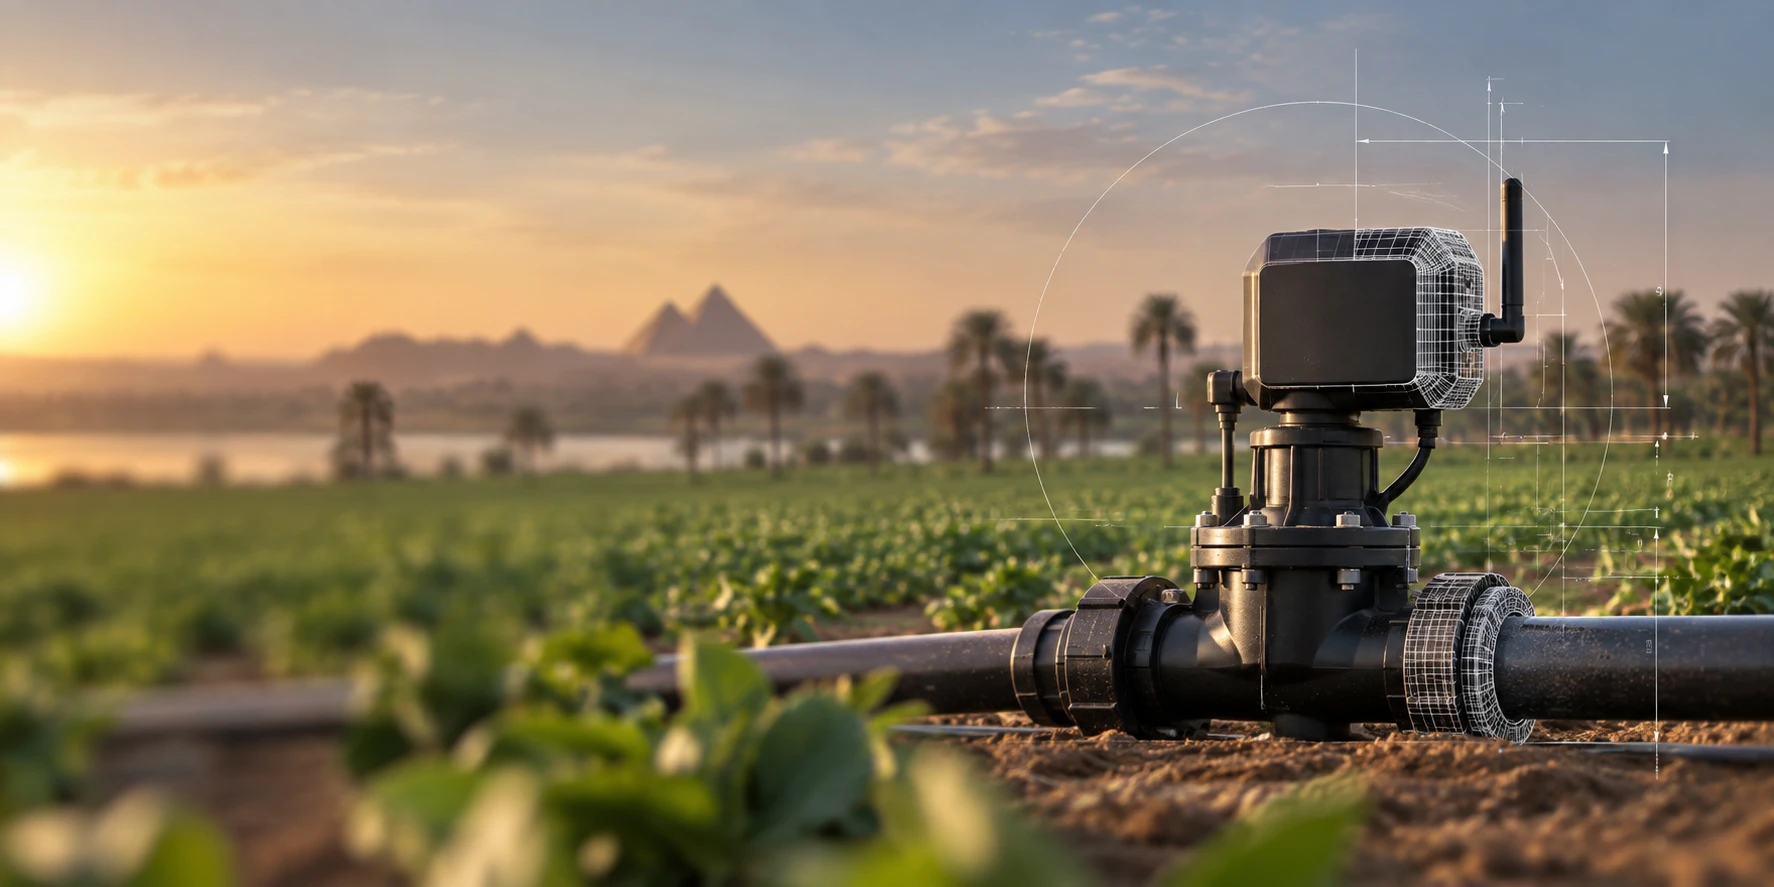
CHAPTER 1 - MARKET SUMMARY
Market Overview
The Egypt Smart Irrigation Systems Market serves an agricultural economy in which dependable irrigation is structurally necessary rather than discretionary. FAO data identifies approximately 3.42 million hectares equipped for irrigation, creating a large addressable base for drip systems, pivots, automated valves, moisture sensors and scheduling platforms. Commercial demand is strongest where water cost, pumping expense and crop value make precision control financially measurable.
The Nile Valley and Delta remain the core service and replacement market because approximately 85% of Egypt's historically equipped irrigation area was concentrated there. Dense farming, fragmented holdings and established dealer networks favor modular retrofits, while reclamation areas in the Western Desert create larger turnkey opportunities for pivots, drip networks and centralized monitoring. This geographic split creates distinct smallholder-retrofit and mega-project business models.
Market Value
USD 95 million
2025
Dominant Region
Nile Delta
2025
Dominant Segment
Drip and Micro-Irrigation Systems
fastest growing
Total Number of Players
25
Future Outlook
The Egypt Smart Irrigation Systems Market is projected to move from USD 95 million in 2025 to USD 226 million by 2032, translating into a 13.18% CAGR across the 2025-2032 model window. This represents a material acceleration from the 9.26% historical CAGR recorded during 2020-2025. The forecast assumes stronger deployment across new reclaimed land, commercial farms, orchards and protected agriculture, supported by the economics of lower water losses and more accurate fertigation. Connected controllers and sensing are expected to capture a larger portion of system value as growers increasingly measure irrigation decisions rather than operate on fixed schedules.
Annual smart-system deployment is modeled to increase from approximately 305,000 feddans in 2025 to 660,000 feddans by 2032. Connected-control penetration within new deployments rises from about 26% to 54%, creating profit-pool migration from pipes and mechanical hardware toward controllers, valves, telemetry, sensors, software-enabled scheduling and lifecycle services. The pricing outlook remains disciplined: the blended installed system ASP is modeled to move from approximately USD 311 per newly equipped feddan in 2025 to USD 342 by 2032 as higher-value electronics offset competitive pressure on basic components. Financing availability and local technical support remain central to adoption.
13.18%
Forecast CAGR
$226 Mn
2030 Projection
Base Year
2025
Historical Period
2020-2025
Forecast Period
2025-2032
Historical CAGR
9.26%
CHAPTER 2 - SCOPE OF REPORT
Scope of the Market
CHAPTER 3 - Key Stakeholders
Key Target Audience
Key stakeholders who can leverage from this market analysis for investment, strategy, and operational planning.
Investors
CAGR, connected penetration, capex payback, consolidation, risk
Corporates
installed base, ASP, dealer reach, service economics
Government
water efficiency, modernization, reclamation, compliance, resilience
Operators
pressure control, fertigation, telemetry, uptime, maintenance
Financial institutions
equipment finance, payback, collateral, demand stability
CHAPTER 4 - Market Size & Growth
Market Size, Growth Forecast and Trends
This section evaluates the historical market size, analyzes year-over-year growth dynamics, and presents forecast projections supported by market performance indicators and demand-side drivers.
Historical & Projected Market Size ($ Million)
Year-over-Year Growth Rate (%)
Market Value vs Volume Growth (%)
Historical Market Performance (2020-2025)
Historical value expanded from USD 61 million in 2020 to USD 95 million in 2025, equivalent to a 9.26% CAGR. The operational model indicates annual smart-system deployment increased from roughly 180,000 to 305,000 feddans over the same period. Competitive hardware sourcing reduced the modeled blended ASP from USD 339 to USD 311 per newly equipped feddan, meaning deployment volume grew faster than value. The market consequently broadened beyond premium commercial farms while remaining constrained by smallholder financing, fragmented plots and the technical demands of maintaining pressurized irrigation networks.
Forecast Market Outlook (2025-2032)
Forecast growth is increasingly mix-driven as automation, sensors and remote controls supplement physical irrigation infrastructure. Annual smart-system deployment is projected to rise from 305,000 feddans in 2025 to 660,000 in 2032, while connected-control penetration reaches approximately 54% of annual deployments. The blended ASP rises gradually to USD 342 as electronics, telemetry and control content increase. These operating assumptions reconcile with a USD 226 million terminal market and 13.18% CAGR. New-land projects, export horticulture and lifecycle optimization are expected to produce the strongest incremental revenue pools.
CHAPTER 5 - Market Data
Market Breakdown
The Egypt Smart Irrigation Systems Market is transitioning from hardware-led modernization toward higher-value integrated systems. For CEOs and investors, deployment area determines volume growth while connectivity penetration and system ASP indicate how rapidly the profit pool is moving toward automation, sensing and recurring technical support.
Year | Market Size (USD Mn) | YoY Growth (%) | Annual Smart-System Deployment Area (000 Feddans) | Connected Control Penetration (%) | Blended System ASP (USD/Feddan) | Period |
|---|---|---|---|---|---|---|
| 2020 | $61 Mn | +- | 180 | 14% | Forecast | |
| 2021 | $66 Mn | +8.20% | 198 | 16% | Forecast | |
| 2022 | $72 Mn | +9.09% | 220 | 18% | Forecast | |
| 2023 | $79 Mn | +9.72% | 246 | 20% | Forecast | |
| 2024 | $87 Mn | +10.13% | 275 | 23% | Forecast | |
| 2025 | $95 Mn | +9.20% | 305 | 26% | Forecast | |
| 2026 | $108 Mn | +13.68% | 342 | 30% | Forecast | |
| 2027 | $122 Mn | +12.96% | 383 | 34% | Forecast | |
| 2028 | $138 Mn | +13.11% | 428 | 38% | Forecast | |
| 2029 | $156 Mn | +13.04% | 478 | 42% | Forecast | |
| 2030 | $176 Mn | +12.82% | 533 | 46% | Forecast | |
| 2031 | $200 Mn | +13.64% | 594 | 50% | Forecast | |
| 2032 | $226 Mn | +13.00% | 660 | 54% | Forecast |
Annual Smart-System Deployment Area
750,000 new feddans, 2025/26, Egypt. The national expansion target increases the addressable pool for turnkey drip, pivot and automation packages, favoring suppliers capable of engineering, installation and lifecycle service at reclamation-project scale.
Connected Control Penetration
15% potential water saving and 25% operational-efficiency improvement, 2026, technology benchmark. Digital control creates measurable economic value beyond basic irrigation hardware, supporting sensor, telemetry and software attachment to new Egyptian installations.
Blended System ASP
Up to 85% financing, current program, Egypt. Financing for replacing flood irrigation with sprinkler or drip systems reduces the upfront affordability barrier, enabling system suppliers to sell more complete configurations rather than compete solely on low-cost components.
CHAPTER 6 - Segmentation
Market Segmentation Framework
Comprehensive analysis across key dimensions providing insights into market structure, customer requirements, irrigation applications and route-to-market patterns.
No of Segments
7
Dominant Segment
Product Type
Fastest Growing Segment
Application
Product Type
Crop Type
Customer Type
Application
Sales Channel
Farm Size
Geography
Key Segmentation Takeaways
Comprehensive analysis across all extracted segmentation dimensions providing insights into market structure, customer requirements and distribution patterns.
Product Type
Hardware remains the largest revenue-allocation axis because irrigation projects begin with hydraulic infrastructure. Drip and Micro-Irrigation Systems are the dominant Level-2 pool, supported by Egypt's water constraints and suitability for orchards, horticulture and reclaimed land. Controllers, valves and sensing increasingly attach to these systems, raising project value and creating differentiated opportunities for automation-led suppliers.
Application
Remote Monitoring and Scheduling is the fastest-expanding Level-2 application as mobile connectivity, soil-moisture measurement and remote pump or valve operation reduce dependence on manual irrigation decisions. Growth is particularly relevant for dispersed commercial farms and large reclamation projects, where centralized oversight lowers field labor requirements and supports more consistent water and fertigation performance across multiple irrigation zones.
CHAPTER 7 - Regional Analysis
Regional Analysis
A normalized peer comparison places Egypt behind Saudi Arabia and Morocco by smart-irrigation market value but ahead of the UAE and Jordan within the selected Middle East and North Africa peer set. Egypt's larger irrigated agricultural base, new-land development and modernization financing provide stronger scale economics than smaller arid markets.
Peer Country Ranking
3rd
Egypt Market Size (2025)
USD 95 Mn
Egypt CAGR (2025-2032)
13.18%
Peer Country Ranking
3rd
Egypt Market Size (2025)
USD 95 Mn
Egypt CAGR (2025-2032)
13.18%
Regional Analysis (Current Year)
Market Position
Egypt ranks third in the selected peer set at USD 95 million, with a 3.42 million-hectare historical irrigation base providing unusually broad retrofit and modernization potential.
Growth Advantage
Egypt's modeled 13.18% CAGR trails Saudi Arabia's 13.75% but exceeds the 12.60% Morocco benchmark, positioning Egypt as a high-growth challenger supported by large-scale agricultural expansion.
Competitive Strengths
Egypt combines a 750,000-feddan new-land target with financing of up to 85% for modern irrigation upgrades, improving project pipeline visibility and farmer affordability simultaneously.
CHAPTER 8 - INDUSTRY ANALYSIS
Growth Drivers, Challenges & Opportunities
Comprehensive analysis of key factors shaping the Egypt Smart Irrigation Systems Market, including growth catalysts, operational challenges, and emerging opportunities across equipment, system integration and agricultural end-use segments.
Growth Drivers
Structural Need for Higher Agricultural Water Efficiency
- Modernized systems increased tail-end water availability from 50% to 85% of water flow (project results, Egypt), demonstrating how improved control converts infrastructure spending into more reliable farm output.
- Pumping-energy costs fell by 46% (project results, Egypt) under irrigation modernization, strengthening farmer payback when smart valves, scheduling and pumps are sold as an integrated efficiency package.
- Net income per cropped feddan increased by 13%-25% (project results, Egypt), giving commercial farms and lenders an economic basis for evaluating precision-irrigation investment beyond water conservation alone.
New-Land Cultivation and Agricultural Expansion
- The expansion target of 750,000 feddans (2025/26, Egypt) favors center pivots, drip networks and centralized controls because newly reclaimed areas can adopt pressurized systems without retrofitting legacy field layouts.
- Agricultural crop exports are targeted at USD 5 billion (2025/26, Egypt), strengthening the business case for precise irrigation and fertigation where product quality, yield consistency and water availability determine export profitability.
- Egypt's irrigation potential has been assessed at approximately 4.42 million hectares (FAO reference, Egypt), indicating headroom between the long-term physical irrigation envelope and historically equipped land.
Financing and Digital-Control Adoption
- Financing of up to 85% (current program, Egypt) lowers the initial cash burden for farms replacing flood irrigation, expanding the customer pool available to equipment dealers and system integrators.
- Automation and digital control can deliver up to 15% water saving (2026 technology benchmark), creating an ROI pathway for controllers, flow sensors and remote operation beyond basic drip hardware.
- The same digital-control benchmark indicates up to 25% operational-efficiency improvement (2026), increasing the strategic relevance of software-assisted scheduling for large farms managing geographically dispersed irrigation assets.
Market Challenges
Smallholder Capital and Rural Finance Constraints
- Approximately 70% of farm holdings below 0.42 hectares (FAO reference, Egypt) limits the economic scale of individual installations and raises distributor acquisition, training and after-sales costs per customer.
- IFAD has identified lengthy procedures and collateral requirements as rural-finance barriers, making credit access a structural constraint even where irrigation technology has a positive farm-level return. Targeted smallholder finance remains a stated intervention priority (IFAD, Egypt).
- Recent IFAD implementation review recorded USD 1.7 million withdrawn while a larger credit line had not yet reached target beneficiaries (2025, Egypt), illustrating execution risk between approved financing and farmer-level deployment.
Legacy Irrigation Infrastructure and Maintenance Requirements
- Historical FAO data recorded approximately 3.03 million hectares under surface irrigation (2000, Egypt), showing why conversion requires more than equipment sales and often needs hydraulic redesign, filtration and pressure management.
- IFAD has identified old inefficient irrigation infrastructure and inadequate maintenance mechanisms (Egypt program assessment) as sustainability constraints, raising lifecycle-service requirements for smart-system suppliers.
- World Bank modernization experience covered around 197,633 water users (Egypt project areas), demonstrating that performance depends on coordinated operations and water-user behavior in addition to farm-level hardware.
Technical Capability and After-Sales Execution
- Adoption of improved irrigation, climate-resilient and solar techniques reached around one-third of respondents (evaluation evidence, Egypt), indicating room for deeper technical adoption and structured user support.
- Smart irrigation requires reliable sensor calibration, valve control and communications; MWRI demonstrations linking soil-moisture readings to mobile devices show remote farmer notification capability (2021, Egypt) but also raise requirements for field support and user training.
- National distributors increasingly differentiate through service: Orascom Services describes countrywide after-sales coverage (current, Egypt), showing that maintenance capacity is becoming a competitive factor alongside equipment availability.
Market Opportunities
Large-Scale Reclamation and Turnkey Irrigation Packages
- 750,000 new feddans (2025/26, Egypt) can support revenue models combining engineering, hardware, installation, commissioning and long-term maintenance instead of stand-alone component sales.
- OEMs, EPC firms and system integrators benefit as reclamation projects require reliable hydraulic design and remote supervision at a scale beyond individual smallholder installations. Orascom Services identifies mega-project agriculture as a core smart-irrigation customer segment (Egypt).
- Opportunity realization requires irrigation specifications that embed telemetry and control at construction stage rather than treating digital functions as later retrofits. MWRI has demonstrated remote pump operation through mobile applications (Egypt).
Connected Retrofit of Existing Irrigation Networks
- The 3.42 million-hectare equipped base (FAO reference, Egypt) supports recurring retrofit demand because digital controls can be added to functioning drip, sprinkler and pump infrastructure without replacing the full hydraulic network.
- Farm operators and technology vendors benefit from a shift toward monitoring services where digital control can improve operational efficiency by up to 25% (2026 benchmark), supporting higher software and service content.
- Scale requires interoperable controllers, reliable communications and field-service networks; Hunter's Egyptian distributor listing confirms authorized distribution presence in Cairo (current), illustrating how global technology can be localized through established channels.
Export Horticulture and Precision Fertigation
- USD 5 billion agricultural crop exports target (2025/26, Egypt) increases the value of irrigation consistency where size, appearance and yield affect contract compliance and export margins.
- Growers, system suppliers and fertilizer-service providers can capture value through integrated fertigation, flow measurement and moisture monitoring rather than hardware-only sales. Netafim's digital platform manages irrigation and fertigation from planning through validation (current).
- Adoption requires reliable finance and crop-level ROI measurement; available programs can finance up to 85% of modern-irrigation investment (Egypt), making bundled precision packages more accessible to qualifying farms.
CHAPTER 9 - Competitive Landscape
Competitive Landscape Overview
The competitive landscape combines global irrigation OEMs with Egyptian distributors and integrators. Entry barriers center on hydraulic engineering, reliable after-sales service, project references, localized inventory and the ability to combine irrigation hardware with digital control.
Market Share Distribution
Top 5 Players
Market Dynamics
8 new entrants in the past 5 years, indicating strong market attractiveness and growth potential.
Company Name | Market Share | Headquarters | Founding Year | Core Market Focus |
|---|---|---|---|---|
Netafim | - | Giv'atayim, Israel | 1965 | Precision drip irrigation, fertigation and digital irrigation management |
Rivulis Irrigation | - | - | - | Micro-irrigation, driplines, filtration and turnkey irrigation solutions |
Rain Bird Corporation | - | Azusa, California, USA | 1933 | Sprinklers, dripline, pumps, controllers and water-management systems |
Hunter Industries | - | San Marcos, California, USA | 1981 | Water-efficient irrigation controls, sprinklers and agricultural irrigation solutions |
The Toro Company | - | Bloomington, Minnesota, USA | 1914 | Agricultural drip irrigation and automated irrigation controls |
Lindsay Corporation | - | Omaha, Nebraska, USA | 1955 | Zimmatic pivots, FieldNET remote control and irrigation scheduling |
Valmont Industries | - | Omaha, Nebraska, USA | 1946 | Valley center pivots, remote monitoring and precision irrigation technology |
Irritec | - | Capo d'Orlando, Italy | 1974 | Drip irrigation, filtration, fertigation and remote-control systems |
Galcon | - | - | - | Computerized irrigation controllers, cloud control and fertigation automation |
BERMAD | - | - | 1965 | Hydraulic control valves, metering and digital water-management solutions |
Cross Comparison Parameters
The report provides detailed cross-comparison of key players across 10 performance parameters to identify competitive strengths and weaknesses.
Water-Use Efficiency Improvement (%)
Remote-Controlled Installed Base (%)
Egypt Irrigation Revenue Growth (%)
Gross Margin on Smart Irrigation Systems (%)
Analysis Covered
Market Share Analysis:
Benchmarks supplier positioning across hardware, automation and project channels.
Cross Comparison Matrix:
Compares operational capability, digital penetration, revenue growth and margins.
SWOT Analysis:
Assesses technology differentiation, channel strength, constraints and expansion opportunities.
Pricing Strategy Analysis:
Evaluates system pricing, project bundling and lifecycle service monetization.
Company Profiles:
Reviews corporate footprint, irrigation focus and Egypt-relevant capabilities comprehensively.
CHAPTER 10 - REPORT TOC
Table of Contents
Market Assessment Phase
Supply-side and competitive intelligence covering market sizing, segmentation, competitive dynamics, regulatory landscape, and future forecasts.
Go-To-Market Strategy Phase
15 chapters
Entry strategy evaluation, execution roadmap, partner recommendations, and profitability outlook.
Survey Phase
8 chapters
Demand-side primary research conducted through structured interviews and online surveys with end users across priority metros and Tier 2/3 cities to capture consumption behavior, unmet needs, and purchase drivers.
Complete Report Coverage
201+ detailed sections covering every aspect of the market
143
Assessment Sections
58
Strategy Sections
CHAPTER 11 - Our Approach
Research Methodology
Desk Research
- Mapped Egypt irrigation modernization programs
- Reviewed irrigated land and crop data
- Tracked irrigation OEM product portfolios
- Assessed smart-control adoption benchmarks
Primary Research
- Interviewed irrigation project managers
- Engaged commercial farm managers
- Consulted irrigation technical sales managers
- Interviewed cooperative and farm owners
Validation and Triangulation
- 356 stakeholder responses cross-checked nationally
- Validated dealer and farm estimates
- Reconciled area with installed pricing
- Tested forecast against adoption scenarios
CHAPTER 12 - FAQ
FAQs
Still have questions?
Our research team is here to help you find the right solution
CHAPTER 13 - Related Research
Explore Related Reports
Expand your market intelligence with complementary research across regions and adjacent markets.
Regional/Country ReportsRelated market analysis across key regions
Related market analysis across key regions
- Indonesia Smart Irrigation Systems Market
- Vietnam Smart Irrigation Systems Market
- Thailand Smart Irrigation Systems Market
- Malaysia Smart Irrigation Systems Market
- Philippines Smart Irrigation Systems Market
Adjacent ReportsRelated markets and complementary research
Related markets and complementary research
- North America Precision Agriculture Market Outlook to 2030: Size, Share, Growth and Trends
- South Africa Irrigation Management Software Market
- South Korea Crop Monitoring Technology Market
- GCC weather forecasting services market report size, share, growth drivers, trends, opportunities & forecast 2025–2030
- Brazil Water Conservation Systems Market
500+
Market Research Reports
50+
Countries Covered
15+
Industry Verticals