CHAPTER 1 - MARKET SUMMARY
Market Overview
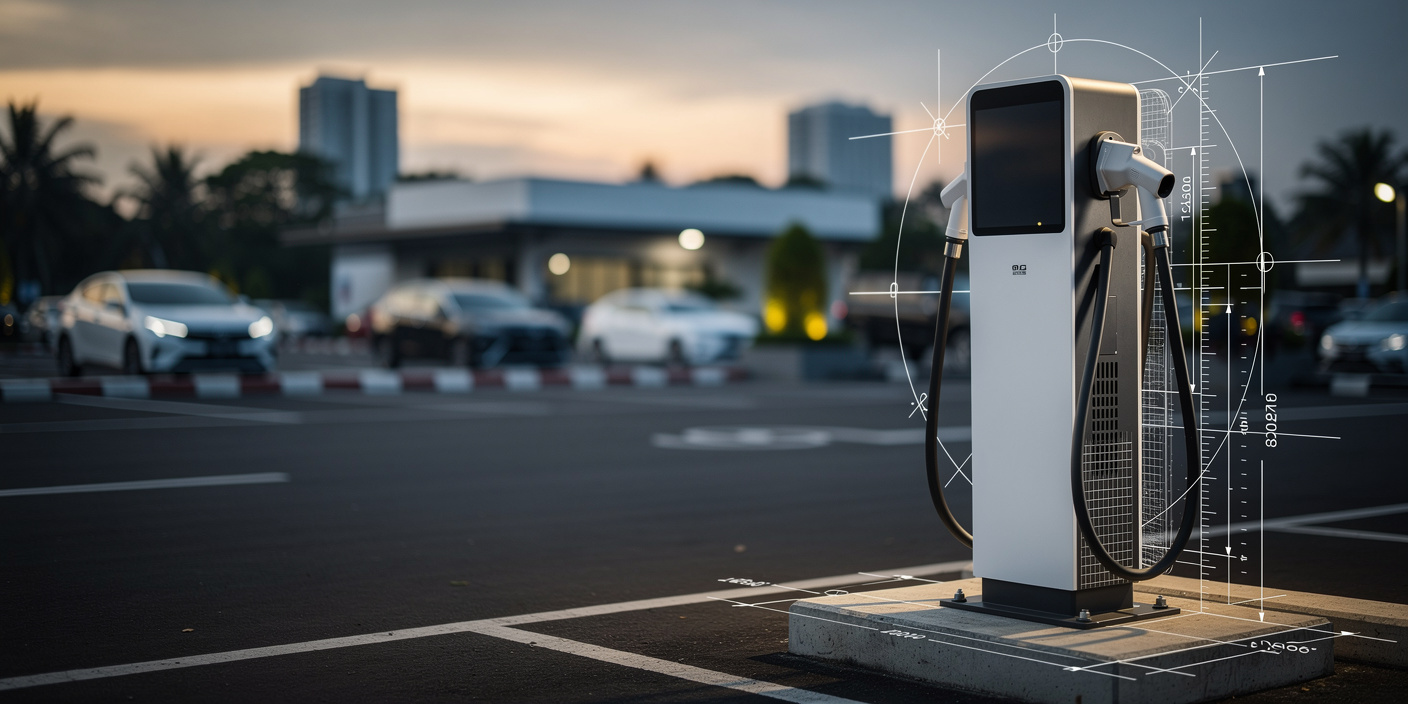
The Indonesia Electric Vehicle Charging Equipment Market operates through utility-led public deployment, automotive-bundled home chargers, commercial destination sites, and fleet depots. Battery electric vehicle wholesales reached 82,525 units during January-November 2025, creating a larger installed base that requires dedicated AC wallboxes and higher-throughput public charging. Equipment vendors therefore compete on charger uptime, connector compatibility, installation speed, and integration with payment and load-management platforms.
Java remains the operational center because vehicle ownership, toll-road traffic, property development, and utility infrastructure are concentrated around Greater Jakarta and major provincial cities. At December 2024, Java hosted 2,211 of PLN's 3,233 mapped public chargers, equal to 68.4% of the network. This density improves service economics, but it also intensifies price competition for metropolitan sites while leaving expansion whitespace outside Java.
Market Value
USD 64.8 million
2025
Dominant Region
Greater Jakarta
2025
Dominant Segment
Networked Smart Chargers
fastest growing, 2026-2031
Total Number of Players
42
Future Outlook
The Indonesia Electric Vehicle Charging Equipment Market is projected to increase from USD 64.8 million in 2025 to USD 396.2 million in 2031. Historical growth averaged 50.5% during 2020-2025 as the market moved from pilot installations toward broader public, residential, and commercial deployment. Forecast growth moderates to a still-high 35.2% CAGR during 2026-2031 because the addressable base is larger, procurement cycles lengthen, and utilization economics become more important. Public charging additions, home-charger attachment to new BEV sales, and fleet electrification remain the principal volume drivers, while higher-power DC equipment raises average project value.
Forecast performance depends on execution of the national public-charging roadmap, interoperability enforcement, and the pace of domestic EV production. DC fast and ultra-fast systems are expected to increase from 42% of equipment revenue in 2025 to 58% by 2031 as toll roads, fleets, and multi-vehicle sites demand shorter dwell times. At the same time, smart chargers with dynamic load management will expand in apartments and commercial buildings where grid capacity is constrained. Investors should prioritize suppliers with certified hardware, local maintenance coverage, utility-platform integration, and financing partnerships, because installation reliability and service response will determine repeat procurement more than nominal charger price.
35.2%
Forecast CAGR
$396.2 Mn
2030 Projection
Base Year
2025
Historical Period
2020-2025
Forecast Period
2026-2031
Historical CAGR
50.5%
CHAPTER 2 - SCOPE OF REPORT
Scope of the Market
CHAPTER 3 - Key Stakeholders
Key Target Audience
Key stakeholders who can leverage from this market analysis for investment, strategy, and operational planning.
Investors
CAGR, charger mix, recurring revenue, capex, utilization, risk
Corporates
fleet electrification, depot load, uptime, procurement, service coverage
Government
coverage ratios, standards, localization, grid readiness, equitable access
Operators
site throughput, kWh sales, maintenance, roaming, customer acquisition
Financial institutions
project finance, utilization covenants, equipment residual value, demand stability
CHAPTER 4 - Market Size & Growth
Market Size, Growth Forecast and Trends
This section evaluates the historical market size, analyzes year-over-year growth dynamics, and presents forecast projections supported by market performance indicators and demand-side drivers.
Historical & Projected Market Size ($ Million)
Year-over-Year Growth Rate (%)
Market Value vs Volume Growth (%)
Historical Market Performance (2020-2025)
Historical growth peaked at 68.8% in 2023 as vehicle launches, public procurement, and destination-charging projects moved beyond demonstration scale. The trough was still a strong 37.6% in 2025, reflecting a higher comparison base rather than weaker structural demand. Estimated equipment shipments increased from 8,100 units in 2020 to 56,900 units in 2025, while DC fast equipment captured 42% of 2025 revenue. The main inflection occurred between 2022 and 2024, when public charger stock expanded from roughly 570 units to more than 3,200 units and commercial property buyers began adopting networked charging.
Forecast Market Outlook (2026-2031)
Forecast revenue is expected to expand at a 35.2% CAGR to USD 396.2 million by 2031. Growth accelerates above 37% in 2028-2029 as public charger deployment shifts from linear expansion to the official exponential phase and fleet depots require higher-capacity equipment. The revenue mix also becomes more valuable: DC fast and ultra-fast systems are projected to reach 58% of market revenue by 2031, while annual equipment shipments rise to an estimated 285,000 units. Higher average power ratings, liquid-cooled systems, and energy-management software should keep value growth above unit growth through most of the forecast.
CHAPTER 5 - Market Data
Market Breakdown
The market is transitioning from home-charger-led unit demand toward a more balanced revenue pool that includes high-power public corridors, commercial properties, and fleet depots. For CEOs and investors, the critical issue is not only installation growth, but the share of projects requiring certified DC hardware, remote monitoring, and long-term service support.
Year | Market Size (USD Mn) | YoY Growth (%) | Public Charging Points (Units) | Home Charging Installations (Units) | DC Fast Revenue Mix (%) | Period |
|---|---|---|---|---|---|---|
| 2020 | $8.4 Mn | +- | 57 | 1,200 | Forecast | |
| 2021 | $11.9 Mn | +41.7% | 219 | 3,800 | Forecast | |
| 2022 | $18.6 Mn | +56.3% | 570 | 8,500 | Forecast | |
| 2023 | $31.4 Mn | +68.8% | 932 | 18,500 | Forecast | |
| 2024 | $47.1 Mn | +50.0% | 3,202 | 34,000 | Forecast | |
| 2025 | $64.8 Mn | +37.6% | 4,400 | 57,000 | Forecast | |
| 2026 | $85.3 Mn | +31.6% | 9,633 | 84,000 | Forecast | |
| 2027 | $112.6 Mn | +32.0% | 14,339 | 120,000 | Forecast | |
| 2028 | $154.7 Mn | +37.4% | 26,251 | 174,000 | Forecast | |
| 2029 | $213.9 Mn | +38.3% | 42,251 | 250,000 | Forecast | |
| 2030 | $291.8 Mn | +36.4% | 62,918 | 350,000 | Forecast | |
| 2031 | $396.2 Mn | +35.8% | 82,500 | 475,000 | Forecast |
Public Charging Points
4,400 units, October 2025, Indonesia. Deployment density is the clearest near-term trigger for DC equipment orders and maintenance contracts. The official roadmap requires 62,918 public chargers by 2030, implying a multi-year procurement pipeline.
Home Charging Installations
57,000 services, September 2025, Indonesia. Home chargers remain the largest volume pool and create repeat demand for electrical upgrades, smart metering, and apartment load management. Approximately 80% of EV users historically preferred home charging.
DC Fast Revenue Mix
42%, 2025, Indonesia market estimate. Revenue is moving faster than unit volume because high-power systems command materially higher equipment values. PLN's December 2024 network included 637 fast and ultra-fast chargers, providing a verified base for further mix expansion.
CHAPTER 6 - Segmentation
Market Segmentation Framework
Comprehensive analysis across key dimensions providing insights into market structure, consumer preferences, and distribution patterns.
No of Segments
7
Dominant Segment
Charger Type
Fastest Growing Segment
Technology
Charger Type
Power Rating
Application
Customer Type
Technology
Sales Channel
Geography
Key Segmentation Takeaways
Comprehensive analysis across all extracted segmentation dimensions providing insights into market structure, consumer preferences, and distribution patterns.
Charger Type
Charger type is the dominant commercial axis because hardware value, installation complexity, utilization requirements, and service obligations differ sharply between AC wallboxes and high-power DC systems. AC chargers lead unit volume through residential and destination use, while DC fast chargers lead revenue. Procurement teams increasingly evaluate modularity and multi-output capability to preserve site economics as vehicle battery capacity rises.
Technology
Technology is the fastest-growing axis because connected operation is becoming a prerequisite for utility integration, payment processing, uptime monitoring, and power allocation. Networked smart chargers are the fastest-growing sub-segment, followed by load-balanced systems for apartments and commercial properties. Bidirectional equipment remains small, but pilot activity will increase as standards, vehicle compatibility, and grid-service compensation frameworks mature.
CHAPTER 7 - Regional Analysis
Regional Analysis
Indonesia ranks third among selected Southeast Asian peer markets by 2025 EV charging equipment revenue, behind Thailand and Singapore but ahead of Malaysia and the Philippines. Its comparatively lower installed public network is offset by faster BEV sales expansion, a national charger roadmap, and strong home-charging demand, giving Indonesia the highest projected equipment CAGR in the peer set.
Peer-Country Ranking
3rd
Indonesia Market Size (2025)
USD 64.8 Mn
Indonesia CAGR (2026-2031)
35.2%
Peer-Country Ranking
3rd
Indonesia Market Size (2025)
USD 64.8 Mn
Indonesia CAGR (2026-2031)
35.2%
Regional Analysis (Current Year)
Market Position
Indonesia is the third-largest selected peer market at USD 64.8 million in 2025, with equipment demand supported by roughly 92,000 full-year BEV wholesales and 4,400 public chargers by October.
Growth Advantage
Indonesia's 35.2% forecast CAGR exceeds Malaysia's 28.6% and Thailand's 24.8%, reflecting a lower infrastructure base, faster vehicle adoption, and an official 62,918-public-charger objective for 2030.
Competitive Strengths
Indonesia combines 57,000 home-charging services, a 30% overnight tariff discount, and a 10,400 MW national power reserve, improving residential economics and supporting scale-up of public and fleet charging equipment.
CHAPTER 8 - INDUSTRY ANALYSIS
Growth Drivers, Market Challenges & Market Opportunities
Comprehensive analysis of key factors shaping the Indonesia Electric Vehicle Charging Equipment Market, including growth catalysts, operational challenges, and emerging opportunities across production, distribution, and consumer segments.
Growth Drivers
Rapid Expansion of the Addressable EV Fleet
- BEV wholesales exceeded the full-year 2024 total of 43,188 units (2024, Indonesia) by September 2025, increasing the pool of customers requiring residential installations and creating faster replacement demand for dealer-supplied wallboxes.
- The operating EV population reached 252,000 units (July 2025, Indonesia), including 67,000 passenger cars and 184,000 motorcycles, widening procurement beyond private cars toward two-wheeler hubs, fleets, and mixed-use charging sites.
- Chinese brands contributed most 2025 BEV volume, with BYD reaching 40,151 units (January-November 2025, Indonesia); broader model availability reduces single-OEM risk and supports multi-standard, high-availability charger demand.
National Public-Charging Build-Out
- Public chargers increased to 4,400 units across 2,900 locations (October 2025, Indonesia), showing that procurement is moving from isolated sites toward repeatable network deployment and standardized maintenance requirements.
- The roadmap projects an EV-to-public-charger ratio of 15:1 (2028-2030, Indonesia), which materially increases equipment orders relative to vehicle stock and favors vendors able to supply modular platforms at scale.
- Geographic balancing rules require one non-dense-area charger for every 5 Jabodetabek chargers or 12 chargers elsewhere (2025 roadmap, Indonesia), expanding addressable demand beyond premium urban sites and creating opportunities for lower-cost, remotely managed equipment.
Utility Incentives and Home-Charging Economics
- A 30% overnight electricity discount (22:00-05:00, Indonesia) improves home-charging payback and encourages smart scheduling functionality, allowing equipment vendors to monetize connectivity and time-of-use optimization.
- Connection-fee incentives reduce household upgrade costs to as little as USD 9 equivalent for selected capacity additions (2021 policy, Indonesia), removing an important installation barrier for bundled charger sales.
- SPKLU businesses receive minimum-billing relief for 2 years (2023 regulation, Indonesia), improving early-stage site economics and supporting demand for higher-quality equipment despite initially low utilization.
Market Challenges
Utilization and Payback Pressure
- Top PLN sites recorded 17-26 transactions per day (2024, selected Indonesia sites), while many secondary locations operate below these levels; equipment buyers therefore face long payback periods unless hardware cost, power demand, and ancillary revenue are tightly managed.
- Approximately 80% of users preferred home charging (2021, Indonesia), limiting public-site throughput and forcing operators to compete for corridor, apartment, fleet, and high-dwell-time locations rather than assuming broad retail utilization.
- Public hardware must support both low current utilization and future growth, creating a capital-allocation problem between inexpensive medium chargers and higher-cost DC systems that may remain underused during the first 24 months (typical ramp period, Indonesia estimate).
Grid Connection and Site-Readiness Constraints
- Public networks include 256 ultra-fast and 381 fast chargers (December 2024, PLN network); further mix expansion will require more medium-voltage connections and may lengthen project commissioning where local distribution assets are constrained.
- Apartment and commercial installations must share limited building capacity, making dynamic load management essential; without it, property owners may incur costly upgrades that can exceed the charger's own hardware value on multi-point sites. 57,000 home services (September 2025, Indonesia) indicate the scale of this emerging constraint.
- Safety guidance recommends open-area placement rather than basements for public charging, potentially reducing usable sites in dense cities where structured parking dominates. The rule affects project design for 2,900 public locations (October 2025, Indonesia).
Standards, Localization, and Supply-Chain Dependence
- Indonesia's charging fleet spans standard, medium, fast, and ultra-fast technologies, with four power classes (2024, PLN network); vendors must manage multiple product certifications, spare parts, and field-service competencies.
- Domestic industrial strategy includes charger components, but high-power modules, semiconductors, connectors, and control systems remain import-sensitive. More than 60% of 2025 transport-sector investment was concentrated in the EV ecosystem, raising pressure to localize supporting components.
- Connector and software interoperability failures can strand assets across a network of 4,400 public chargers (October 2025, Indonesia); equipment providers therefore need OCPP compatibility, remote firmware control, and multi-brand vehicle testing before scale deployment.
Market Opportunities
High-Power Corridor and Fleet Charging
- vendors can combine modular DC cabinets, dispensers, maintenance, and software subscriptions, raising lifetime revenue per site as power scales from 60 kW to above 200 kW (2025 product range, Indonesia).
- toll-road operators, taxi fleets, bus depots, and logistics companies gain higher vehicle utilization, while equipment suppliers capture service contracts across a roadmap of 62,918 public chargers (2030, Indonesia).
- standardized fleet duty-cycle data and stronger site power planning are required because corridor charging demand can surge seasonally, as EV holiday travel rose to 13,183 vehicles (2024/2025 year-end period, Indonesia).
Smart Charging for Apartments and Commercial Buildings
- suppliers can sell hardware with recurring software fees for access control, billing, and dynamic load management, improving margin beyond one-time wallbox sales across 22 kW commercial AC systems (2025, Indonesia).
- property developers and facility managers avoid oversized electrical upgrades, while residents receive allocated billing and reserved access; the addressable network includes 2,180 public-charging locations plus private properties (December 2024, Indonesia).
- building codes, strata approvals, and installer certification should standardize multi-user deployments, particularly in Greater Jakarta where DKI Jakarta had 790 public chargers (December 2024, Indonesia) and dense residential parking limits dedicated connections.
Localized Assembly and Power-Electronics Integration
- local enclosure, cable, metering, switchgear, and final-assembly content can lower logistics costs and improve tender competitiveness, particularly for the planned increase from 4,400 to 62,918 public chargers by 2030.
- global charger OEMs gain local-market access, Indonesian electrical manufacturers gain higher-value product lines, and utilities gain shorter lead times for replacement units across 38 provinces (2025, Indonesia).
- certification labs, component standards, and supplier-development programs must scale so localized products match uptime and safety expectations; the market already supports four charging power classes (2024, PLN network).
CHAPTER 9 - Competitive Landscape
Competitive Landscape Overview
The market is moderately concentrated around utility procurement, global power-electronics brands, and a growing group of local charging integrators. Entry barriers center on certification, utility-platform integration, site commissioning capability, and nationwide maintenance coverage rather than basic hardware availability.
Market Share Distribution
Top 5 Players
Market Dynamics
8 new entrants in the past 5 years, indicating strong market attractiveness and growth potential.
Company Name | Market Share | Headquarters | Founding Year | Core Market Focus |
|---|---|---|---|---|
PT PLN Icon Plus | - | Jakarta, Indonesia | 2000 | Utility-integrated charging platforms, deployment, and network services |
Delta Electronics, Inc. | - | Taipei, Taiwan | 1971 | AC and DC chargers, power modules, and engineering services |
ABB E-mobility | - | Zurich, Switzerland | 1988 | Residential wallboxes, DC fast chargers, and charging software |
Schneider Electric | - | Rueil-Malmaison, France | 1836 | Building-integrated AC charging, DC charging, and energy management |
Siemens AG | - | Munich and Berlin, Germany | 1847 | High-power charging, depot systems, and grid integration |
Terra Charge Indonesia | - | Jakarta, Indonesia | 2024 | Public charging equipment deployment and end-to-end site operation |
PT Utomo Chargeplus Indonesia | - | - | - | Commercial charging systems, installation, and network operation |
PT Exelly Elektrik Indonesia | - | - | - | EV charger supply, system integration, and SPKLU partnerships |
PT Arista Elektrika Nusantara | - | - | - | Charging equipment integration and utility-partner deployment |
PT High Volt Technology | - | - | - | Electrical infrastructure and EV charging-system implementation |
Cross Comparison Parameters
The report provides detailed cross-comparison of key players across 10 performance parameters to identify competitive strengths and weaknesses.
Installed Charger Base
Average Charger Uptime
Indonesia Charging Revenue Growth
Service Gross Margin
Analysis Covered
Market Share Analysis:
Estimates supplier positions across public, residential, commercial, and fleet deployments
Cross Comparison Matrix:
Benchmarks hardware scale, uptime, growth, and service economics consistently
SWOT Analysis:
Assesses technology, partnerships, localization, service reach, and execution vulnerabilities
Pricing Strategy Analysis:
Compares hardware pricing, software fees, warranties, and maintenance structures
Company Profiles:
Reviews ownership, market focus, capabilities, partnerships, and deployment positioning
CHAPTER 10 - REPORT TOC
Market Report Structure
Comprehensive coverage across three strategic phases — Market Assessment, Go-To-Market Strategy, and Survey — delivering end-to-end insights from market analysis and execution roadmap to customer demand validation.
Market Assessment Phase
Supply-side and competitive intelligence covering market sizing, segmentation, competitive dynamics, regulatory landscape, and future forecasts.
Go-To-Market Strategy Phase
15 chapters
Entry strategy evaluation, execution roadmap, partner recommendations, and profitability outlook.
Survey Phase
8 chapters
Demand-side primary research conducted through structured interviews and online surveys with end users across priority metros and Tier 2/3 cities to capture consumption behavior, unmet needs, and purchase drivers.
Complete Report Coverage
201+ detailed sections covering every aspect of the market
143
Assessment Sections
58
Strategy Sections
CHAPTER 11 - Our Approach
Research Methodology
Desk Research
- Mapped national SPKLU deployment records
- Reviewed charger standards and tariffs
- Tracked BEV registrations and wholesales
- Benchmarked equipment prices and power
Primary Research
- Interviewed EV infrastructure strategy directors
- Engaged charger product management heads
- Consulted fleet electrification program managers
- Interviewed electrical EPC project directors
Validation and Triangulation
- Validated assumptions through 286 interviews
- Reconciled public and private installations
- Cross-checked shipment and revenue models
- Tested charger mix sensitivity ranges
CHAPTER 12 - FAQ
FAQs
Still have questions?
Our research team is here to help you find the right solution
CHAPTER 13 - Related Research
Explore Related Reports
Expand your market intelligence with complementary research across regions and adjacent markets.
Regional/Country ReportsRelated market analysis across key regions
Related market analysis across key regions
- Indonesia Electric Vehicle Charging Equipment Market Outlook to 2026
- Vietnam Electric Vehicle Charging Equipment Market Outlook to 2026
- Thailand Electric Vehicle Charging Equipment Market Outlook to 2026
- Malaysia Electric Vehicle Charging Equipment Market Outlook to 2026
- Philippines Electric Vehicle Charging Equipment Market Outlook to 2026
Adjacent ReportsRelated markets and complementary research
Related markets and complementary research
- Vietnam Electric Vehicle Battery Manufacturing Market
- Egypt Smart Grid Infrastructure Market
- South Africa Renewable Energy Charging Station Market
- Singapore Electric Vehicle Fleet Management Market
- Malaysia Home Energy Management Systems Market
500+
Market Research Reports
50+
Countries Covered
15+
Industry Verticals