
Asia Pacific Digital Waste Market Outlook to 2030
Region:Asia
Author(s):Sanjna
Product Code:KROD10022
December 2024
95
About the Report
Asia Pacific Digital Waste Market Overview
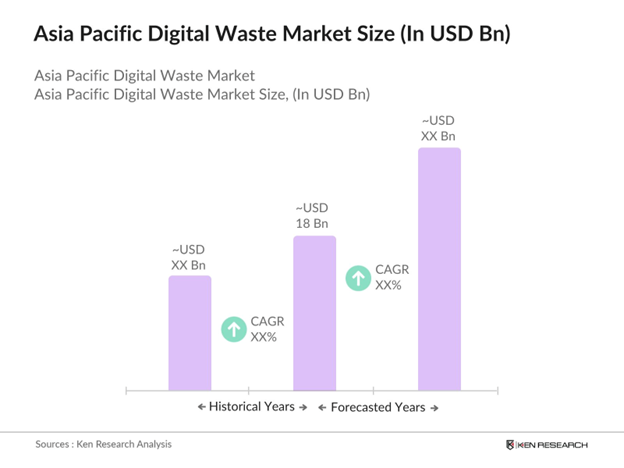
- The Asia Pacific Digital Waste Market is valued at USD 18 billion, driven by regulatory mandates for responsible waste management and increasing digital consumption. The rapid expansion of electronic device usage across both urban and rural areas has created a robust demand for sustainable waste disposal solutions, pushing industry growth further. Digital waste generation is also fueled by the continuous release of newer digital products, prompting frequent device replacements.
- The region is dominated by countries like China, Japan, and South Korea. Chinas massive electronics manufacturing sector contributes significantly to the digital waste generated, while Japan and South Korea lead in waste processing technologies. Additionally, Indias rapid digitalization and rising consumption of electronic devices make it a growing market in the region, with government initiatives supporting e-waste recycling and responsible disposal practices.
- Asia Pacific governments are setting stringent standards for e-waste collection and treatment. South Korea mandates specific protocols for hazardous components, requiring all processors to comply with safety and environmental standards, a move expected to regulate the processing of over 200,000 tons of e-waste annually. Japan has also introduced a certification process for e-waste facilities, ensuring adherence to national environmental guidelines.
Asia Pacific Digital Waste Market Segmentation
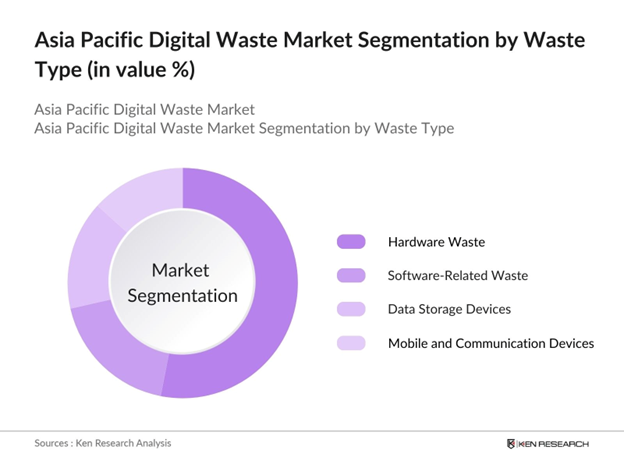
By Waste Type: The Asia Pacific Digital Waste Market is segmented by waste type, which includes Hardware Waste, Software-Related Waste, Data Storage Devices, and Mobile and Communication Devices. Among these, Hardware Waste holds a dominant market share due to the substantial volume of discarded electronics like computers, tablets, and smartphones. This dominance is attributed to frequent upgrades in consumer electronics and the fast-paced innovation cycle that drives regular replacements.
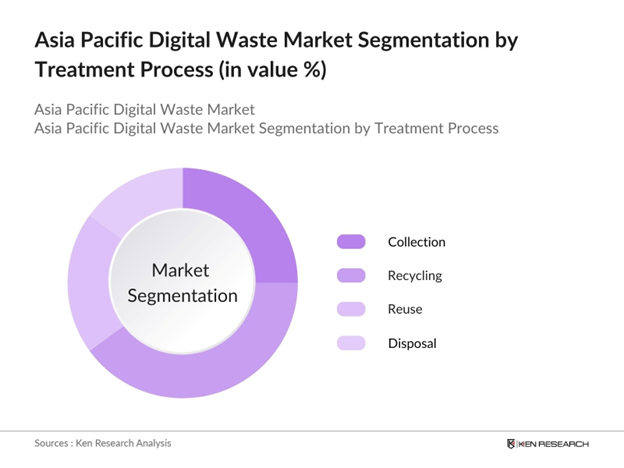
By Treatment Process: The market is also segmented by Treatment Process into Collection, Recycling, Reuse, and Disposal. Recycling has emerged as the leading segment due to growing awareness around resource recovery from e-waste, coupled with regulatory mandates that enforce recycling standards. Advanced recycling technology is also being adopted, particularly in countries like Japan and South Korea, where recycling facilities are more advanced.
Asia Pacific Digital Waste Market Competitive Landscape
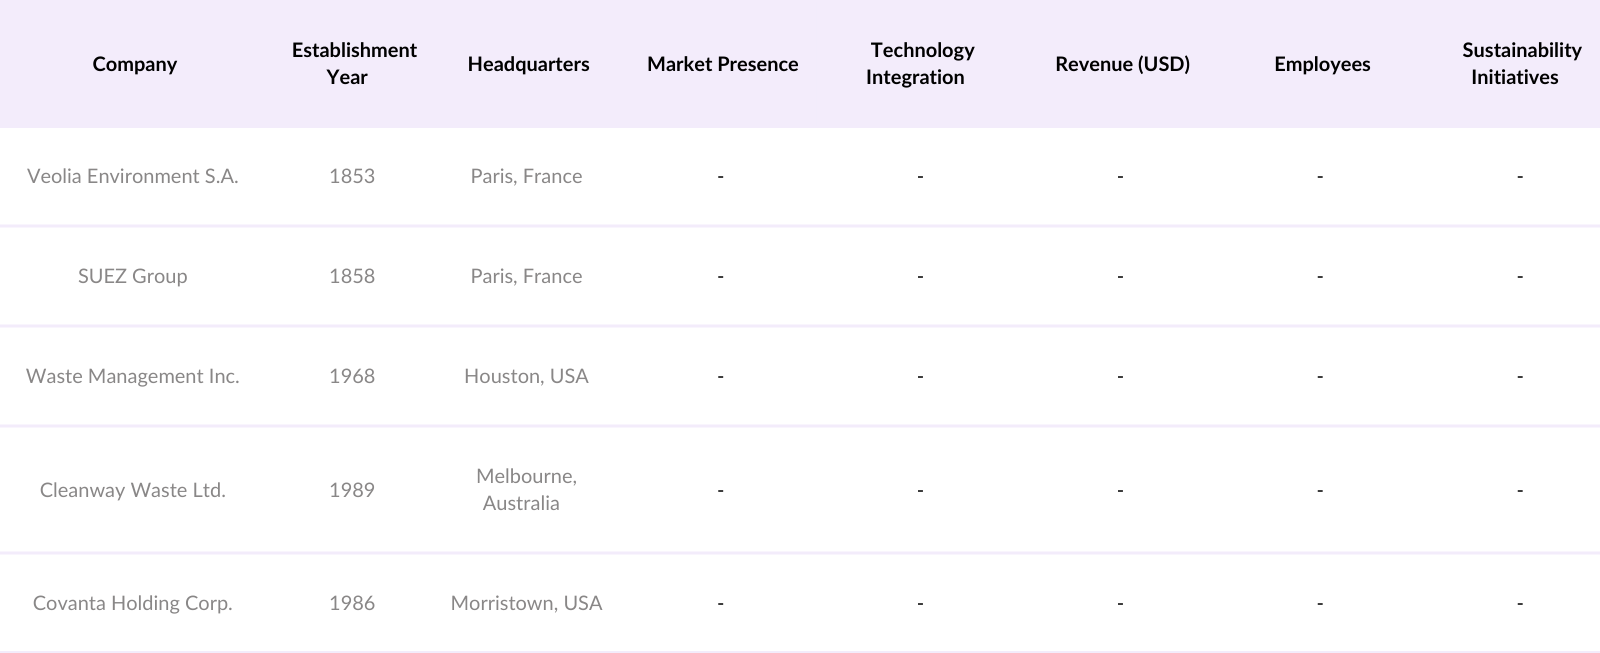
The Asia Pacific Digital Waste Market is primarily consolidated, with leading players operating extensive recycling networks across the region. Major players like Veolia and SUEZ dominate with large market presences, driven by advanced waste management technology and comprehensive sustainability initiatives.
Asia Pacific Digital Waste Market Analysis
Growth Drivers
- Government Regulations and Mandates: Asia Pacific governments are intensifying regulations on e-waste disposal and recycling, focusing on strict compliance protocols to minimize digital waste impacts. For instance, Japan has enforced the Home Appliance Recycling Law, mandating recycling for electronic products and encouraging resource recovery. This regulatory drive is also visible in South Korea, where the Ministry of Environment has set a target to recycle 60,000 metric tons of e-waste annually.
- Expansion of Digital Device Usage: The rapid growth in digital device usage across Asia Pacific is driving digital waste generation. As of 2024, China alone has over 1.6 billion active devices, largely contributing to e-waste. Similarly, smartphone penetration in Southeast Asia has exceeded 90% in major economies, further adding to waste volumes. With the International Telecommunication Union (ITU) estimating that the average device lifecycle is less than three years, the need for effective e-waste management systems is increasingly critical in this region.
- Advancements in Digital Waste Processing Technology: Technological advancements are facilitating better digital waste management in Asia Pacific. The Chinese government has supported initiatives to improve waste sorting through AI and machine learning, with more than 5,000 waste sorting facilities integrating these technologies by 2024. Additionally, South Korea is investing in robotic sorting systems, with an estimated 200 facilities now employing robotics to optimize recycling processes, which enhances efficiency and minimizes human error in e-waste processing.
Challenges
- Limited Waste Collection Infrastructure: Asia Pacific faces a significant shortage of infrastructure for effective e-waste collection, particularly in rural areas. Reports indicate that nearly 70% of e-waste generated in the region remains uncollected, especially in countries like Indonesia and the Philippines. Urban centers have started implementing organized waste collection systems, yet rural regions often lack access to these facilities. Japan and South Korea have led the way in expanding collection points, but there is still an infrastructure gap that limits regional waste management effectiveness.
- Lack of Standardized Disposal Protocols: A lack of standardized protocols across Asia Pacific complicates digital waste disposal, with inconsistencies between countries on accepted practices. For example, while Japan has set specific protocols for battery and device recycling, nations like Vietnam and Malaysia lack comprehensive guidelines, leading to unregulated disposal practices. This disparity is partly responsible for the annual 5 million metric tons of digital waste improperly processed or dumped in the region. Harmonized policies across Asia Pacific would ensure better compliance and safety in digital waste disposal.
Asia Pacific Digital Waste Market Future Outlook
Over the next five years, the Asia Pacific Digital Waste Market is expected to grow significantly, driven by stringent government regulations, technological advancements in recycling, and increased corporate responsibility toward e-waste. Additionally, expanding digital device usage and regional initiatives aimed at resource conservation will continue to promote recycling and sustainable waste management practices across the region.
Market Opportunities
- Advancements in Recycling and Resource Recovery: Innovations in recycling technology present significant growth opportunities in Asia Pacifics digital waste market. Countries like Japan and China are investing in advanced resource recovery systems capable of extracting rare earth metals from electronic devices, valued at approximately $8 billion annually. This recovery potential has prompted public and private investments in high-precision recovery technologies that increase the value extracted from electronic waste, contributing to economic and environmental sustainability.
- Expanding Circular Economy Initiatives: The rise of circular economy initiatives in Asia Pacific has spurred efforts to reduce, reuse, and recycle electronic waste. Chinas circular economy action plan aims to recover 85% of recyclable materials from digital waste by 2025, which could save nearly 200,000 tons of natural resources annually. Similarly, Japan and South Korea have incentivized companies to produce devices with longer life cycles and recyclable components, further encouraging the development of a circular economy in digital waste management.
Scope of the Report
Scope Table
|
Segment |
Sub-Segments |
|
By Waste Type |
Hardware Waste Software-Related Waste Data Storage Devices Mobile and Communication Devices |
|
By Source |
Residential Commercial Industrial Government and Public Sector |
|
By Treatment Process |
Collection Recycling Reuse Disposal |
|
By Material Recovery |
Metals (Ferrous, Non-Ferrous) Plastics Glass Precious Metals (Gold, Silver) Hazardous Materials |
|
By Region |
East Asia Southeast Asia South Asia Oceania |
Products
Key Target Audience
Electronic Device Manufacturers
E-Waste Recycling Companies
Environmental Organizations
Technology Solution Providers
Retail Chains and Distributors of Digital Devices
Urban Development Authorities
Investors and Venture Capitalist Firms
Government and Regulatory Bodies (Ministry of Environment, Pollution Control Boards)
Companies
Players Mentioned in the Report
Veolia Environment S.A.
SUEZ Group
Waste Management Inc.
Cleanway Waste Ltd.
Covanta Holding Corp.
TES-AMM
SIMS Recycling Solutions
Enviroserve
Ecoreco
Umicore
Table of Contents
1. Asia Pacific Digital Waste Market Overview
1.1 Definition and Scope
1.2 Market Taxonomy
1.3 Market Growth Rate
1.4 Market Segmentation Overview
2. Asia Pacific Digital Waste Market Size (In USD Mn)
2.1 Historical Market Size
2.2 Year-On-Year Growth Analysis
2.3 Key Market Developments and Milestones
3. Asia Pacific Digital Waste Market Analysis
3.1 Growth Drivers (Regulatory Push, Urbanization, E-Waste Awareness Programs)
3.1.1 Government Regulations and Mandates
3.1.2 Expansion of Digital Device Usage
3.1.3 Advancements in Digital Waste Processing Technology
3.1.4 Corporate Sustainability Initiatives
3.2 Market Challenges (Waste Management Infrastructure, Awareness, Technical Complexity)
3.2.1 Limited Waste Collection Infrastructure
3.2.2 Lack of Standardized Disposal Protocols
3.2.3 Insufficient Technological Expertise in E-Waste Processing
3.2.4 High Cost of Recycling Processes
3.3 Opportunities (Recycling Technology Innovations, Public-Private Partnerships)
3.3.1 Advancements in Recycling and Resource Recovery
3.3.2 Expanding Circular Economy Initiatives
3.3.3 Investments in Waste-to-Energy Solutions
3.3.4 Collaboration with Tech Companies for Sustainable Solutions
3.4 Trends (IoT Integration, Blockchain for Traceability, AI in Waste Sorting)
3.4.1 Adoption of IoT for E-Waste Monitoring
3.4.2 Blockchain-Driven Traceability in Waste Management
3.4.3 Automation and AI-Powered Sorting Mechanisms
3.4.4 Growth in Cloud-Based Waste Management Solutions
3.5 Government Regulation (Standards, Compliance Protocols, National E-Waste Policies)
3.5.1 E-Waste Collection and Treatment Standards
3.5.2 Import and Export Restrictions for E-Waste
3.5.3 Certification and Compliance for E-Waste Processors
3.5.4 Public-Private Partnerships in Digital Waste Management
3.6 SWOT Analysis
3.7 Stakeholder Ecosystem
3.8 Porters Five Forces Analysis
3.9 Competition Ecosystem
4. Asia Pacific Digital Waste Market Segmentation
4.1 By Waste Type (In Value %)
4.1.1 Hardware Waste
4.1.2 Software-Related Waste
4.1.3 Data Storage Devices
4.1.4 Mobile and Communication Devices
4.2 By Source (In Value %)
4.2.1 Residential
4.2.2 Commercial
4.2.3 Industrial
4.2.4 Government and Public Sector
4.3 By Treatment Process (In Value %)
4.3.1 Collection
4.3.2 Recycling
4.3.3 Reuse
4.3.4 Disposal
4.4 By Material Recovery (In Value %)
4.4.1 Metals (Ferrous, Non-Ferrous)
4.4.2 Plastics
4.4.3 Glass
4.4.4 Precious Metals (Gold, Silver)
4.4.5 Hazardous Materials
4.5 By Region (In Value %)
4.5.1 East Asia
4.5.2 Southeast Asia
4.5.3 South Asia
4.5.4 Oceania
5. Asia Pacific Digital Waste Market Competitive Analysis
5.1 Detailed Profiles of Major Companies
5.1.1 TES-AMM
5.1.2 Enviroserve
5.1.3 SIMS Recycling Solutions
5.1.4 Ecoreco
5.1.5 Umicore
5.1.6 Global Electric Electronic Processing (GEEP)
5.1.7 ElemenTree Asia
5.1.8 URT Umwelt-und Recyclingtechnik GmbH
5.1.9 Stena Metall Group
5.1.10 Trishyiraya Recycling India
5.2 Cross Comparison Parameters (Revenue, Headquarters, Market Penetration, No. of Employees, Technological Expertise, Partnerships, Environmental Certifications, Service Range)
5.3 Market Share Analysis
5.4 Strategic Initiatives
5.5 Mergers and Acquisitions
5.6 Investment Analysis
5.7 Venture Capital Funding
5.8 Government Grants
5.9 Private Equity Investments
6. Asia Pacific Digital Waste Market Regulatory Framework
6.1 Environmental Standards and Compliance Requirements
6.2 Certification Processes for E-Waste Management
6.3 Import and Export Policies on Digital Waste
6.4 National and Regional E-Waste Regulations
7. Asia Pacific Digital Waste Future Market Size (In USD Mn)
7.1 Future Market Size Projections
7.2 Key Factors Driving Future Market Growth
8. Asia Pacific Digital Waste Future Market Segmentation
8.1 By Waste Type (In Value %)
8.2 By Source (In Value %)
8.3 By Treatment Process (In Value %)
8.4 By Material Recovery (In Value %)
8.5 By Region (In Value %)
9. Asia Pacific Digital Waste Market Analysts Recommendation
9.1 TAM/SAM/SOM Analysis
9.2 Customer Cohort Analysis
9.3 Marketing Initiatives
9.4 White Space Opportunity Analysis
Research Methodology
Step 1: Identification of Key Variables
In the initial phase, an ecosystem map encompassing all major stakeholders within the Asia Pacific Digital Waste Market was created. This map, supported by extensive desk research, aimed to identify key variables influencing market growth and trends.
Step 2: Market Analysis and Construction
Historical data on digital waste volumes, recycling rates, and regional regulations were analyzed to understand the market structure. Key metrics, such as the frequency of device replacements and regulatory compliance rates, were evaluated to construct a reliable market model.
Step 3: Hypothesis Validation and Expert Consultation
Hypotheses were validated through direct consultations with industry experts, including managers from waste processing facilities and policy analysts. These interviews provided firsthand insights into operational challenges, regulatory constraints, and the impact of technological advancements on waste treatment efficacy.
Step 4: Research Synthesis and Final Output
The final phase synthesized data from various sources, including digital device manufacturers, regulatory authorities, and recycling firms. The output was cross-verified with both industry statistics and expert insights to deliver a comprehensive, data-backed analysis of the Asia Pacific Digital Waste Market.
Frequently Asked Questions
01. How big is the Asia Pacific Digital Waste Market?
The Asia Pacific Digital Waste Market is valued at USD 18 billion, with robust growth driven by regulatory requirements and a rise in electronic waste due to frequent device upgrades.
02. What are the challenges in the Asia Pacific Digital Waste Market?
Challenges in Asia Pacific Digital Waste Market include limited waste collection infrastructure, high recycling costs, and a lack of standardized disposal protocols across countries in the region, which can hinder efficient waste management.
03. Who are the major players in the Asia Pacific Digital Waste Market?
Major players in Asia Pacific Digital Waste Market include Veolia Environment S.A., SUEZ Group, and Waste Management Inc., among others. These companies dominate due to their extensive recycling facilities, partnerships, and advanced waste treatment technologies.
04. What are the growth drivers of the Asia Pacific Digital Waste Market?
Key growth drivers in Asia Pacific Digital Waste Market include stringent government regulations, advancements in waste processing technology, and increased corporate responsibility initiatives aimed at reducing environmental impact.
Why Buy From Us?
 Framework")
What makes us stand out is that our consultants follows Robust, Refine and Result (RRR) methodology. i.e. Robust for clear definitions, approaches and sanity checking, Refine for differentiating respondents facts and opinions and Result for presenting data with story

We have set a benchmark in the industry by offering our clients with syndicated and customized market research reports featuring coverage of entire market as well as meticulous research and analyst insights.

While we don't replace traditional research, we flip the method upside down. Our dual approach of Top Bottom & Bottom Top ensures quality deliverable by not just verifying company fundamentals but also looking at the sector and macroeconomic factors.

With one step in the future, our research team constantly tries to show you the bigger picture. We help with some of the tough questions you may encounter along the way: How is the industry positioned? Best marketing channel? KPI's of competitors? By aligning every element, we help maximize success.

Our report gives you instant access to the answers and sources that other companies might choose to hide. We elaborate each steps of research methodology we have used and showcase you the sample size to earn your trust.

If you need any support, we are here! We pride ourselves on universe strength, data quality, and quick, friendly, and professional service.