
Asia Pacific Non-Lethal Weapons Market Outlook to 2030
Region:China
Author(s):Vijay Kumar
Product Code:KROD7222
Region:China
Author(s):Vijay Kumar
Product Code:KROD7222
November 2024
86
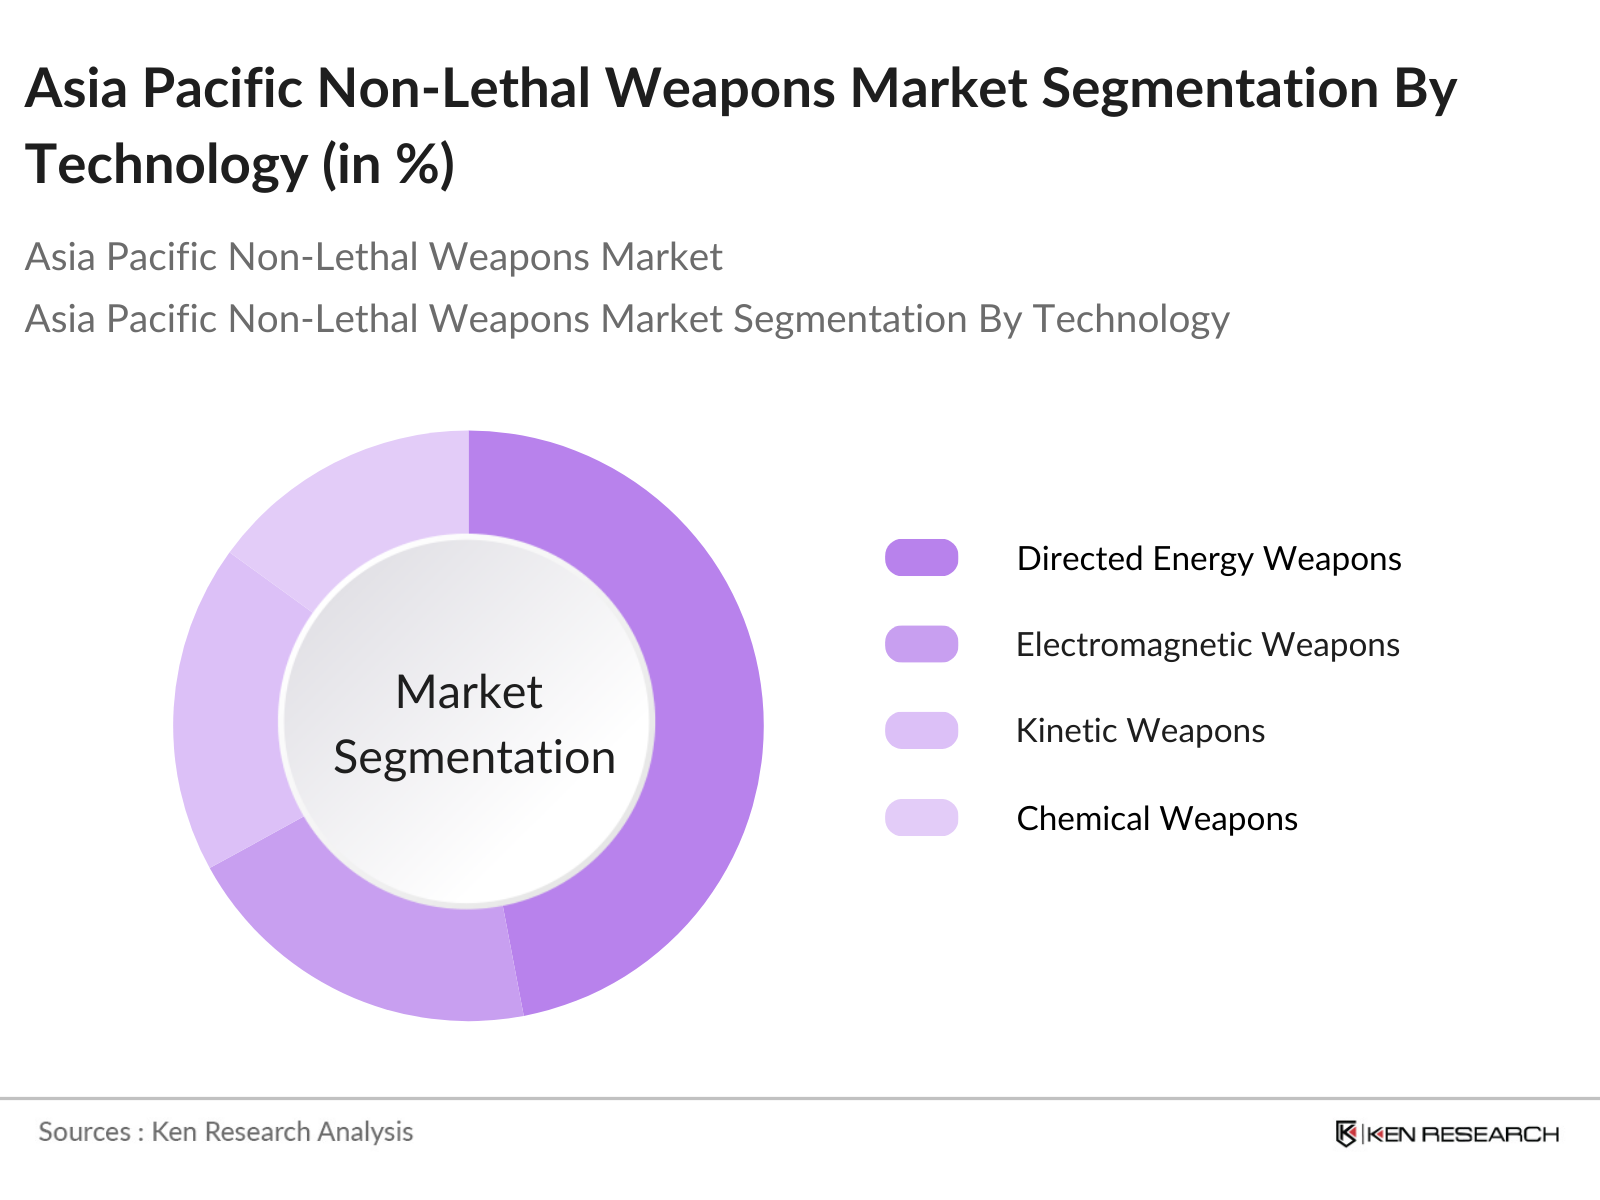
By Technology: The Asia Pacific Non-Lethal Weapons market is segmented by technology into directed energy weapons, electromagnetic weapons, kinetic weapons, chemical weapons, and acoustic weapons. Recently, directed energy weapons, such as microwave and laser systems, have gained dominance in the market due to their precision, reduced collateral damage, and growing adoption in defense applications.
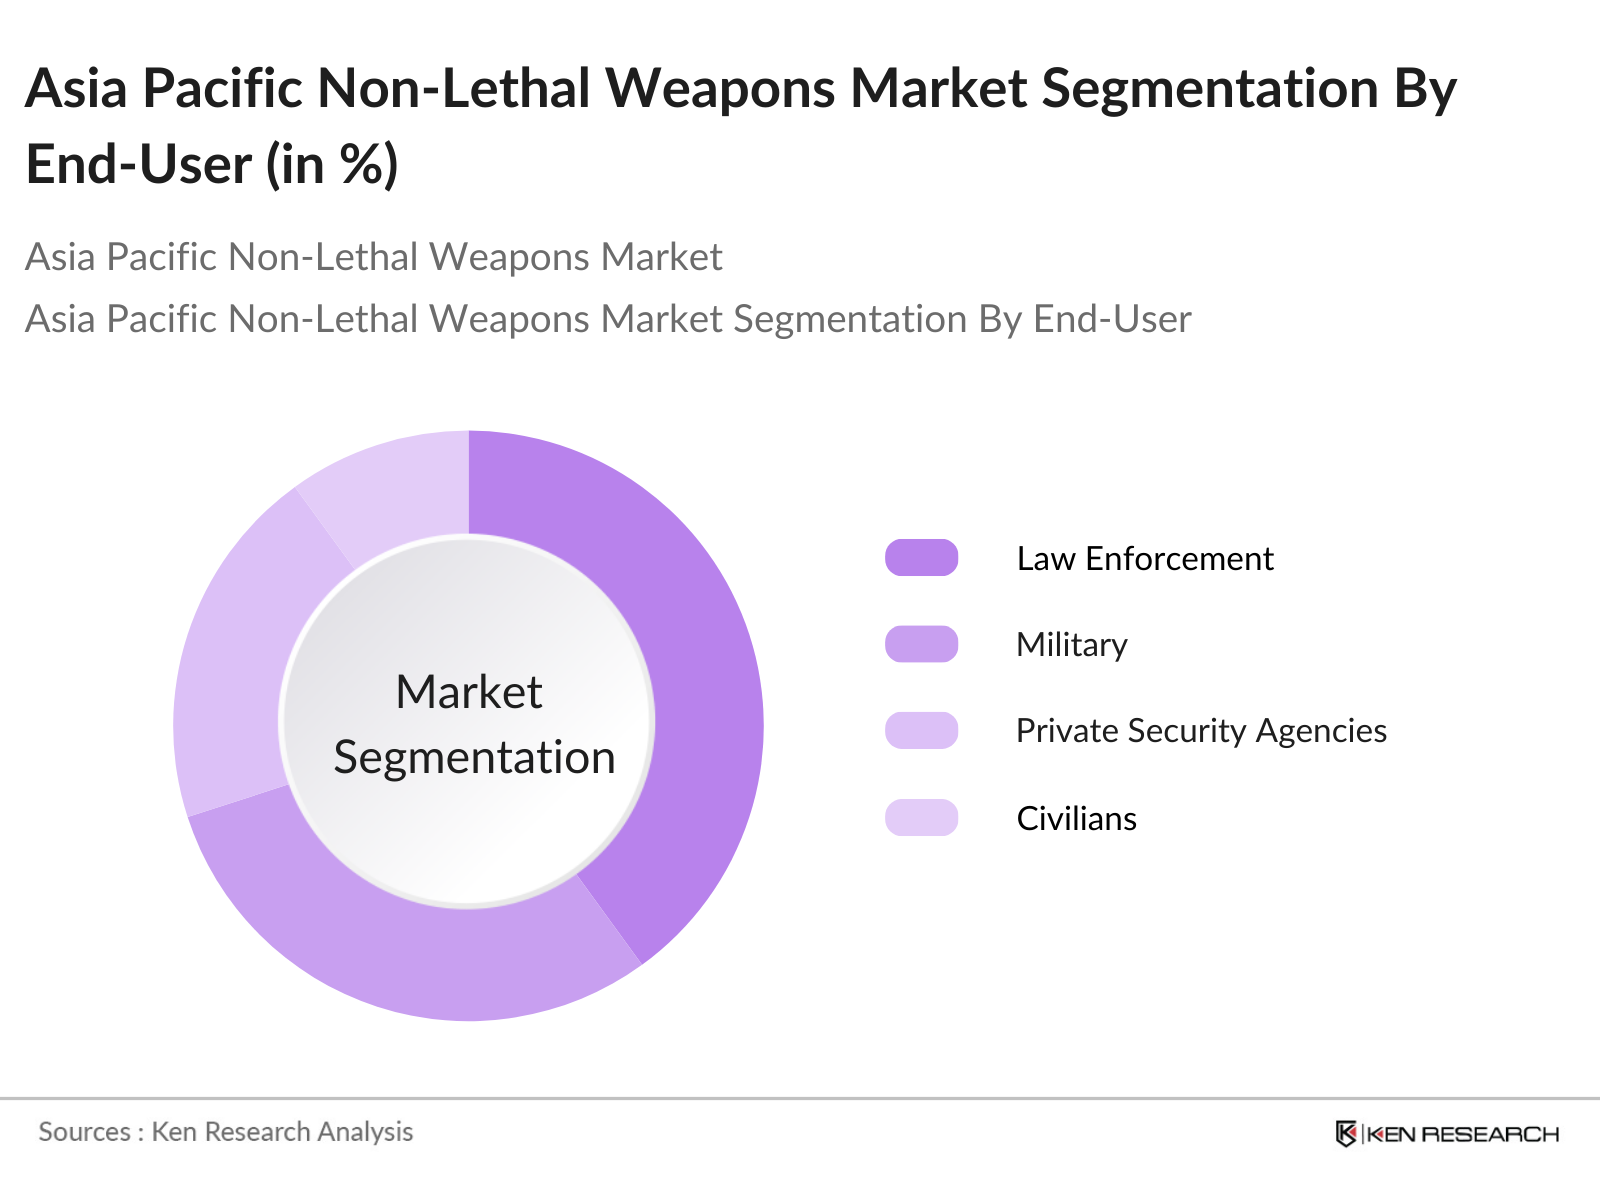
By End-User: The market is further segmented by end-users into law enforcement, military, civilians, and private security agencies. Law enforcement agencies hold the largest share in this segment, driven by the increasing need for riot control, crowd management, and non-lethal tools for daily policing. The demand for non-lethal weapons in law enforcement is significantly influenced by urban unrest and protest movements, leading to higher procurement rates in countries like India, Hong Kong, and Thailand, where law enforcement agencies require robust crowd control tools.
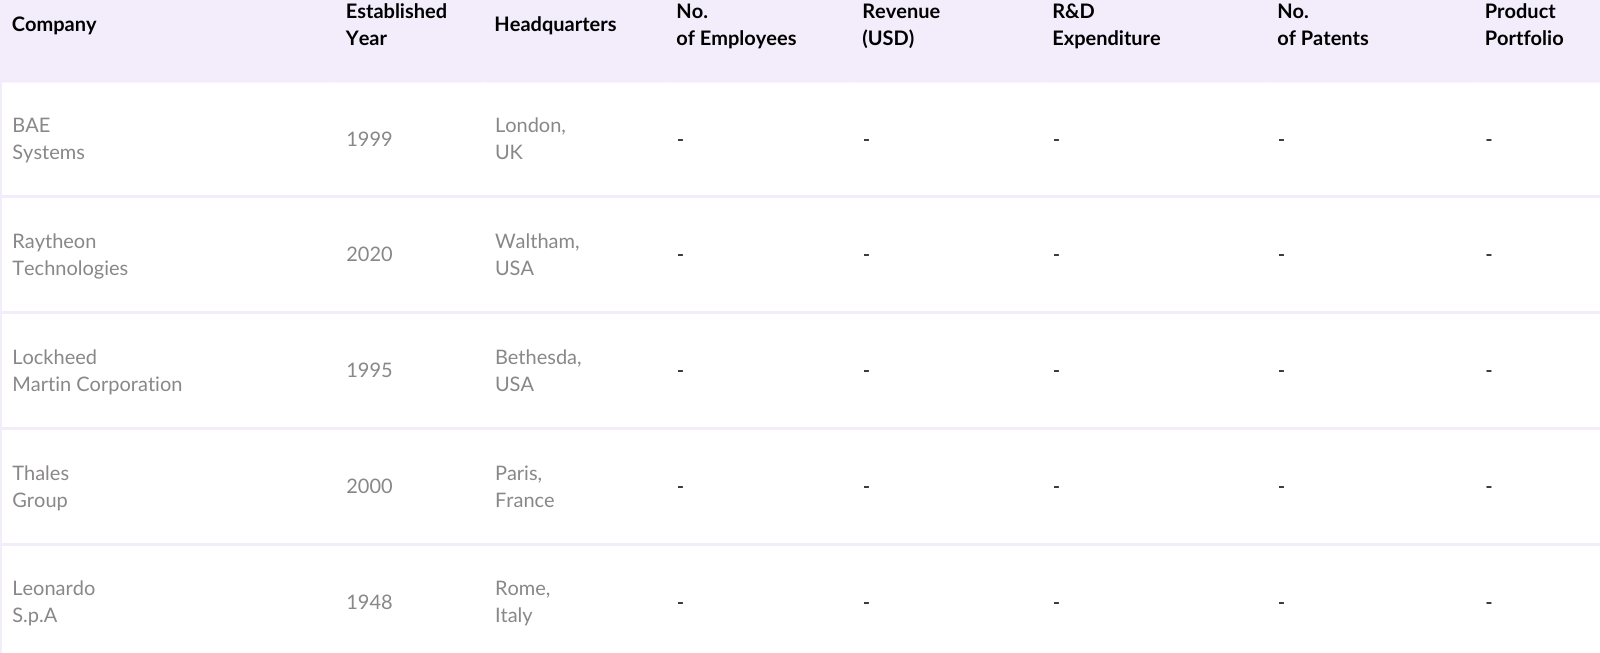
The Asia Pacific Non-Lethal Weapons market is dominated by a few key players, with major defense contractors and specialized technology providers leading the charge. Companies such as BAE Systems and Raytheon Technologies have an extensive product portfolio in non-lethal weaponry, while local companies are also emerging due to the growing regional demand for security solutions.
Over the next five years, the Asia Pacific Non-Lethal Weapons market is expected to experience robust growth driven by rising defense budgets, the need for advanced security tools for border control, and the increasing adoption of non-lethal technologies by law enforcement agencies. Government initiatives, particularly in China, India, and Australia, will continue to drive investments in the sector.
|
By Technology |
Directed Energy Weapons Electromagnetic Weapons Kinetic Weapons Chemical Weapons Acoustic Weapons |
|
By End-User |
Law Enforcement Military Civilians Private Security Agencies |
|
By Application |
Riot Control Border Security Defense Training Crowd Management |
|
By Platform |
Handheld Systems Vehicle-Mounted Systems Aerial Platforms Naval Platforms |
|
By Region |
East Asia South Asia Southeast Asia Oceania Rest of Asia Pacific |
1.1. Definition and Scope
1.2. Market Taxonomy
1.3. Market Growth Rate
1.4. Market Segmentation Overview
2.1. Historical Market Size
2.2. Year-On-Year Growth Analysis
2.3. Key Market Developments and Milestones
3.1. Growth Drivers
3.1.1. Rising Political Instability
3.1.2. Increasing Demand for Riot Control Equipment
3.1.3. Border Security Requirements
3.1.4. Government Funding & Policy Support
3.2. Market Challenges
3.2.1. Ethical Concerns Regarding Usage
3.2.2. High Production Costs (Laser, Acoustic Technologies)
3.2.3. Limited Range and Efficacy in Extreme Conditions
3.3. Opportunities
3.3.1. Integration of Advanced Technologies (AI, IoT)
3.3.2. Expansion into New Geographies
3.3.3. Rising Adoption by Law Enforcement Agencies
3.4. Trends
3.4.1. Increased Use of Directed Energy Weapons
3.4.2. Shift Towards Portable, Lightweight Solutions
3.4.3. Emphasis on Less Harmful Weapons (Rubber Bullets, Tear Gas)
3.5. Government Regulation
3.5.1. Use of Force Policies in Riot Control
3.5.2. Border Security Mandates
3.5.3. Export Control Regulations
3.5.4. Procurement Framework for Defense and Police Forces
3.6. SWOT Analysis
3.7. Stakeholder Ecosystem
3.8. Porters Five Forces Analysis (Power of Buyers, Power of Suppliers, New Entrants, Substitutes, Competition)
3.9. Competitive Ecosystem Analysis
4.1. By Technology (In Value %)
4.1.1. Directed Energy Weapons (Microwave, Laser)
4.1.2. Electromagnetic Weapons
4.1.3. Kinetic Weapons (Rubber Bullets, Bean Bags)
4.1.4. Chemical Weapons (Pepper Spray, Tear Gas)
4.1.5. Acoustic Weapons
4.2. By End-User (In Value %)
4.2.1. Law Enforcement
4.2.2. Military
4.2.3. Civilians
4.2.4. Private Security Agencies
4.3. By Application (In Value %)
4.3.1. Riot Control
4.3.2. Border Security
4.3.3. Defense Training
4.3.4. Crowd Management
4.4. By Platform (In Value %)
4.4.1. Handheld Systems
4.4.2. Vehicle-Mounted Systems
4.4.3. Aerial Platforms
4.4.4. Naval Platforms
4.5. By Region (In Value %)
4.5.1. East Asia
4.5.2. South Asia
4.5.3. Southeast Asia
4.5.4. Oceania
4.5.5. Rest of Asia Pacific
5.1. Detailed Profiles of Major Companies
5.1.1. BAE Systems
5.1.2. Raytheon Technologies
5.1.3. Lockheed Martin Corporation
5.1.4. Thales Group
5.1.5. Leonardo S.p.A.
5.1.6. Axon Enterprise, Inc.
5.1.7. Rheinmetall AG
5.1.8. The Safariland Group
5.1.9. LRAD Corporation
5.1.10. TASER International
5.1.11. General Dynamics Corporation
5.1.12. AMTEC Less-Lethal Systems
5.1.13. Combined Systems, Inc.
5.1.14. FN Herstal
5.1.15. KRATOS Defense & Security Solutions
5.2. Cross Comparison Parameters (Market Capitalization, Headquarters, Inception Year, R&D Expenditure, Number of Patents, Revenue, Product Portfolio, Regional Presence)
5.3. Market Share Analysis
5.4. Strategic Initiatives
5.5. Mergers and Acquisitions
5.6. Investment Analysis
5.7. Venture Capital Funding
5.8. Government Grants
5.9. Private Equity Investments
6.1. Compliance Standards
6.2. Export Control Laws
6.3. Import Tariffs
6.4. Ethical and Legal Considerations
7.1. Future Market Size Projections
7.2. Key Factors Driving Future Market Growth
8.1. By Technology (In Value %)
8.2. By End-User (In Value %)
8.3. By Application (In Value %)
8.4. By Platform (In Value %)
8.5. By Region (In Value %)
9.1. TAM/SAM/SOM Analysis
9.2. Customer Cohort Analysis
9.3. Strategic Marketing Recommendations
9.4. White Space Opportunity Identification
In this phase, historical data from credible sources was compiled to assess market growth trends, penetration rates, and revenue generation across segments. A bottom-up approach was employed to validate market sizes and shares.
Market assumptions were validated through interviews with industry experts, including defense technology manufacturers and security consultants. These insights helped refine market projections and identify key industry challenges.
The final phase involved engaging with non-lethal weapons manufacturers to gain insights into product offerings, sales performance, and technology adoption trends. This comprehensive approach ensured the accuracy of the market estimates.
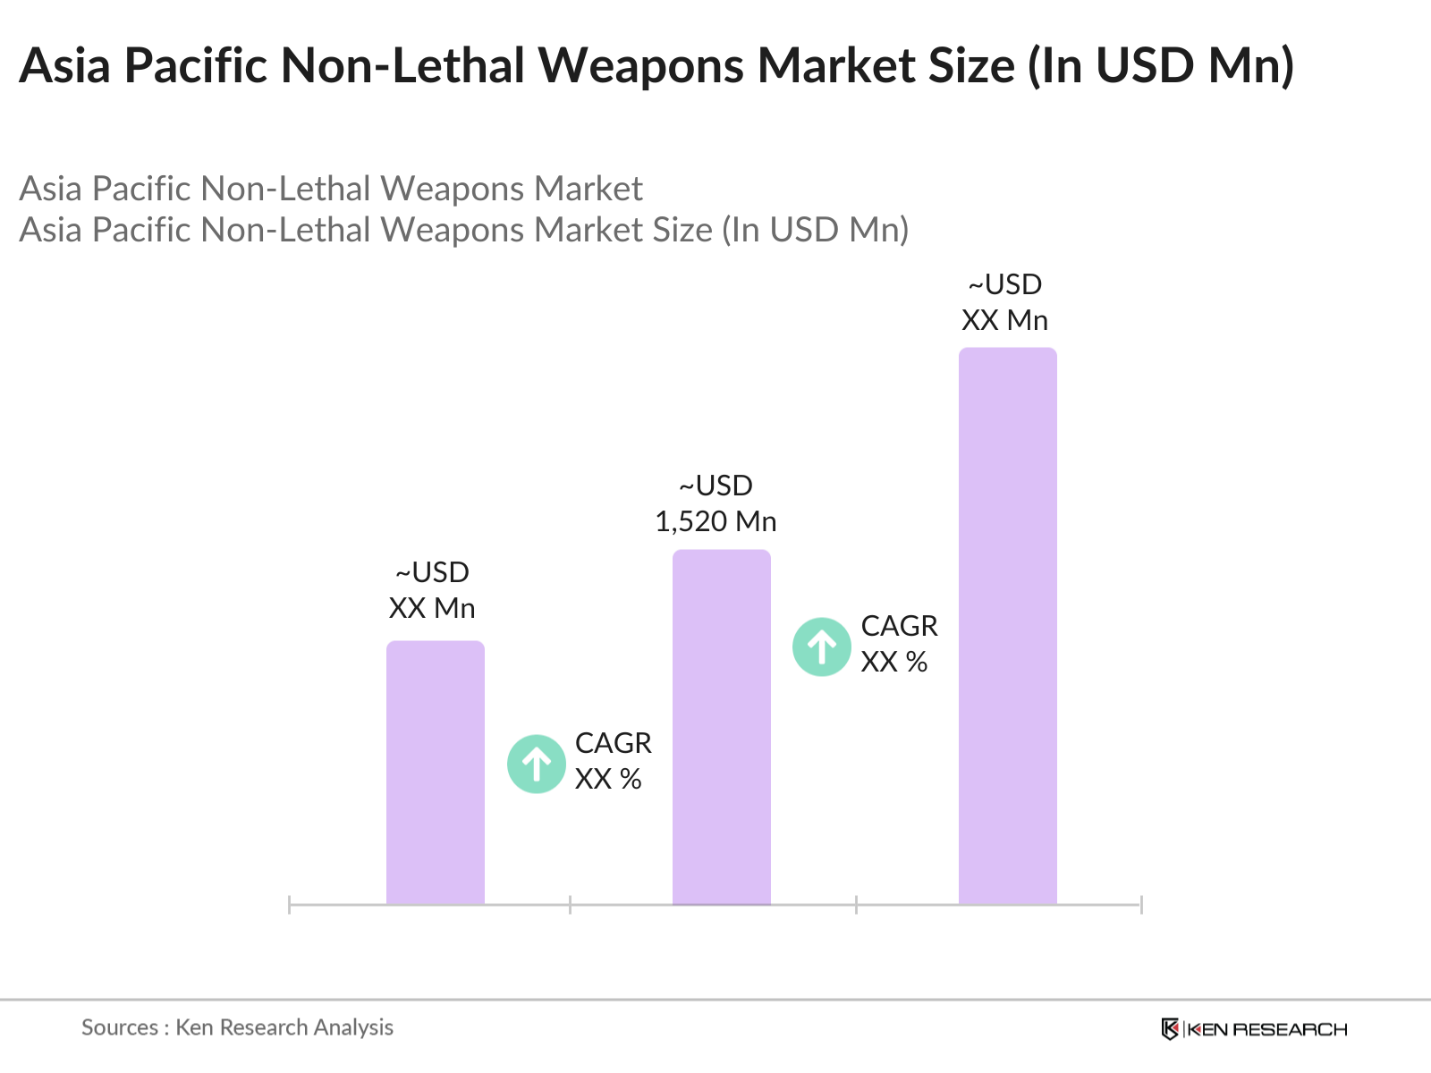
The Asia Pacific Non-Lethal Weapons market is valued at USD 1,520 million, based on a five-year historical analysis. This markets growth is driven by key factors, such as the rising demand for crowd control, riot management, and border security operations.
Challenges include ethical concerns regarding the use of non-lethal weapons, high production costs for advanced technologies, and limited effectiveness in extreme conditions.
Key players include BAE Systems, Raytheon Technologies, Lockheed Martin Corporation, Thales Group, and Leonardo S.p.A., dominating the market with their extensive product portfolios and global presence.
The market is driven by the increasing demand for crowd control, rising political instability, and government investments in non-lethal weapon technologies.

What makes us stand out is that our consultants follows Robust, Refine and Result (RRR) methodology. i.e. Robust for clear definitions, approaches and sanity checking, Refine for differentiating respondents facts and opinions and Result for presenting data with story

We have set a benchmark in the industry by offering our clients with syndicated and customized market research reports featuring coverage of entire market as well as meticulous research and analyst insights.

While we don't replace traditional research, we flip the method upside down. Our dual approach of Top Bottom & Bottom Top ensures quality deliverable by not just verifying company fundamentals but also looking at the sector and macroeconomic factors.

With one step in the future, our research team constantly tries to show you the bigger picture. We help with some of the tough questions you may encounter along the way: How is the industry positioned? Best marketing channel? KPI's of competitors? By aligning every element, we help maximize success.

Our report gives you instant access to the answers and sources that other companies might choose to hide. We elaborate each steps of research methodology we have used and showcase you the sample size to earn your trust.

If you need any support, we are here! We pride ourselves on universe strength, data quality, and quick, friendly, and professional service.