CHAPTER 1 - MARKET SUMMARY
Market Overview
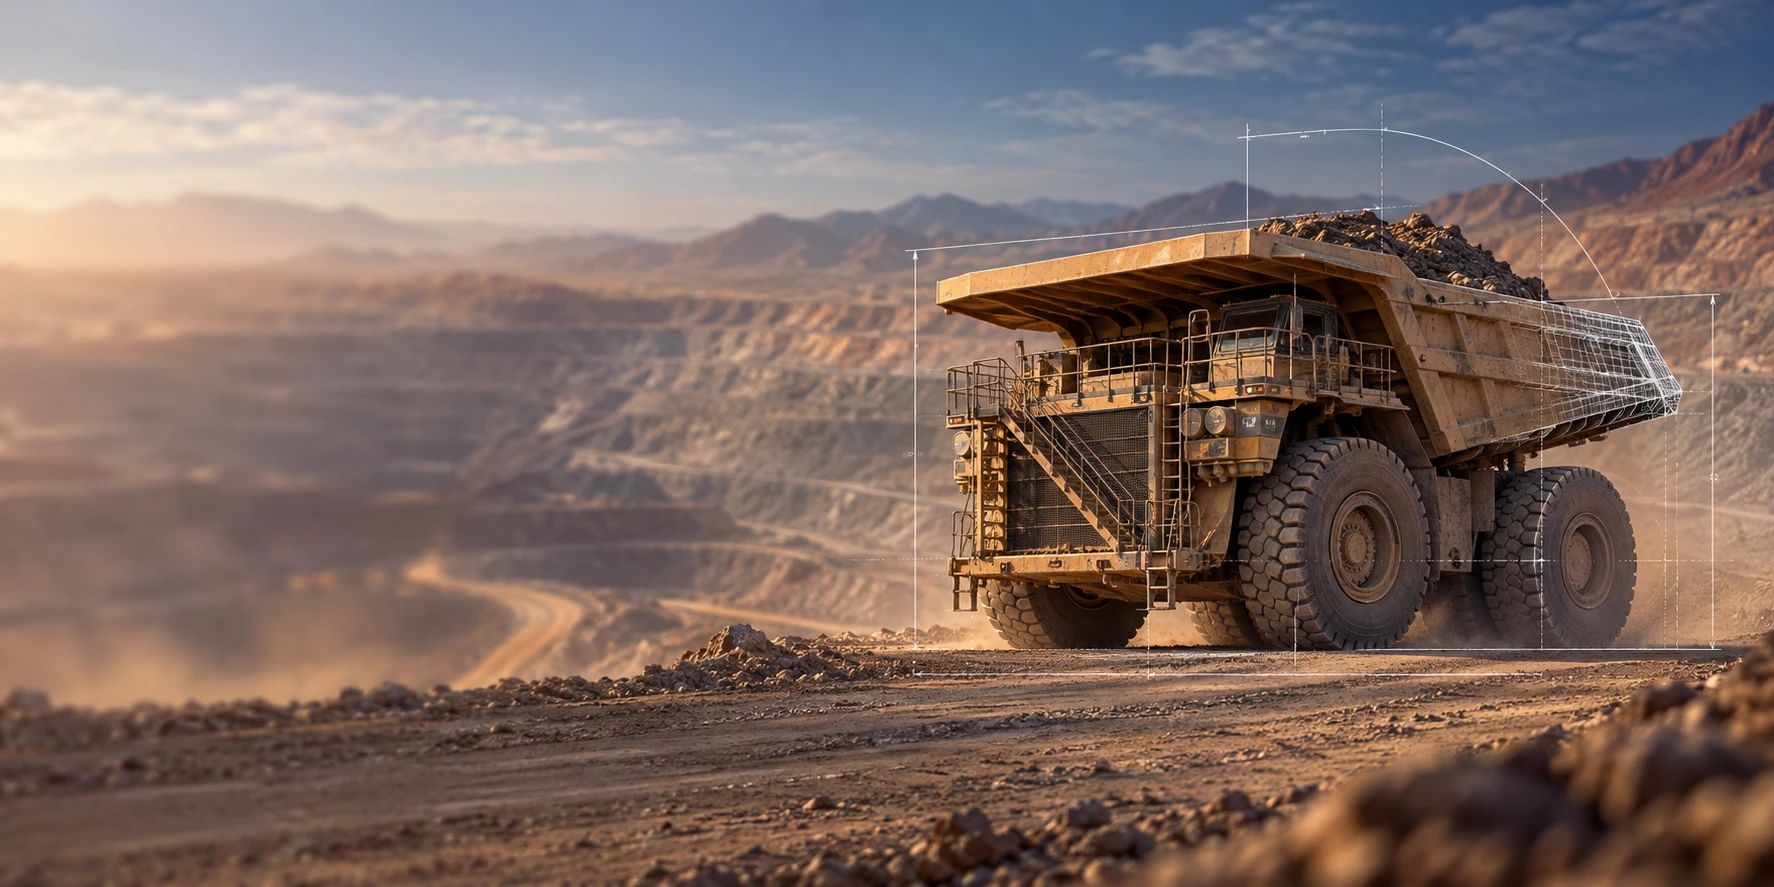
The Chile Mining Market operates primarily as an export-oriented producer market, with mine operators monetizing copper concentrates, cathodes, lithium chemicals, precious metals and other mineral products through global commodity channels. Mining exports expanded 18.9% in 2025 and represented 60.5% of total Chilean merchandise exports, making commodity pricing, production continuity and overseas demand central determinants of sector revenue and cash flow.
Antofagasta remains the country's principal mining hub because it combines globally significant copper districts, lithium operations and large-scale infrastructure. Cochilco's 2024-2033 investment portfolio assigns approximately USD 31.3 billion, or about 38% of the national project portfolio, to Antofagasta. Concentrated mine density creates procurement, power, desalination, port and contractor economies that materially influence operating economics and investment prioritization.
Market Value
USD 70 billion
2025
Dominant Region
Antofagasta
Dominant Segment
Mineral Type
Copper-led
Total Number of Players
2,053
Future Outlook
The Chile Mining Market is expected to move from USD 70 billion in 2025 toward USD 86 billion by 2032, equivalent to a base-case CAGR of 3.00%. Revenue growth is expected to be more moderate than the 2020-2025 historical CAGR of 9.71% because the forecast assumes normalized commodity-price gains after the exceptional copper and lithium cycles of the earlier period. Copper volumes provide partial support, with Cochilco projecting national fine-copper production to rise from about 5.41 million tons in 2025 to 5.97 million tons in 2027 before entering a mid-period production adjustment.
Growth through 2032 is expected to depend increasingly on brownfield investment, improved recoveries, sulfide concentration, seawater systems and lithium-process innovation rather than simple increases in mined tonnage. Cochilco's published portfolio contains 51 projects representing USD 83.181 billion of investment, with copper accounting for 88.6% of the portfolio. The forecast therefore incorporates both replacement capital and selective capacity additions while recognizing declining ore grades at mature deposits. By 2032, national copper output is projected at approximately 5.86 million tons, supporting the market's strategic scale without assuming continuous high-volume expansion.
3.00%
Forecast CAGR
USD 86 Bn
2030 Projection
Base Year
2025
Historical Period
2020-2025
Forecast Period
2025-2032
Historical CAGR
9.71%
CHAPTER 2 - SCOPE OF REPORT
Scope of the Market
CHAPTER 3 - Key Stakeholders
Key Target Audience
Key stakeholders who can leverage from this market analysis for investment, strategy, and operational planning.
Investors
commodity exposure, CAGR, capex intensity, cash costs
Corporates
production volume, grade, processing, offtake, expansion economics
Government
royalties, exports, water efficiency, safety, regional development
Operators
throughput, recovery, energy, water, maintenance, mine planning
Financial institutions
project finance, price risk, covenants, reserve life
CHAPTER 4 - Market Size & Growth
Market Size, Growth Forecast and Trends
This section evaluates the historical market size, analyzes year-over-year growth dynamics, and presents forecast projections supported by market performance indicators and demand-side drivers.
Historical & Projected Market Size ($ Million)
Year-over-Year Growth Rate (%)
Market Value vs Volume Growth (%)
Historical Market Performance
The historical period was characterized by unusually large commodity-price and mix effects. Market value expanded sharply in 2021 as copper pricing strengthened, while the 2022 lithium price cycle supported another increase despite lower copper tonnage. The model records a 15.9% correction in 2023, followed by a 10.9% recovery in 2024. In 2025, mining exports rose 18.9%, lifting the base-year revenue estimate despite copper mine output easing to approximately 5.42 million tons.
Forecast Market Outlook
The base case moderates from historical commodity-cycle volatility toward a 3.00% CAGR for 2025-2032. Market value reaches approximately USD 81 billion in 2030 and USD 86 billion in 2032. Physical copper output is expected to peak near 5.97 million tons in 2027, decline toward 5.43 million tons in 2030, and recover to roughly 5.86 million tons in 2032. Investment-led productivity, pricing and lithium diversification therefore contribute more to value growth than uninterrupted copper-volume expansion.
CHAPTER 5 - Market Data
Market Breakdown
The Chile Mining Market combines a high-value export base with mature copper assets and a substantial investment pipeline. For CEOs and investors, the critical operating variables are physical copper output, realized export value and the increasing infrastructure intensity required to sustain production.
Year | Market Size (USD Bn) | YoY Growth (%) | Copper Mine Production (Mt) | Mining Exports (USD Bn) | Copper Mining Electricity Demand (TWh) | Period |
|---|---|---|---|---|---|---|
| 2020 | $44 Mn | +- | 5.733 | 42.424 | Forecast | |
| 2021 | $61 Mn | +37.5% | 5.625 | 57.950 | Forecast | |
| 2022 | $63 Mn | +4.2% | 5.330 | 55.923 | Forecast | |
| 2023 | $53 Mn | +-15.9% | 5.250 | 51.021 | Forecast | |
| 2024 | $59 Mn | +10.9% | 5.506 | 56.106 | Forecast | |
| 2025 | $70 Mn | +18.9% | 5.415 | 66.736 | Forecast | |
| 2026 | $72 Mn | +3.2% | 5.610 | - | Forecast | |
| 2027 | $75 Mn | +4.2% | 5.970 | - | Forecast | |
| 2028 | $77 Mn | +2.4% | 5.700 | - | Forecast | |
| 2029 | $79 Mn | +2.6% | 5.540 | - | Forecast | |
| 2030 | $81 Mn | +2.7% | 5.430 | - | Forecast | |
| 2031 | $84 Mn | +3.1% | 5.470 | - | Forecast | |
| 2032 | $86 Mn | +2.9% | 5.860 | - | Forecast |
Copper Mine Production
5.415 million tons, 2025, Chile. Production is projected to reach about 5.97 million tons in 2027 before grade depletion lowers output through 2030, making brownfield execution and recovery improvements central to future revenue resilience.
Mining Exports
USD 66.736 billion, 2025, Chile. Mining represented 60.5% of merchandise exports and grew 18.9% during the year, confirming that producer economics remain highly exposed to international commodity prices and overseas demand.
Copper Mining Electricity Demand
28.9 TWh, 2025 projection, Chile. Cochilco expects demand to reach 32.5 TWh by 2034, a 20.8% increase from 2024 versus only 5.6% projected copper-production growth, increasing the strategic value of efficient concentration, renewable sourcing and water-pumping systems.
CHAPTER 6 - Segmentation
Market Segmentation Framework
Comprehensive analysis across key dimensions providing insights into market structure, production economics, ownership patterns, processing technologies and geographic concentration.
No of Segments
7
Dominant Segment
Mineral Type
Fastest Growing Segment
Processing Technology
Mineral Type
Mining Method
Product Form
Operation Scale
Ownership Model
Processing Technology
Geography
Key Segmentation Takeaways
Comprehensive analysis across all extracted segmentation dimensions provides insight into production economics, mine configuration, asset ownership, processing intensity and regional operating clusters.
Mineral Type
Copper remains the central revenue pool because Chile combines very large porphyry deposits, established concentrator infrastructure, global export relationships and state as well as private mining capacity. Lithium adds strategic diversification, while gold, silver, molybdenum and iron ore broaden the product base. Within this dimension, copper remains the most commercially important Level-2 sub-segment.
Processing Technology
The fastest structural change is occurring in processing systems as declining oxide resources, lower ore grades and water constraints shift investment toward concentration, efficient grinding, desalinated-water integration and advanced lithium recovery. Flotation Concentration remains critical for new sulfide capacity, while Brine Concentration & Conversion gains strategic importance as lithium operators pursue higher recovery and reduced freshwater intensity.
CHAPTER 7 - Regional Analysis
Regional Analysis
Chile ranks first in the selected Latin American mining peer set on the report's harmonized 2025 sector-value basis, ahead of Peru and Brazil. Its position is supported by unusually high export intensity, a deep copper project pipeline and leadership in both copper and lithium export categories. Peer market values are Ken Research harmonized estimates using national production, revenue and export anchors.
Focus Country Ranking
1st
Focus Country Market Size
USD 70 Bn (2025)
Chile CAGR (2025-2032)
3.0%
Focus Country Ranking
1st
Focus Country Market Size
USD 70 Bn (2025)
Chile CAGR (2025-2032)
3.0%
Regional Analysis (Current Year)
Market Position
Chile ranks first among these five peers at approximately USD 70 billion, while Peru recorded USD 62.848 billion of mining exports in 2025 and Brazil reported sector revenue near USD 54 billion equivalent.
Growth Advantage
Chile's 3.0% base-case CAGR reflects mature scale, versus modeled growth of 3.7% for Peru and 7.8% for Argentina, where lower starting bases and larger greenfield pipelines create stronger percentage expansion potential.
Competitive Strengths
Chile combines an USD 83.181 billion project portfolio with 16.2% of global copper export value and 62.2% of global lithium-carbonate exports, giving the market unusual strategic depth across two transition-critical mineral chains.
CHAPTER 8 - INDUSTRY ANALYSIS
Growth Drivers, Challenges & Opportunities
Comprehensive analysis of key factors shaping the Chile Mining Market, including growth catalysts, operational challenges, and emerging opportunities across production, processing, infrastructure and export segments.
Growth Drivers
Copper Export Leverage and Electrification Demand
- Chile exported approximately USD 53.691 billion of copper products in 2025, equivalent to 16.2% of global copper export value, supporting pricing power, infrastructure utilization and foreign-exchange generation across the mining ecosystem.
- Copper concentrates generated approximately USD 34.743 billion of exports in 2025, representing 28.9% of global concentrate exports, sustaining demand for mine-to-port logistics, concentrator operations and long-term offtake relationships.
- Cochilco projected a 165,000-ton refined-copper deficit for 2026 in its 2025 market outlook, reinforcing the commercial case for efficient brownfield production and high-recovery processing capacity in Chile.
Investment Pipeline and Brownfield Capacity Renewal
- Copper accounts for approximately 88.6% of the published investment portfolio, directing the largest profit pools toward concentrators, mine development, desalination, tailings, power systems and fleet modernization.
- Antofagasta captures approximately USD 31.317 billion of the portfolio, around 38% of the national total, reinforcing the region's importance for suppliers, construction contractors and infrastructure investors.
- National copper production is projected to rise from about 5.41 million tons in 2025 to 5.97 million tons in 2027, showing the near-term contribution expected from projects already entering or ramping production.
Lithium Diversification and Battery-Material Exports
- Lithium exports generated USD 2.397 billion in 2025, while shipped volume increased 2.6%, supporting logistics, chemical conversion and specialty-processing demand despite weaker lithium prices.
- Chile represented 62.2% of global lithium-carbonate exports in 2025, providing international battery-material buyers with a highly established supply base and reinforcing the strategic value of Salar de Atacama operations.
- Codelco and SQM established NovaAndino Litio with a development horizon extending to 2060, introducing long-duration state-private participation into the country's largest lithium district.
Market Challenges
Ore-Grade Decline and Production Volatility
- Codelco produced 1.334 million tons of own copper in 2025, but its disclosures continue to identify ageing deposits, declining grades and geotechnical complexity as structural operating pressures requiring sustained development capital.
- Anglo American's Chile guidance for 2026 was 390,000-420,000 tons, with output sensitive to grade sequencing, plant throughput and Collahuasi performance, illustrating how individual large mines can move national supply materially.
- Cochilco expects output to recover to approximately 5.86 million tons by 2032, meaning replacement projects must offset natural depletion before the country achieves sustained growth beyond the mid-decade trough.
Water and Electricity Intensity
- Seawater is projected to reach 67.6% of copper-mining water consumption by 2034, shifting capital needs toward desalination, pumping, pipelines and coastal infrastructure while reducing dependence on continental sources.
- Electricity demand is projected to rise from 26.9 TWh in 2024 to 32.5 TWh in 2034, an increase of 20.8%, materially faster than expected copper-production growth over the same horizon.
- Concentration alone is projected to consume 18.7 TWh in 2034, or 57.6% of copper-mining electricity demand, increasing sensitivity to power-contract economics, grinding efficiency and renewable-energy availability.
Fiscal, Permitting and Safety Execution
- The mining-margin component carries statutory rates between 8% and 26% for qualifying large copper miners, causing project returns to become more sensitive to commodity prices, mine grades and deductible operating economics.
- The law establishes a potential maximum tax-burden ceiling of 46.5% of adjusted taxable mining income for covered operators, making fiscal modeling an integral part of mine expansion and acquisition decisions.
- Sernageomin conducted 8,478 inspections in 2024 and reported 11 mining fatalities, keeping safety governance, closure planning and regulatory compliance material to license-to-operate and operating-continuity risk.
Market Opportunities
Desalination and Water-Infrastructure Services
- Projected seawater consumption rises toward approximately 13.9 m3/s by 2034, creating monetizable demand for desalination plants, intake systems, pipelines, high-head pumping, maintenance and renewable-power integration.
- Energy used for seawater systems is projected to reach about 5.4 TWh in 2034, creating opportunities for power developers, efficient pumping technology, storage solutions and long-duration electricity contracts.
- Antofagasta is projected to account for a substantial share of mining water demand and holds approximately USD 31.317 billion of identified mining investment, concentrating addressable infrastructure opportunities in a relatively defined operating corridor.
Automation, Concentration and Processing Upgrades
- Concentration is projected to represent 57.6% of sector electricity consumption by 2034, creating investment opportunities in advanced grinding, flotation optimization, ore sorting, predictive maintenance and process-control platforms.
- Sernageomin's regulatory modernization program includes updating mining-safety rules to address automation and new technologies, supporting wider deployment where safety and operating-control requirements are met.
- BHP's Escondida produced 1.305 million tons in FY2025, its highest production in 17 years, supported by record concentrator throughput, improved recovery and higher feed grade, illustrating the earnings value of processing execution.
Lithium Technology and Public-Private Expansion
- Albemarle reported a Chilean direct-lithium-extraction pilot achieving more than 94% lithium recovery over 3,000 operating hours, indicating potential for higher process efficiency and lower net brine pumping.
- Chile exported 321,695 tons of lithium-carbonate equivalent in 2025, giving conversion plants and specialty-chemical suppliers a material existing feedstock and customer base rather than a purely prospective opportunity.
- USGS estimates Chile held approximately 9.2 million tons of lithium reserves in 2025, supporting a long-duration resource base for technology-led extraction, conversion and battery-material partnerships.
CHAPTER 9 - Competitive Landscape
Competitive Landscape Overview
The Chile Mining Market combines a concentrated large-scale copper core with a long tail of mid-tier and small operations. Sernageomin inspected 887 operating sites in 2024, representing 43.2% of its cadastral operating-site universe.
Market Share Distribution
Top 5 Players
Market Dynamics
8 new entrants in the past 5 years, indicating strong market attractiveness and growth potential.
Company Name | Market Share | Headquarters | Founding Year | Core Market Focus |
|---|---|---|---|---|
Codelco | - | Santiago, Chile | 1976 | Large-scale copper mining, concentrators, cathodes and expanding lithium participation. Own copper production reached 1.334 million tons in 2025. |
BHP | - | Melbourne, Australia | 1885 | Escondida and Spence copper operations. Escondida produced 1.305 million tons on a 100% basis in FY2025. |
Antofagasta Minerals | - | Santiago, Chile | - | Los Pelambres, Centinela, Antucoya and Zaldívar copper assets. Group mining production reached 653,700 tons in 2025. |
Compañía Minera Doña Inés de Collahuasi SCM | - | Santiago, Chile | - | Large-scale copper and molybdenum production through sulfide concentration and oxide processing in Tarapacá. |
Anglo American | - | London, United Kingdom | 1917 | Los Bronces, El Soldado and Collahuasi participation. Chile copper guidance for 2026 was 390,000-420,000 tons. |
Teck Resources | - | Vancouver, Canada | 1913 | Quebrada Blanca and Carmen de Andacollo copper operations. Quebrada Blanca produced 190,000 tons in 2025. |
Lundin Mining | - | Vancouver, Canada | 1994 | Candelaria and Caserones copper operations. The two Chile assets produced 145,471 tons and 132,881 tons respectively in 2025 on a 100% basis. |
Freeport-McMoRan | - | Phoenix, United States | 1988 | El Abra copper operation, jointly owned with Codelco. El Abra produced 201 million pounds of copper in 2025. |
SQM | - | Santiago, Chile | 1968 | Lithium extraction and conversion centered on Salar de Atacama, with long-term participation through NovaAndino Litio alongside Codelco. |
Albemarle | - | Charlotte, United States | 1994 | Lithium brine extraction at Salar de Atacama and lithium-carbonate conversion at La Negra, Antofagasta. |
Cross Comparison Parameters
The report provides detailed cross-comparison of key players across 10 performance parameters to identify competitive strengths and weaknesses.
Copper Production Volume
Unit Cash Cost
Chile Mining Revenue Growth
EBITDA Margin
Analysis Covered
Market Share Analysis:
Compares disclosed Chilean production and in-scope revenue positioning across operators.
Cross Comparison Matrix:
Benchmarks output, cost, revenue growth and operating profitability metrics.
SWOT Analysis:
Assesses asset quality, costs, expansion options and operating constraints.
Pricing Strategy Analysis:
Evaluates commodity exposure, contracts, treatment charges and by-product credits.
Company Profiles:
Reviews major assets, processing routes, ownership and strategic investments.
CHAPTER 10 - REPORT TOC
Table of Contents
Market Assessment Phase
Supply-side and competitive intelligence covering market sizing, segmentation, competitive dynamics, regulatory landscape, and future forecasts.
Go-To-Market Strategy Phase
15 chapters
Entry strategy evaluation, execution roadmap, partner recommendations, and profitability outlook.
Survey Phase
8 chapters
Demand-side primary research conducted through structured interviews and online surveys with end users across priority metros and Tier 2/3 cities to capture consumption behavior, unmet needs, and purchase drivers.
Complete Report Coverage
201+ detailed sections covering every aspect of the market
143
Assessment Sections
58
Strategy Sections
CHAPTER 11 - Our Approach
Research Methodology
Desk Research
- Mine production and export reconciliation
- Copper and lithium output tracking
- Project pipeline and capex mapping
- Royalty and operating-policy review
Primary Research
- Mine General Managers interviewed
- Concentrator Operations Managers interviewed
- Commercial and Offtake Directors interviewed
- Mining Procurement Directors interviewed
Validation and Triangulation
- 304 respondent evidence base cross-checked
- Operator volumes reconciled against exports
- Mine output tested against revenues
- Commodity-cycle assumptions independently stress-tested
CHAPTER 12 - FAQ
FAQs
Still have questions?
Our research team is here to help you find the right solution
CHAPTER 13 - Related Research
Explore Related Reports
Expand your market intelligence with complementary research across regions and adjacent markets.
Regional/Country ReportsRelated market analysis across key regions
Related market analysis across key regions
No regional reports found.
Adjacent ReportsRelated markets and complementary research
Related markets and complementary research
No adjacent reports found.
500+
Market Research Reports
50+
Countries Covered
15+
Industry Verticals