
Customer Satisfaction Survey for Waste Management Company
Region:Asia
Author(s):Geetanshi Chugh
Product Code:KR1547
October 2025
90
About the Report
Survey Overview
Ken Research conducted a customer satisfaction survey for a company in the waste management & recycling sector. Using a 32-question online instrument, we captured feedback from 120 B2B customers who engage with the firm’s waste management, by-product recycling, and industrial services.
The assessment benchmarked delivery, customer support, pricing & invoicing, overall experience, and loyalty. Insights are structured to highlight practical improvement areas and strengthen client relationships through targeted, data-backed actions.
Brand Awareness
Awareness is high but uneven across customers
Awareness of the initiative is strong but uneven, roughly 71% of customers recognize it, leaving nearly 29% still unaware. Close this gap with targeted onboarding, account-manager briefings, and periodic refreshers to keep the offer top-of-mind across regions, contract sizes, and operational stakeholder groups.
Customers view the initiative as a comprehensive, multi-benefit solution
Understanding is largely holistic, nearly 75% select an “all-of-the-above” purpose, viewing the program as simultaneously improving waste management, advancing environmental outcomes, and leveraging technology. Reinforce this integrated proposition while adding persona-specific examples so single-function users also see direct relevance in daily operations and procurement decision workflows.
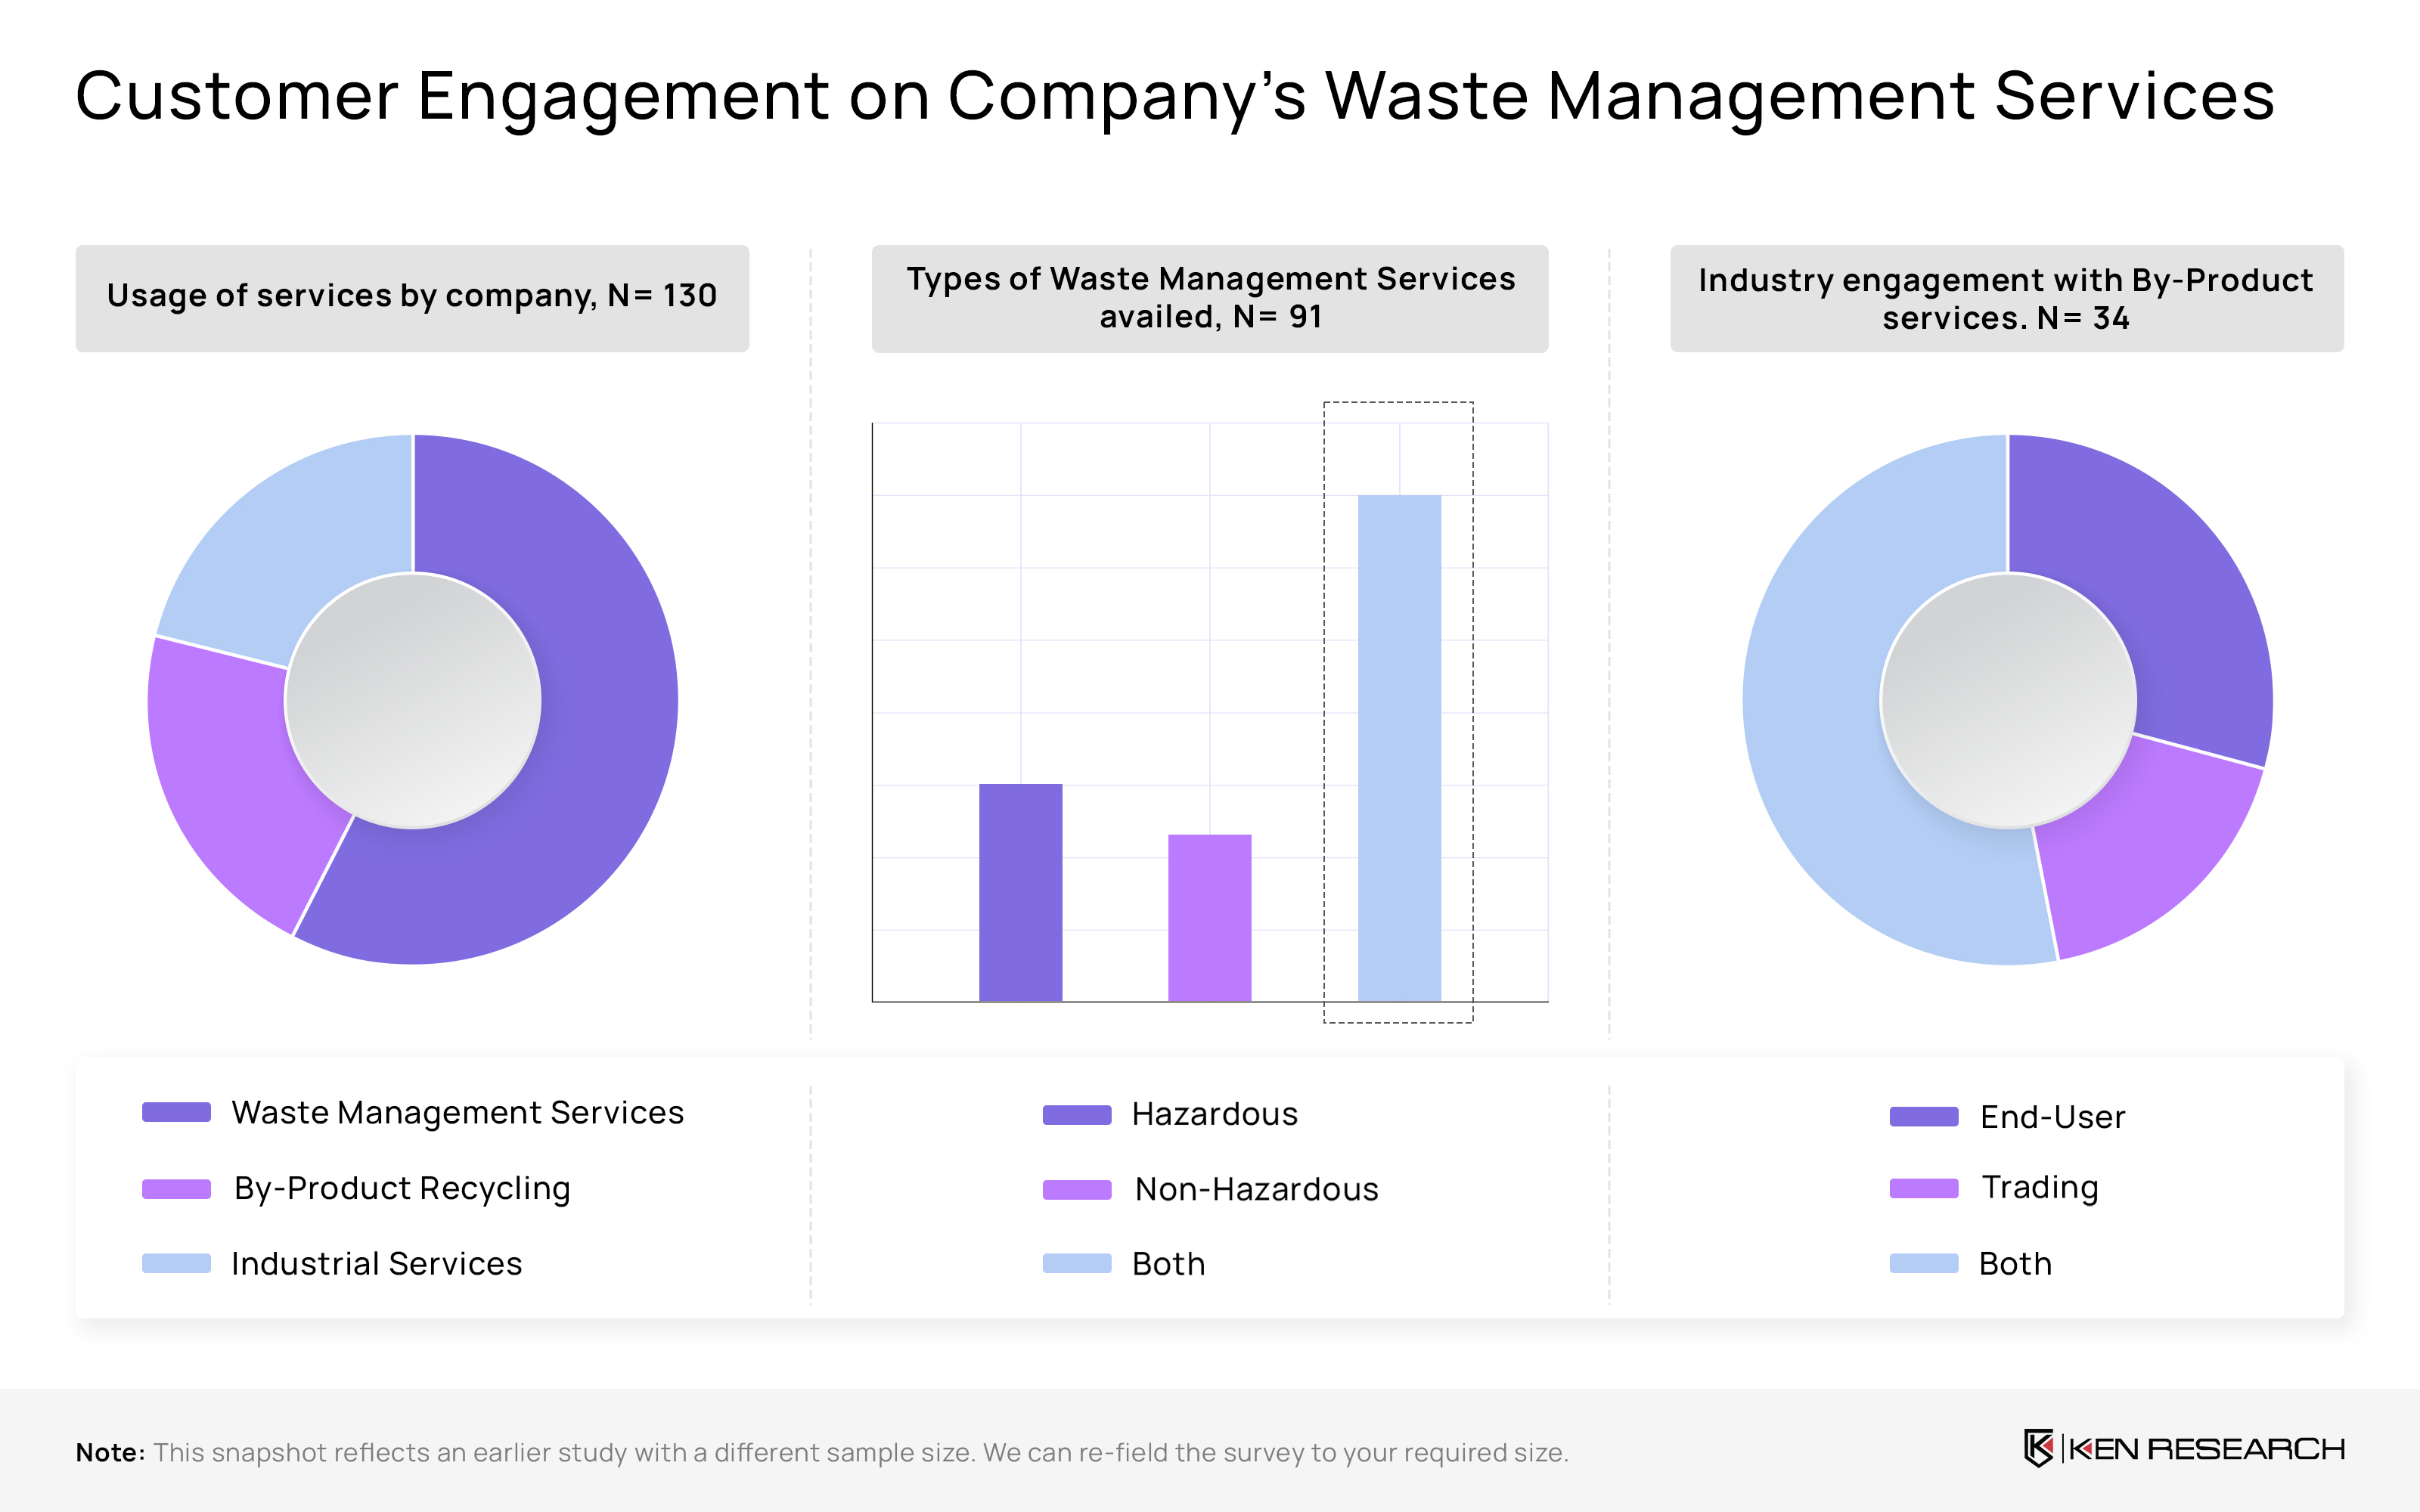
Customer Engagement on Company’s Waste Management Services
Waste management is customers’ primary, recurring service need
Most customers primarily rely on waste-management solutions, with roughly 58% using these services. This indicates the offering is seen as a foundational, recurring need rather than a project-based engagement, and should be packaged with predictable SLAs and simple expansion paths.
Customers prefer combined handling of hazardous and non-hazardous
Among waste-management users, many opt to manage both hazardous and non-hazardous streams together, nearly 57% do so, suggesting buyers value single-partner convenience, unified compliance reporting, and fewer operational handoffs across sites and shifts.
By-product services support recovery and resale value
Where by-product services are adopted, clients often operate in dual roles (end-use and trading). Position offerings to capture both value pools recovery and resale through transparent pricing, take-back guarantees, and standardized quality certifications to ease internal approvals.
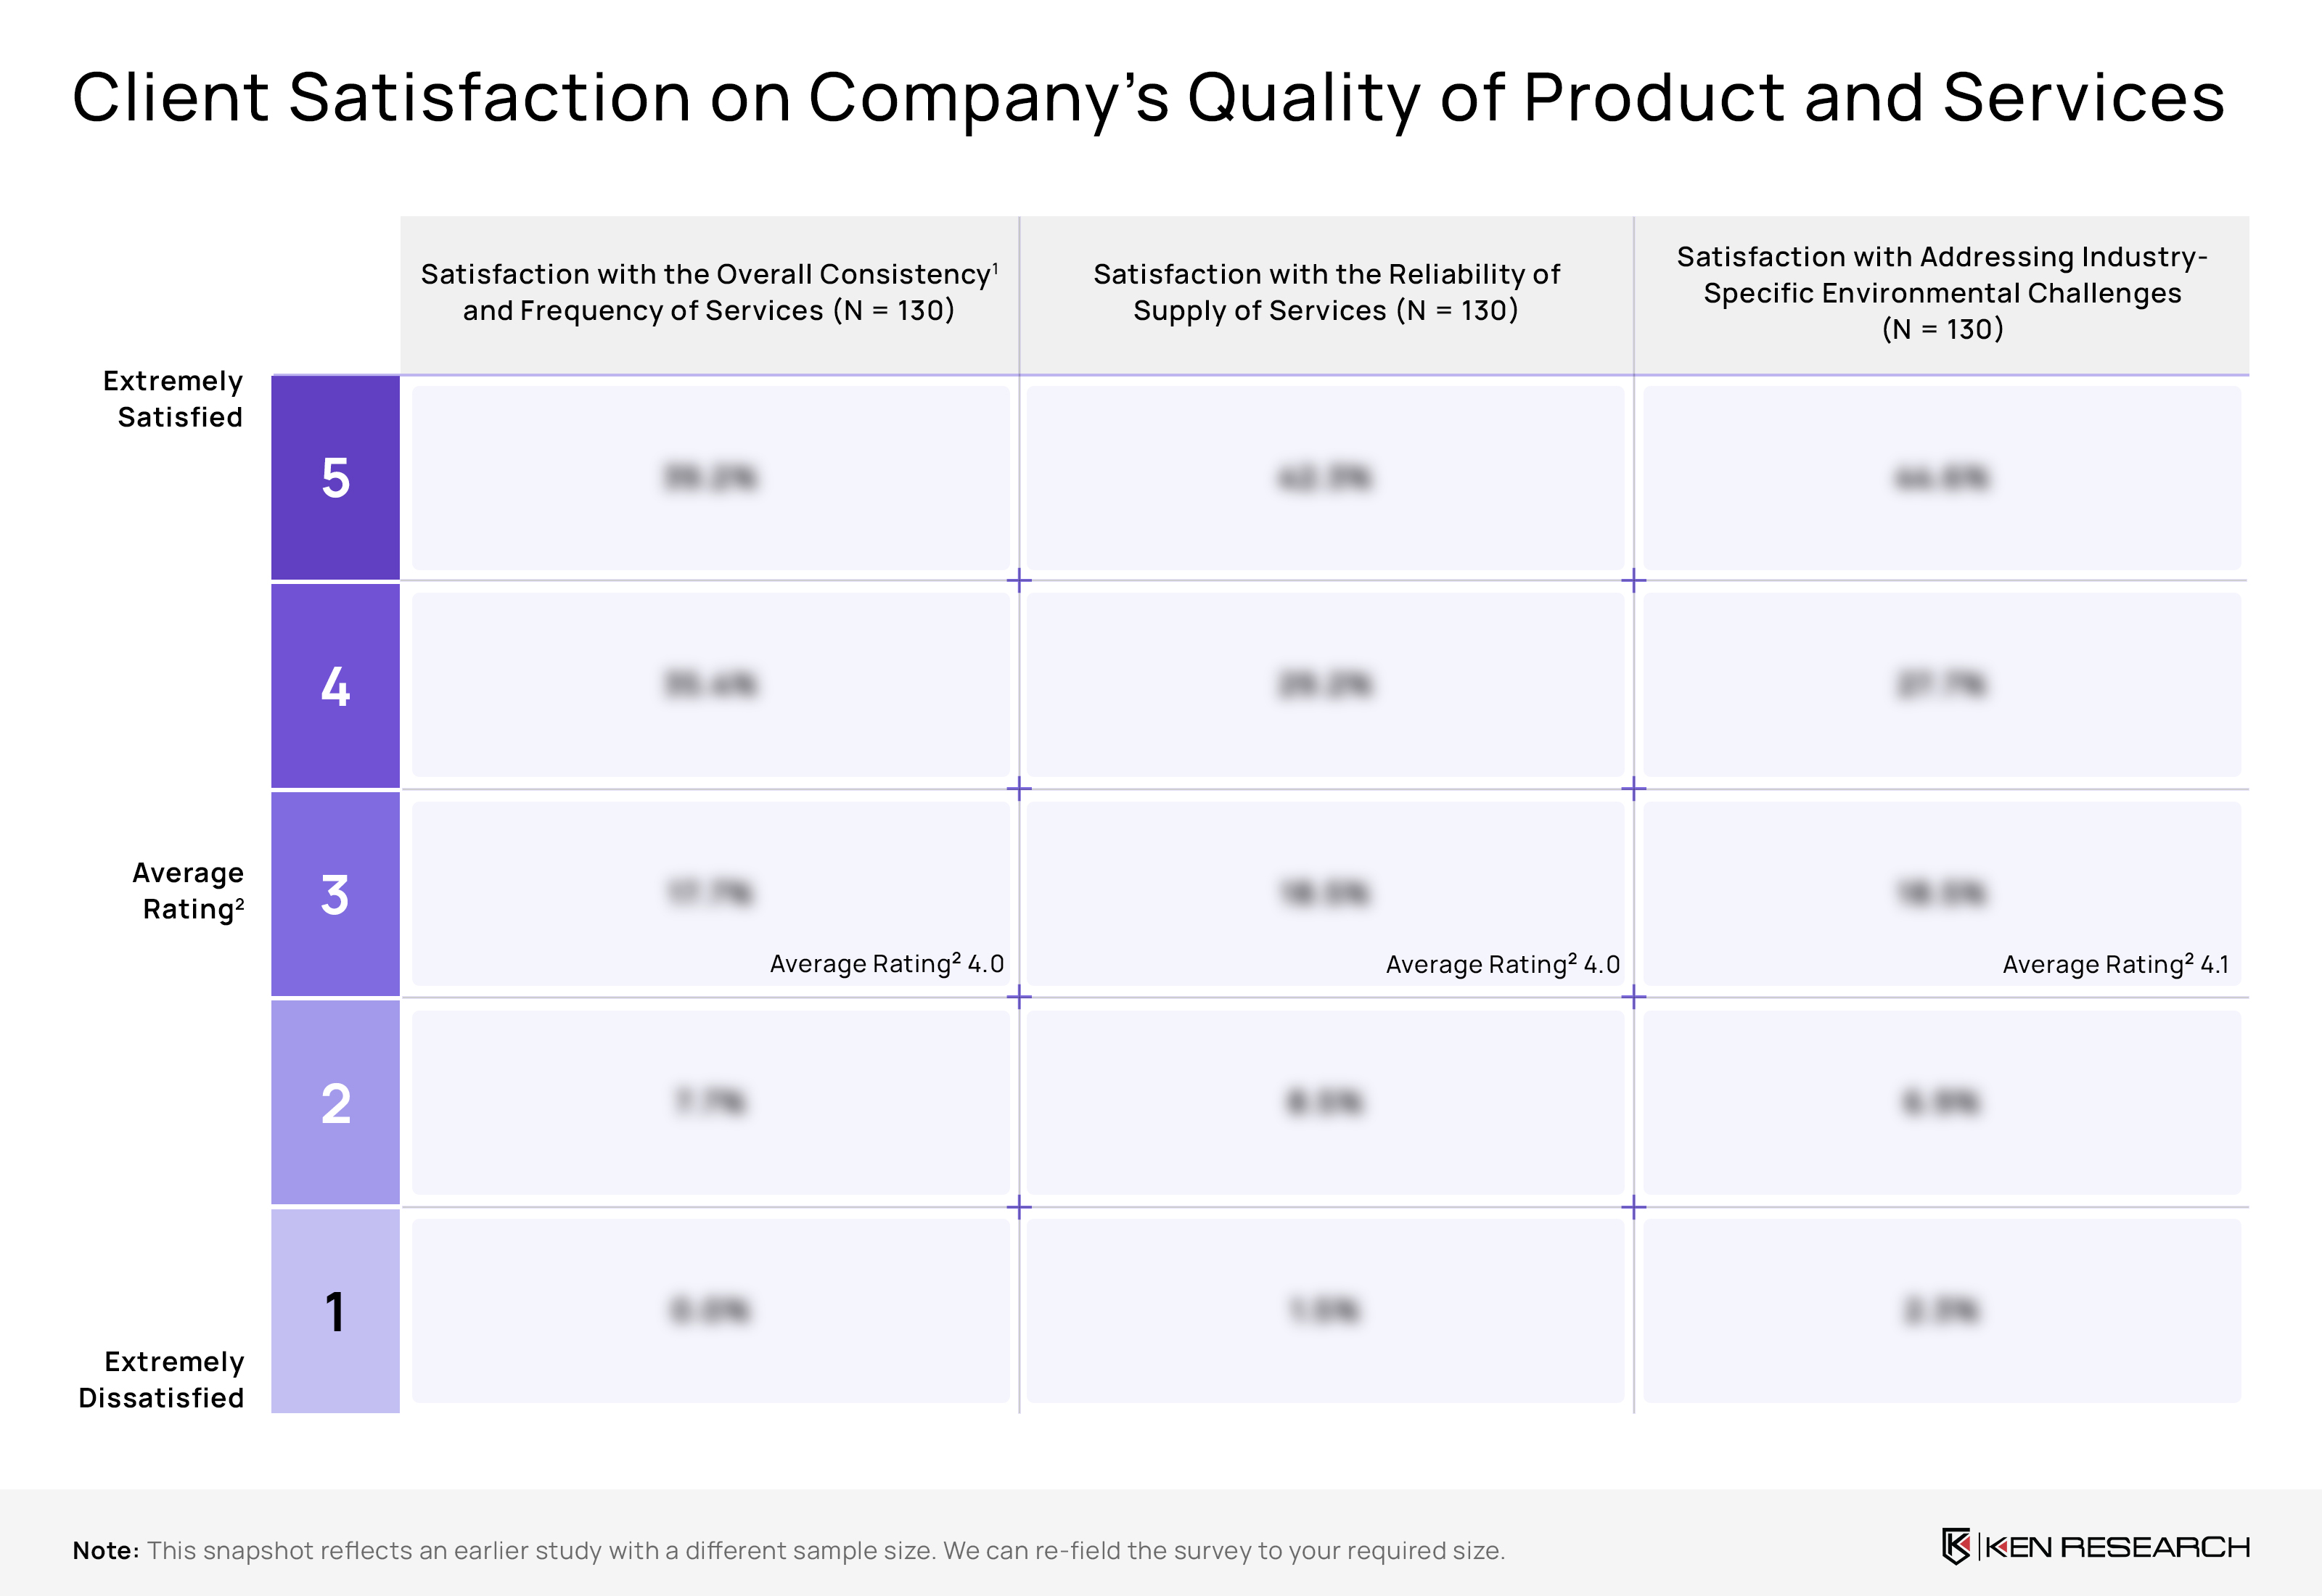
Client Satisfaction on Company’s Quality of Product and Services
Day-to-day service consistency rated strong by clients
Clients rate day-to-day consistency and service frequency highly, averaging roughly 4.1/5, with nearly 39% in the top box. Keep reinforcing predictable schedules, clear SLAs, and proactive notifications so multi-site operations stay confident in cadence, pickups, and performance across regions and contract models.
Supply reliability perceived dependable across operations and sites
Assurance on timely supply looks solid, with sentiment averaging approximately 4.0/5 and about 42% “extremely satisfied.” Double-down on contingency capacity, alternate routing, and disruption alerts so procurement and plant teams experience minimal downtime during peaks, audits, or weather-related constraints.
Environmental challenges consistently addressed effectively by provider
Customers perceive strong capability in addressing sector-specific environmental issues. Convert this trust into standardized playbooks, faster issue triage, and demonstrable outcomes—like smoother inspections, better recyclate quality, and fewer exception tickets—to deepen executive sponsorship and justify premium positioning in complex compliance contexts.
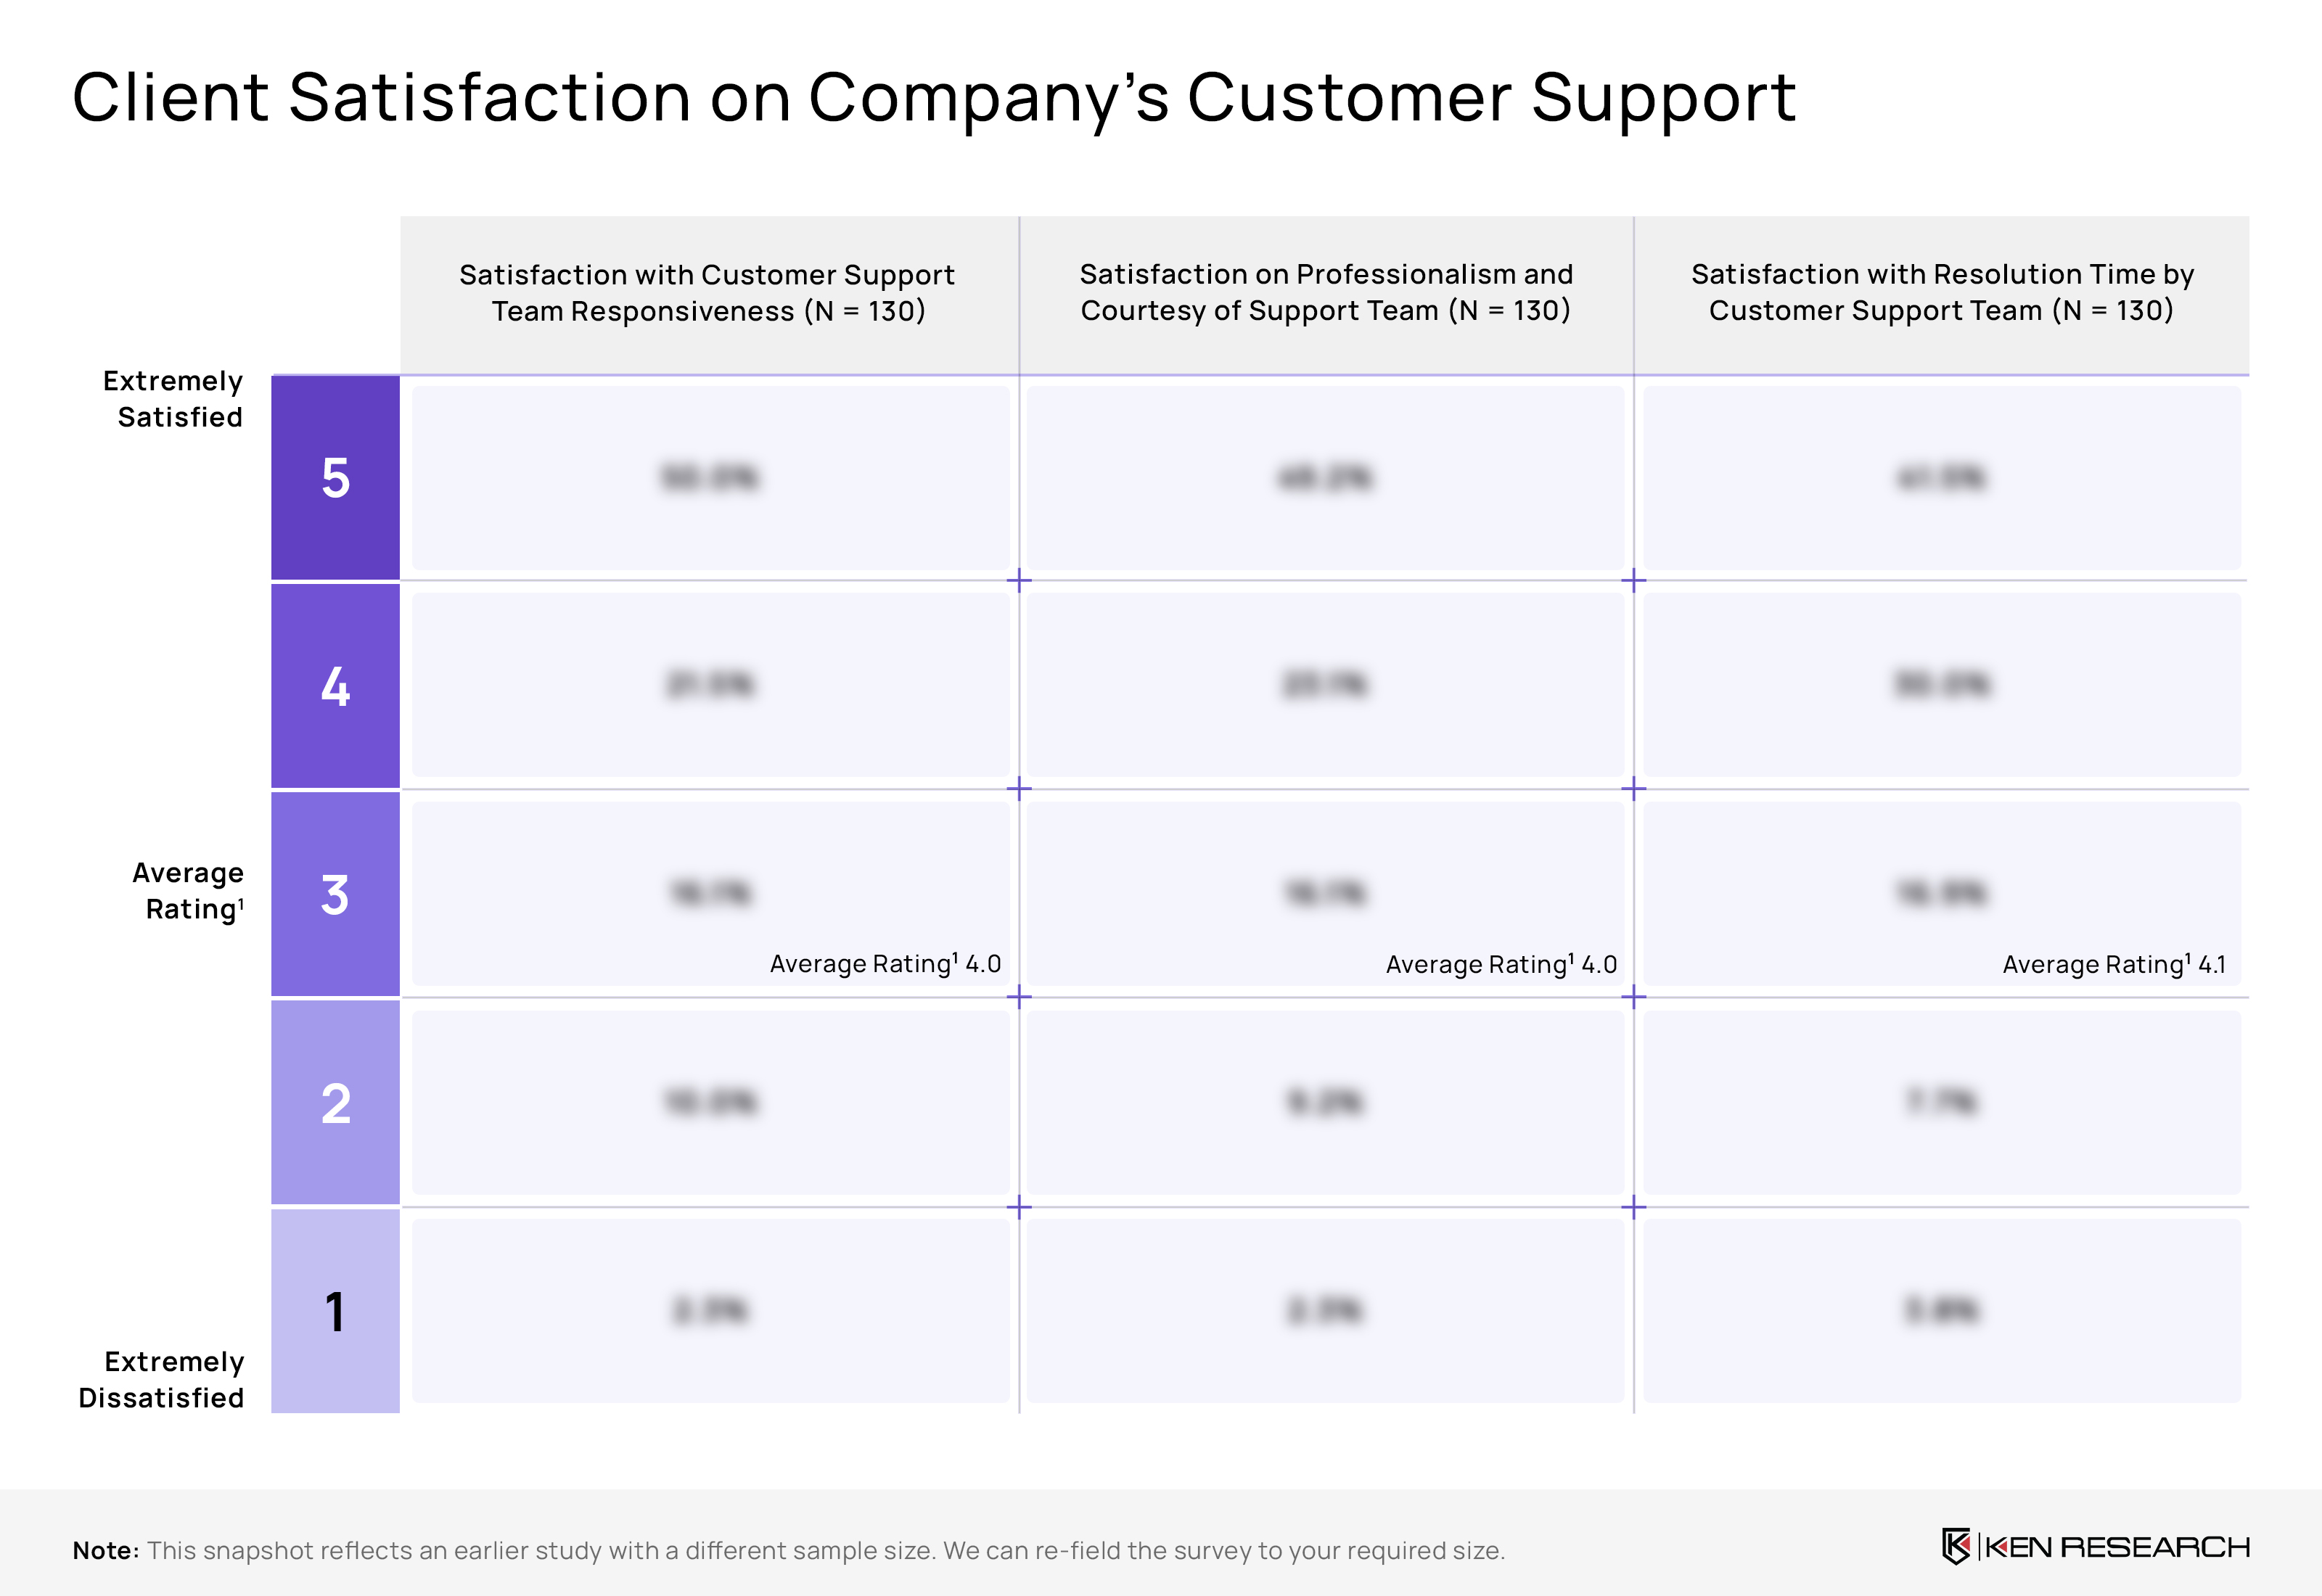
Client Satisfaction on Company’s Customer Support
Support responsiveness is fast, dependable, and consistent across requests
Clients experience fast, dependable first responses from the support team. The average satisfaction is around 4.1/5, with roughly 50% marking “extremely satisfied” and about 22% selecting the next tier, indicating a strong top-box skew and minimal dissatisfaction across incoming requests and day-to-day service interactions.
Communication is respectful, clear, and context-aware across channels
Communication quality is described as consistently respectful and clear. Agents demonstrate good context recall, close the loop on queries, and maintain a helpful tone across channels. These qualities contribute to steady mid-to-high satisfaction, signaling that users feel heard, guided, and professionally managed during troubleshooting and routine coordination.
Issue resolution times are predictable with minimal escalation friction
Customers perceive closure speed as reliable rather than variable. Handoffs are limited, and cases typically progress without prolonged idle periods. The overall pattern suggests predictable turnaround, confidence in queue management, and limited escalation friction, supporting a view that resolution timelines align with operational expectations for business-critical activities.
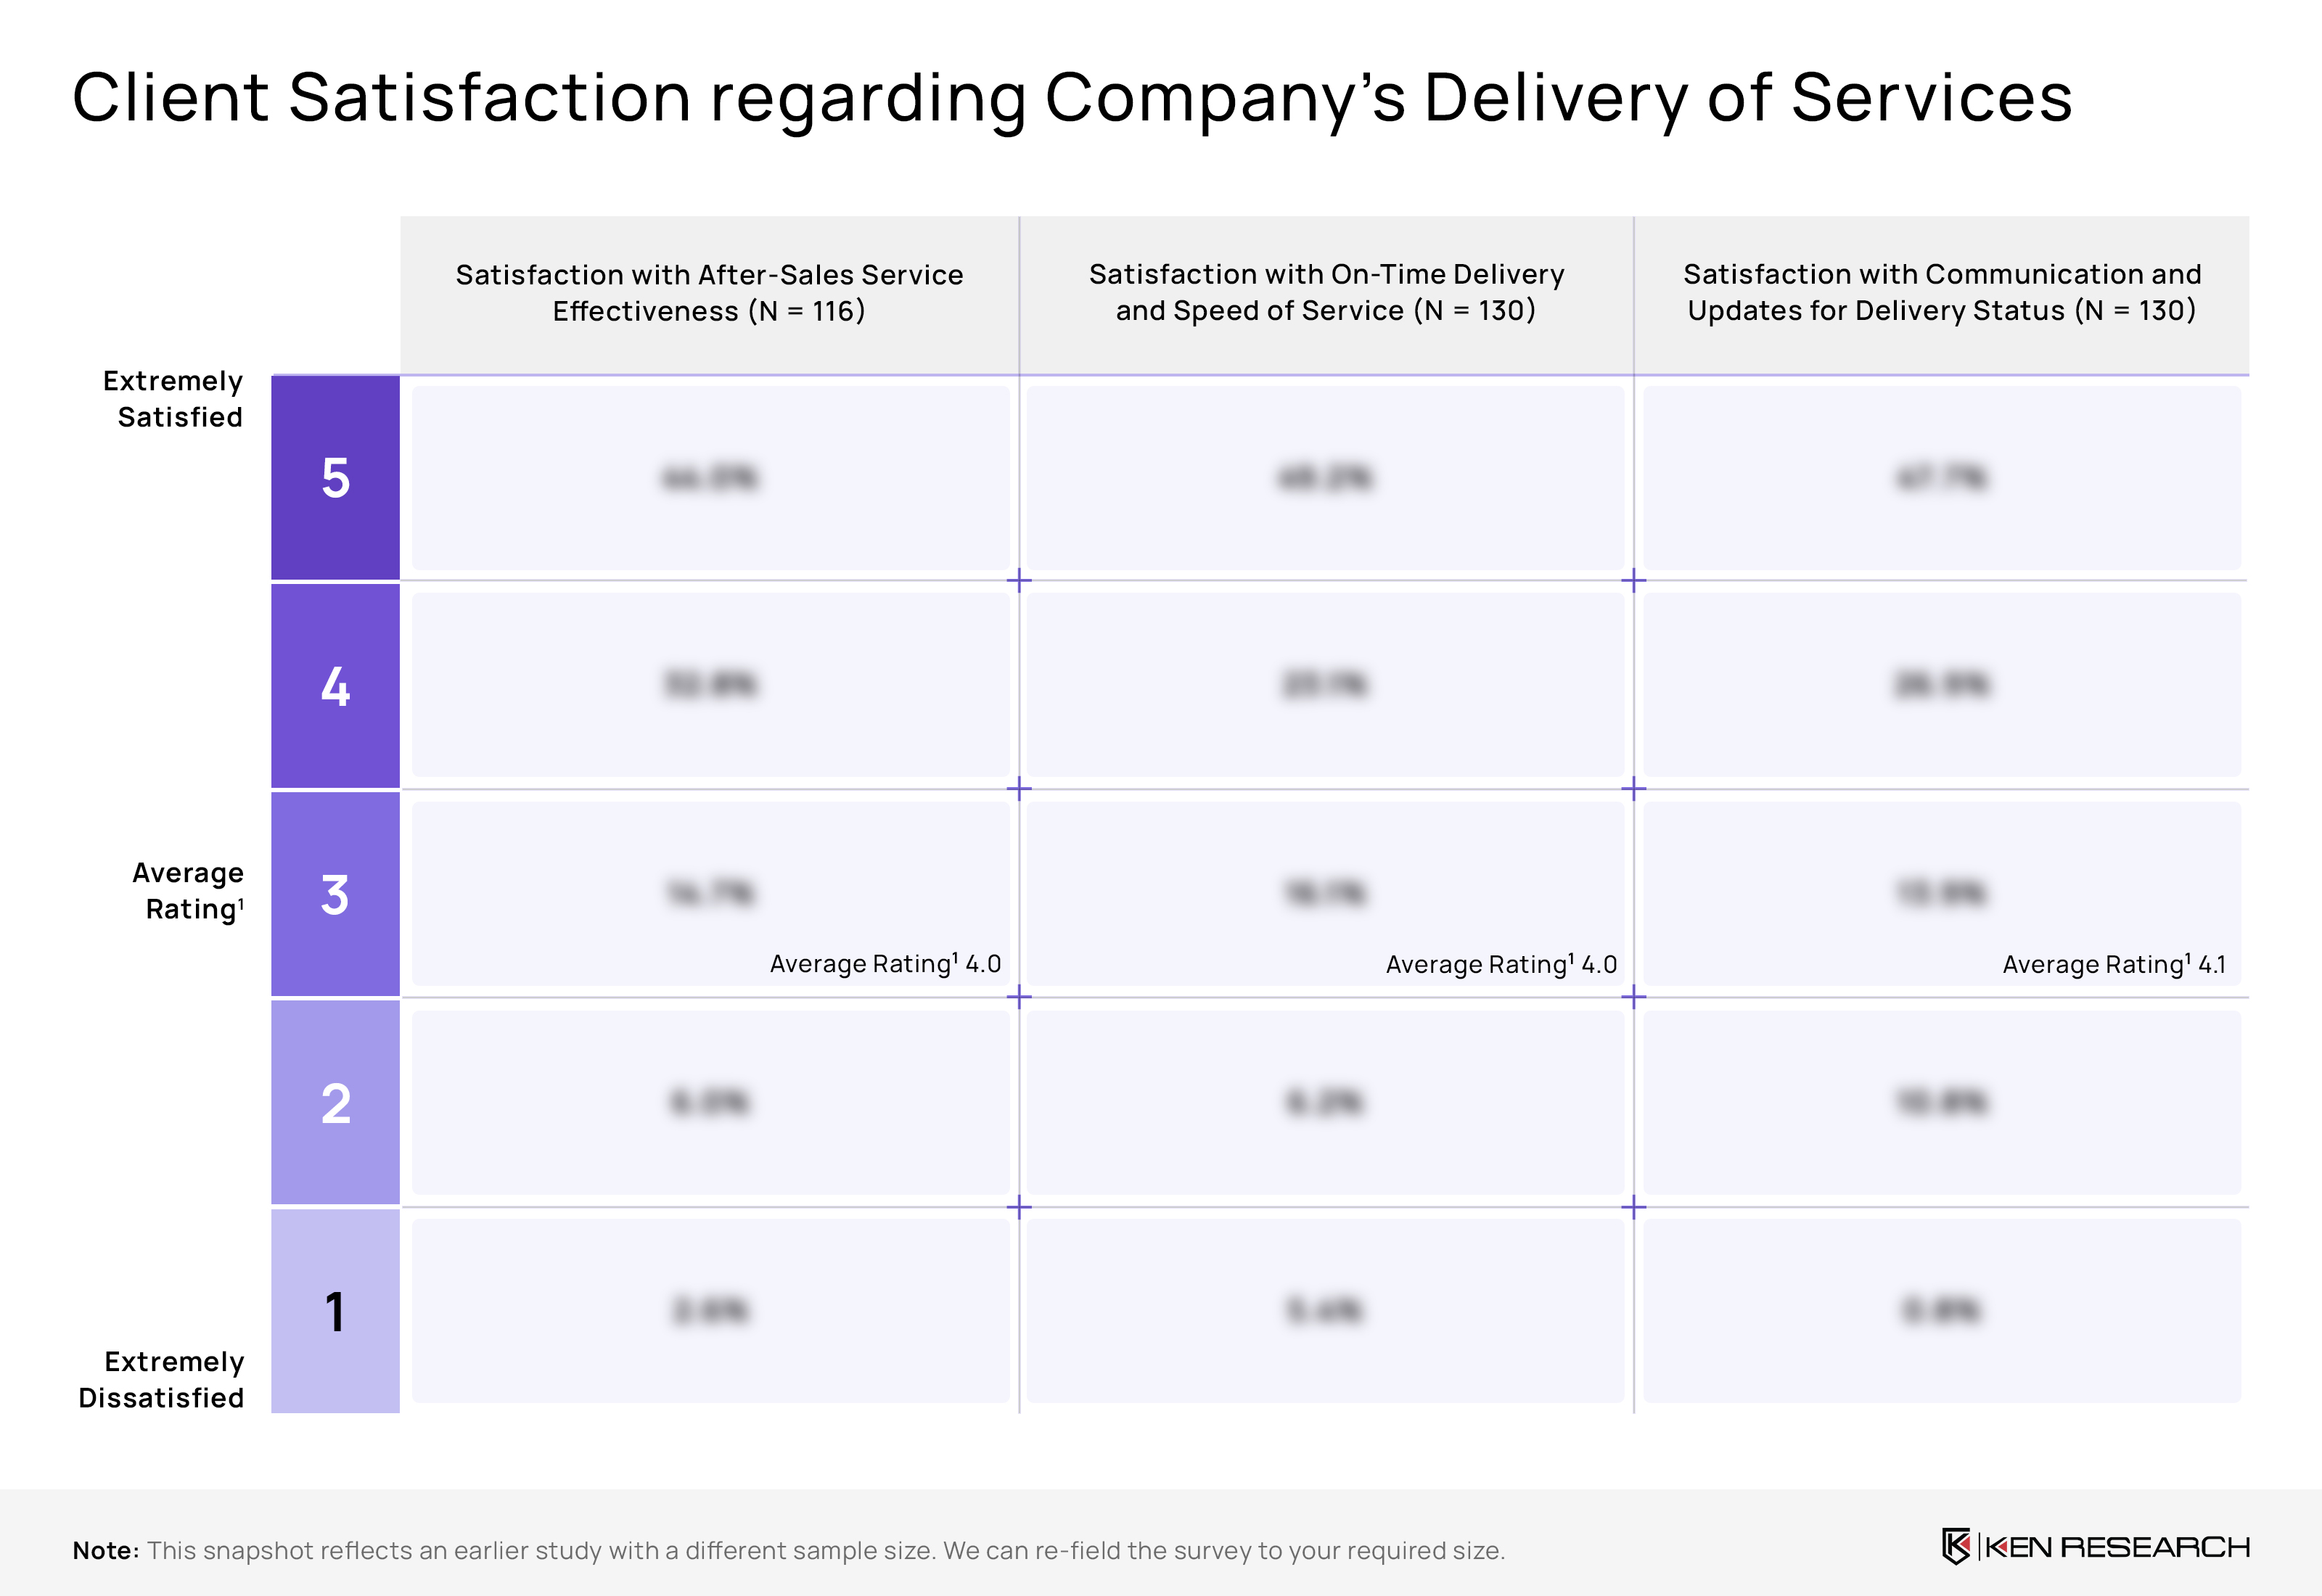
Client Satisfaction regarding Company’s Delivery of Services
After-sales support is strong with dependable post-service handling
Post-delivery support performs strongly. Roughly 44% of customers are “extremely satisfied” and around 33% choose the next tier, yielding an average near 4.1/5. This top-box skew suggests dependable case handling, clear ownership after handover, and low friction when scheduling visits or arranging corrective work.
On-time delivery is predictable with minimal scheduling disruption
Delivery timeliness is viewed as predictable rather than variable. Customers report consistent slot adherence, minimal rescheduling, and reasonable cycle times from request to drop-off/pick-up. The experience feels organized end-to-end, with logistics coordination and route planning supporting steady service momentum and limited disruption to plant operations or shift calendars.
Communication is transparent with timely dispatch and closure updates
Information flow is transparent. Nearly 48% mark “extremely satisfied,” and about 27% select the next tier, with an average roughly 4.1/5. Regular notifications on dispatch, in-transit progress, and closure confirmations reduce uncertainty, enabling customers to plan crews and permits while keeping internal stakeholders aligned on service milestones.
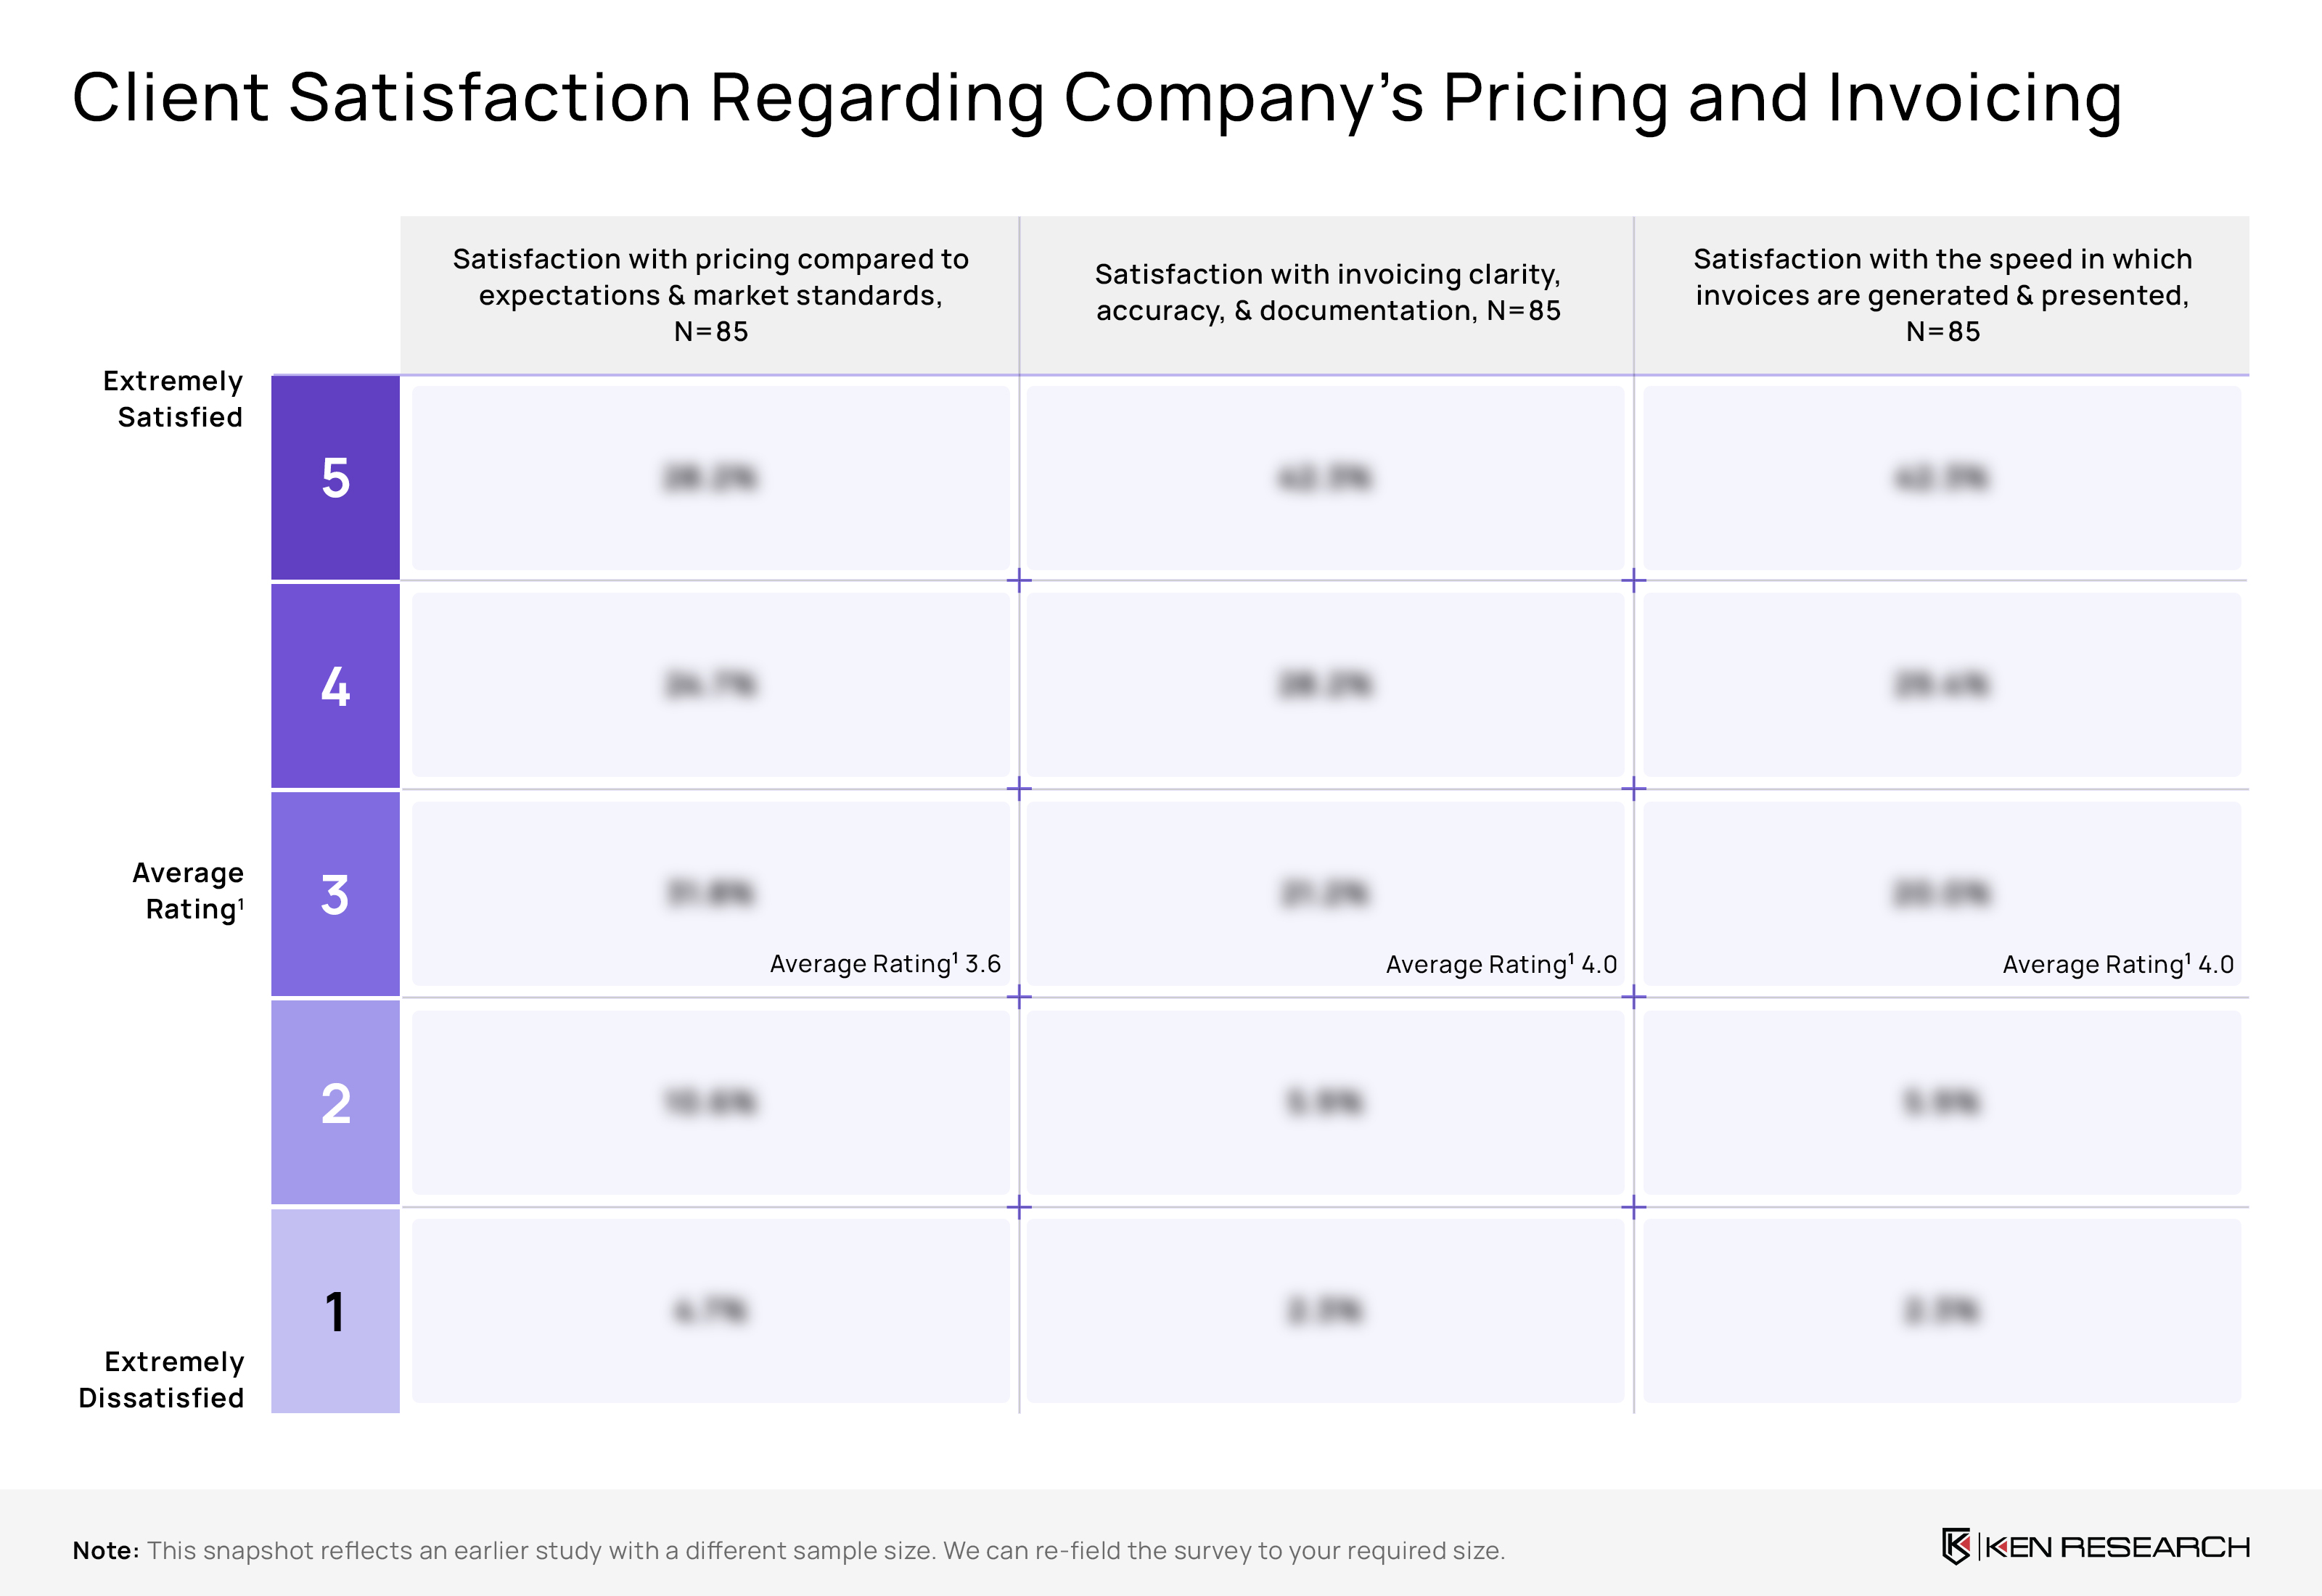
Client Satisfaction Regarding Company’s Pricing and Invoicing
Pricing is seen fair but not clearly differentiated
Pricing perception is solid but not distinctive. The average satisfaction sits at around 3.6/5, suggesting customers see fair value yet still compare closely to market alternatives. The neutral middle remains sizable, indicating price narratives and total-cost explanations could be sharpened for multi-site or volume-driven engagements.
Invoices are clear, accurate, and easy to reconcile
Invoice accuracy and documentation quality are described as reliable and easy to reconcile. Consistent formats, clear line items, and clean tax treatment reduce back-and-forth and speed approvals. This points to disciplined back-office controls and smooth coordination between service delivery, finance teams, and client approvers.
Invoicing is timely, supporting smooth approvals and cash-flow planning
Billing timeliness is a strong suit. Nearly 42% of customers report being extremely satisfied with how quickly invoices are generated after service completion. Prompt turnaround shortens reconciliation cycles, helps clients close books on time, and supports predictable cash-flow planning without creating administrative friction.
Client Satisfaction Regarding Company’s Overall Experience
Overall experience is smooth with low operational friction
Customers report a consistently strong day-to-day experience and low operational friction, sign-ups, scheduling, and coordination feel smooth and predictable. Satisfaction clusters at the top end, with nearly 45% reporting “extremely satisfied” for both overall experience and ease of doing business, and average scores hovering around 4.1/5.
Brand reputation is strong, trusted for complex service needs
The brand is viewed as reliable and responsible, reflecting steady delivery, compliance confidence, and dependable stakeholder handling. Feedback suggests clients are comfortable recommending the provider for complex service needs, indicating durable trust and relationship stability that extends beyond transactions into longer-term partnership value.
Net Promoter Score for the Company
The Net Promoter Score profile points to a healthy brand reputation. Promoters clearly outweigh detractors, signaling strong loyalty, positive word-of-mouth momentum, and a high likelihood of renewal and cross-sell receptivity across waste management and related services.
At the same time, a meaningful passive segment remains. Converting these neutral customers, through clearer value articulation, consistent delivery experiences, and sharper communication can lift overall advocacy while containing churn risk by addressing the small but vocal detractor cohort.
Strategic Recommendations
Ken Research delivered clear, execution-focused recommendations to the waste management client based on our survey. Here are some amongst all stated to the client:
-
Pricing & Terms: Recalibrate quotes, introduce transparent discounting, and link compensation to service outcomes and market norms.
-
Operational Speed: Shorten manifest/certificate turnaround, tighten on-time service SLAs, and simplify site access and safety workflows.
-
Portfolio Growth: Broaden waste streams and sustainable handling options; pilot selective free collection/recycling for eligible by-products.
Table of Contents
Table of Contents
1. Executive Summary
1.1 Objective of the Study
1.2 Survey Methodology Overview
1.3 Key Findings and Insights
1.4 Strategic Implications for the Client
2. Survey Overview
2.1 Background and Context
2.2 Survey Objectives and Scope
2.3 Target Audience and Sample Profile
2.4 Survey Instrument and Data Collection Process
2.5 Evaluation Parameters and Metrics
3. Brand Awareness
3.1 Customer Awareness Levels
3.1.1 Overall Awareness and Recognition (71% Aware, 29% Unaware)
3.1.2 Gaps Across Regions and Stakeholder Groups
3.2 Understanding of the Initiative
3.2.1 Perceived Purpose and Value Proposition
3.2.2 Positioning as a Multi-Benefit Solution
3.2.3 Recommended Communication Enhancements
4. Customer Engagement on Waste Management Services
4.1 Primary Service Usage Patterns
4.1.1 Waste Management as a Recurring Core Service (58%)
4.1.2 Engagement Depth and Contract Nature
4.2 Service Preferences and Bundling
4.2.1 Combined Handling of Hazardous and Non-Hazardous Waste (57%)
4.2.2 Operational and Compliance Advantages of Unified Handling
4.3 By-Product Recycling and Value Recovery
4.3.1 Adoption of By-Product Services
4.3.2 Opportunities for Value Capture through Recovery and Resale
5. Client Satisfaction on Product and Service Quality
5.1 Day-to-Day Service Consistency
5.1.1 Overall Satisfaction Ratings (Avg. 4.1/5; 39% Top Box)
5.1.2 Predictability and SLA Adherence
5.2 Supply Reliability
5.2.1 On-Time Service Delivery (Avg. 4.0/5; 42% Extremely Satisfied)
5.2.2 Contingency Planning and Disruption Management
5.3 Environmental Issue Handling
5.3.1 Client Perception of Environmental Performance
5.3.2 Playbooks, Triage Speed, and Compliance Readiness
6. Client Satisfaction on Customer Support
6.1 Responsiveness and Dependability
6.1.1 First-Response Speed and Quality (Avg. 4.1/5; 50% Top Box)
6.2 Communication Quality
6.2.1 Clarity, Respectfulness, and Context Recall
6.2.2 Multi-Channel Coordination and Professionalism
6.3 Issue Resolution Efficiency
6.3.1 Predictable Resolution Timelines
6.3.2 Minimal Escalation Friction and Queue Management
7. Client Satisfaction on Delivery of Services
7.1 After-Sales Support
7.1.1 Post-Service Handling (Avg. 4.1/5; 44% Extremely Satisfied)
7.2 Delivery Timeliness
7.2.1 Predictability and Slot Adherence
7.2.2 Route Optimization and Scheduling Coordination
7.3 Communication During Delivery
7.3.1 Dispatch Updates and Closure Confirmations
7.3.2 Transparency and Stakeholder Alignment
8. Client Satisfaction on Pricing and Invoicing
8.1 Pricing Perception
8.1.1 Fairness vs Differentiation (Avg. 3.6/5)
8.1.2 Price Communication and Value Narrative
8.2 Invoice Accuracy and Clarity
8.2.1 Documentation Quality and Line-Item Transparency
8.2.2 Ease of Reconciliation and Approval
8.3 Billing Timeliness
8.3.1 Post-Service Invoice Generation Speed
8.3.2 Impact on Client Cash Flow and Planning
9. Client Satisfaction on Overall Experience
9.1 Ease of Doing Business
9.1.1 Overall Satisfaction (Avg. 4.1/5; 45% Extremely Satisfied)
9.1.2 Low Operational Friction and Predictable Coordination
9.2 Brand Trust and Reputation
9.2.1 Reliability in Complex Service Needs
9.2.2 Recommendation Readiness and Long-Term Relationship Value
10. Net Promoter Score (NPS) Analysis
10.1 NPS Profile Overview
10.1.1 Promoter, Passive, and Detractor Segments
10.2 Loyalty and Advocacy Trends
10.2.1 Renewal Intent and Cross-Sell Potential
10.2.2 Strategies to Convert Passives and Reduce Detractors
11. Strategic Recommendations
11.1 Pricing and Terms Optimization
11.2 Operational Speed and SLA Enhancement
11.3 Portfolio Expansion and Sustainability Offerings
11.4 Customer Experience and Retention Strategies
12. Research Methodology
12.1 Questionnaire Finalization and Objective Alignment
12.2 Pre-Testing and Refinement
12.3 Platform Hosting and Survey Administration
12.4 Team Formation and Execution Protocols
12.5 Respondent Mapping and Targeting
12.6 Fieldwork Monitoring and Quality Control
12.7 Data Cleaning, Validation, and Analysis
12.8 Insight Synthesis and Client Presentation
Research Methodology
Steps Involved in Conducting Survey
Questionnaire Finalization- Freeze the survey instrument and align on objectives, constructs, and metrics.
Pre-testing- Pilot the questionnaire to check flow, clarity, and timing; refine based on feedback.
Hosting on Platform- Launch the finalized questionnaire on our secure digital survey platform.
Team Formation & Briefing- Assemble and brief the Research Execution Team for survey administration.
Respondent Mapping- Identify and shortlist relevant respondents (based on client inputs and targeting).
Fieldwork & Quality Control- Conduct the survey and continuously monitor response quality.

Data Cleaning & Analysis- Clean, validate, and analyze data; conclude with presentation of findings.
Why Buy From Us?
 Framework")
What makes us stand out is that our consultants follows Robust, Refine and Result (RRR) methodology. i.e. Robust for clear definitions, approaches and sanity checking, Refine for differentiating respondents facts and opinions and Result for presenting data with story

We have set a benchmark in the industry by offering our clients with syndicated and customized market research reports featuring coverage of entire market as well as meticulous research and analyst insights.

While we don't replace traditional research, we flip the method upside down. Our dual approach of Top Bottom & Bottom Top ensures quality deliverable by not just verifying company fundamentals but also looking at the sector and macroeconomic factors.

With one step in the future, our research team constantly tries to show you the bigger picture. We help with some of the tough questions you may encounter along the way: How is the industry positioned? Best marketing channel? KPI's of competitors? By aligning every element, we help maximize success.

Our report gives you instant access to the answers and sources that other companies might choose to hide. We elaborate each steps of research methodology we have used and showcase you the sample size to earn your trust.

If you need any support, we are here! We pride ourselves on universe strength, data quality, and quick, friendly, and professional service.