CHAPTER 1 - MARKET SUMMARY
Market Overview
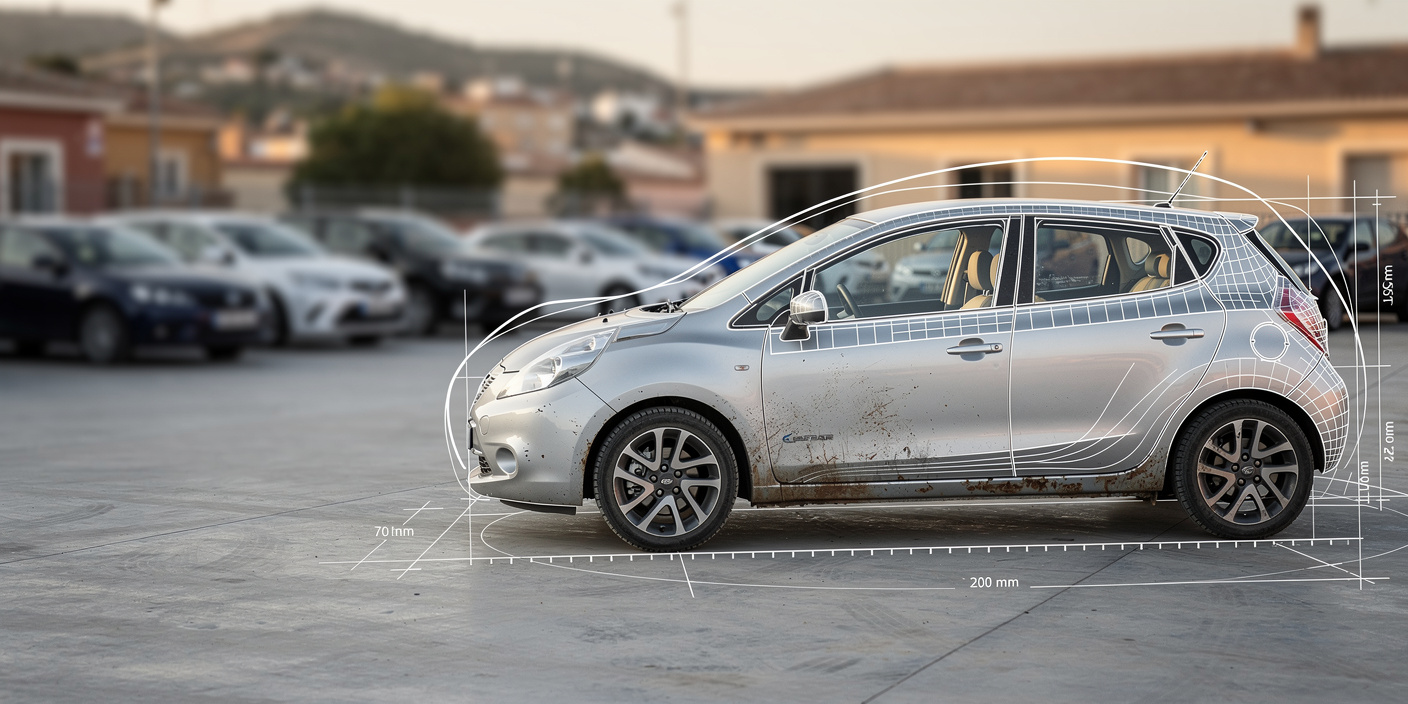
The Data Points for Spain Used Car Market operates through private transfers, independent retailers, authorized dealer programs, digital retailers, fleet remarketing companies, and auctions. Approximately 2.219 million used passenger cars changed ownership during 2025, representing around 1.9 used vehicles for each new passenger car registered. This demand structure makes affordability, vehicle availability, financing access, and immediate delivery central purchasing considerations.
Andalusia was the largest autonomous-community market during 2025, with approximately 410,084 used-car transactions. Andalusia, Catalonia, Madrid, and the Valencian Community collectively represent the principal sourcing, refurbishment, finance, and retail corridors. Their concentration supports larger inventory pools, faster stock rotation, denser dealership networks, and lower inter-regional logistics costs, strengthening the economics of scaled multi-location operators.
Market Value
USD 44,523 million
2025
Dominant Region
Andalusia
2025
Dominant Segment
Diesel Vehicles within Powertrain
largest volume segment, 2025
Total Number of Players
15,800
Future Outlook
The Data Points for Spain Used Car Market is projected to increase from USD 44,523 million in 2025 to USD 56,883 million by 2031, representing a forecast CAGR of 4.2%. Growth will be supported by transaction volumes rising from 2.219 million to approximately 2.500 million units, moderate price inflation, and a greater proportion of younger, professionally refurbished vehicles. The historical value CAGR of 9.1% during 2020-2025 reflected post-pandemic price normalization, restricted new-car availability, currency effects, and stronger consumer preference for immediately available vehicles relative to higher-priced new alternatives.
Forecast growth is expected to become more balanced between volume and mix. Used-car transaction volume is projected to expand at approximately 2.0% annually, while average transaction values rise as hybrid, plug-in hybrid, battery-electric, sport utility, and certified vehicles capture more listings. Electrified vehicles are projected to account for approximately 10.6% of used-car transactions by 2030 and 12.5% by 2031, compared with 3.3% in 2025. Investors should prioritize scalable procurement, battery-health certification, digital pricing, consumer finance attachment, refurbishment efficiency, and inventory rotation rather than relying exclusively on headline transaction growth.
4.2%
Forecast CAGR
USD 56,883 Mn
2030 Projection
Base Year
2025
Historical Period
2020-2025
Forecast Period
2026-2031
Historical CAGR
9.1%
CHAPTER 2 - SCOPE OF REPORT
Scope of the Market
CHAPTER 3 - Key Stakeholders
Key Target Audience
Key stakeholders who can leverage from this market analysis for investment, strategy, and operational planning.
Investors
transaction CAGR, inventory turns, unit margins, residual risk
Corporates
fleet disposal, procurement cost, remarketing, vehicle lifecycle
Government
fleet renewal, emissions compliance, safety, urban access
Operators
sourcing, refurbishment, pricing, finance attachment, warranty claims
Financial institutions
credit quality, collateral values, defaults, recoveries, pricing
CHAPTER 4 - Market Size & Growth
Market Size, Growth Forecast and Trends
This section evaluates the historical market size, analyzes year-over-year growth dynamics, and presents forecast projections supported by market performance indicators and demand-side drivers.
Historical & Projected Market Size ($ Million)
Year-over-Year Growth Rate (%)
Market Value vs Volume Growth (%)
Historical Market Performance (2020-2025)
Market value increased from USD 28,798 million in 2020 to USD 44,523 million in 2025. The strongest annual value expansion occurred in 2025 at 16.3%, reflecting higher transaction volume, firmer euro-denominated prices, and currency conversion effects. Transaction volume reached its period trough in 2022 at 1.886 million units as shortages reduced availability of younger vehicles. The principal inflection occurred during 2024, when transaction volume expanded 9.0% and returned above two million units, although lower average prices moderated value growth to 4.1%.
Forecast Market Outlook (2026-2031)
Market value is projected to grow at a 4.2% CAGR from 2025 to 2031, reaching USD 56,883 million. Transaction volume is expected to rise to approximately 2.500 million units, while the average transaction price reaches USD 22,755. Growth is expected to accelerate gradually after a supply-constrained 2026 as more vehicles registered after the semiconductor shortage enter remarketing channels. Electrified used-car penetration is projected to rise to 12.5% by 2031, supporting higher refurbishment, diagnostic, warranty, finance, and battery-certification revenue per transaction.
CHAPTER 5 - Market Data
Market Breakdown
The Data Points for Spain Used Car Market is transitioning from an age-heavy private-transfer structure toward a more professionally intermediated market. Value creation will increasingly depend on inventory sourcing, refurbishment throughput, financing penetration, warranty attachment, and the management of powertrain-specific residual-value risk.
Year | Market Size (USD Mn) | YoY Growth (%) | Transactions (Mn Units) | Average Transaction Price (USD) | Electrified Used-Car Share (%) | Period |
|---|---|---|---|---|---|---|
| 2020 | $28,798 Mn | +- | 1.963 | 14,670 | Forecast | |
| 2021 | $33,327 Mn | +15.7% | 1.990 | 16,750 | Forecast | |
| 2022 | $34,694 Mn | +4.1% | 1.886 | 18,400 | Forecast | |
| 2023 | $36,772 Mn | +6.0% | 1.940 | 18,950 | Forecast | |
| 2024 | $38,271 Mn | +4.1% | 2.114 | 18,100 | Forecast | |
| 2025 | $44,523 Mn | +16.3% | 2.219 | 20,066 | Forecast | |
| 2026 | $45,683 Mn | +2.6% | 2.239 | 20,405 | Forecast | |
| 2027 | $47,622 Mn | +4.2% | 2.286 | 20,834 | Forecast | |
| 2028 | $49,691 Mn | +4.3% | 2.335 | 21,282 | Forecast | |
| 2029 | $51,935 Mn | +4.5% | 2.389 | 21,743 | Forecast | |
| 2030 | $54,353 Mn | +4.7% | 2.444 | 22,243 | Forecast | |
| 2031 | $56,883 Mn | +4.7% | 2.500 | 22,755 | Forecast |
Transactions
1.190 million units, first half 2026, Spain. Transaction growth confirms underlying liquidity despite monthly volatility. Younger vehicles between one and five years are becoming more attractive because they balance price, remaining life, emissions access, and financing eligibility. Supporting statistic: first-half transactions increased 3.2%.
Average Transaction Price
USD 20,066 per vehicle, 2025, Spain. Price realization determines dealer gross profit, finance ticket size, and inventory capital requirements. The average local-currency offer price increased 6.1% during 2025, while new-car prices remained materially above used-car alternatives.
Electrified Used-Car Share
4.5%, 2026 forecast, Spain. Electrified inventory remains small but offers faster unit growth and new service revenues. Used battery-electric and plug-in hybrid transactions were expected to grow approximately 30% during 2026, while their combined share could reach 10.6% by 2030.
CHAPTER 6 - Segmentation
Market Segmentation Framework
Comprehensive analysis across key dimensions providing insights into market structure, consumer preferences, and distribution patterns.
No of Segments
7
Dominant Segment
Powertrain
Fastest Growing Segment
Sales Channel
Vehicle Type
Customer Type
Sales Channel
Powertrain
Usage Type
Price Tier
Geography
Key Segmentation Takeaways
Comprehensive analysis across all extracted segmentation dimensions providing insights into market structure, consumer preferences, and distribution patterns.
Powertrain
Diesel remains the leading used-car powertrain because the available fleet reflects many years of diesel-heavy new registrations. Its broad supply, long-distance efficiency, repair familiarity, and lower acquisition cost sustain liquidity, particularly outside restricted urban centers. However, Euro 6 diesel units increasingly command a valuation advantage over older vehicles affected by environmental access constraints.
Sales Channel
Digital-first retailers and marketplaces represent the fastest-changing market dimension as consumers adopt remote appraisal, finance pre-approval, home delivery, and online inventory comparison. The strongest model combines digital customer acquisition with physical inspection, reconditioning, logistics, and warranty execution. Operators that own inventory can capture retail margin, finance commission, insurance attachment, and trade-in sourcing value.
CHAPTER 7 - Regional Analysis
Regional Analysis
Spain ranked fourth by estimated used-car gross transaction value among the selected Western and Southern European peer markets in 2025. Its market is smaller than Germany, France, and Italy, but benefits from an older vehicle fleet, sustained affordability demand, growing professional retail networks, and faster electrified used-car penetration. retail networks, and faster
Focus Country Ranking
4th
Spain Market Size (2025)
USD 44.5 Bn
Spain CAGR (2026-2031)
4.2%
Focus Country Ranking
4th
Spain Market Size (2025)
USD 44.5 Bn
Spain CAGR (2026-2031)
4.2%
Regional Analysis (Current Year)
Market Position
Spain ranked fourth among the five peer markets, with estimated 2025 gross transaction value of USD 44.5 billion and 2.219 million transactions, supported by persistent replacement demand.
Growth Advantage
Spain's projected 4.2% CAGR exceeds Germany's 3.2% and France's 3.6%, reflecting professionalization, import growth, higher electrified supply, and continued affordability-driven substitution from new vehicles.
Competitive Strengths
Spain combines a 14.5-year vehicle age, 172,504 used imports, and dense dealer corridors, creating substantial sourcing, refurbishment, finance, warranty, replacement, and fleet-renewal demand.
CHAPTER 8 - INDUSTRY ANALYSIS
Table of Contents
Comprehensive analysis of key factors shaping the Data Points for Spain Used Car Market, including growth catalysts, operational challenges, and emerging opportunities across production, distribution, and consumer segments.
Growth Drivers
Used-Car Affordability Relative to New Vehicles
- Average new-car prices increased approximately 38.1% between 2019 and 2025 (Spain), widening the acquisition-cost gap and redirecting budget-sensitive households toward used vehicles with lower monthly finance payments.
- The market recorded approximately 1.9 used transactions per new passenger car (2025, Spain), giving retailers and lenders a customer pool substantially larger than the new-car channel.
- Approximately 58% of prospective young-used buyers planned budgets below EUR 15,000 (2025, Spain), favoring operators with efficient refurbishment and finance structures for lower-ticket inventory.
Aging Vehicle Fleet and Replacement Requirement
- Vehicles older than ten years represented approximately 57.3% of used transactions (2025, Spain), demonstrating deep demand for low-cost mobility while creating a large future replacement pool.
- Vehicles older than fifteen years represented approximately 41.4% of transactions (2025, Spain), increasing demand for inspection, repair, warranty, and vehicle-history services.
- Used vehicles between one and five years are expected to represent approximately 29% of transactions (2026 forecast, Spain), shifting profit pools toward younger, financeable, and higher-margin stock.
Professionalization of Used-Car Retail
- Flexicar reported more than 180 retail locations and 25,000 listed vehicles (2026, Spain), illustrating the operating leverage available from centralized procurement, marketing, and finance partnerships.
- Clicars expanded annual reconditioning capacity to approximately 30,000 vehicles (2025, Spain), demonstrating how refurbishment infrastructure can support standardized quality and faster throughput.
- More than 143,000 professional listings carried dealer-backed documentation or warranty attributes (2026, Spain), allowing professional sellers to monetize risk reduction relative to private transactions.
Market Challenges
Environmental Restrictions on Older Inventory
- Low-emission-zone requirements apply to municipalities above 50,000 residents (2023 onward, Spain), reducing the addressable urban buyer base for older non-compliant stock.
- Diesel vehicles retained approximately 49% of used-car transactions (2025, Spain), exposing a major portion of inventory to changing urban access rules and valuation discounts.
- Operators must incorporate emissions classification into acquisition pricing because vehicles lacking favorable labels can face narrower buyer pools, slower rotation, and higher transfer costs across multiple regulated urban markets (2025, Spain).
Shortage of Younger Used Vehicles
- Weak registrations during the semiconductor shortage reduced supply of vehicles now aged three to six years, supporting higher procurement prices and tighter dealer inventory during 2026 (Spain).
- Vehicles aged five to seven years are particularly attractive to corporate fleets because of their remaining life and price balance, increasing competition for a structurally limited 2026 supply pool (Spain).
- Restricted domestic stock contributed to a 28% increase in used imports during 2025 (Spain), raising logistics, inspection, registration, and foreign vehicle-history verification requirements.
Electrified Vehicle Residual-Value Risk
- The average used electric vehicle price declined to approximately EUR 31,471 in 2025 (Spain), improving affordability but creating potential losses for inventory acquired at earlier valuations.
- European battery-electric vehicles retained approximately 35% of original value after three years (2025, Europe), compared with about 50% for the broader market, increasing lease and finance provisioning requirements.
- Retailers require standardized battery-health reporting because range degradation, charging capability, warranty status, and model updates can cause material pricing differences within the same vehicle age cohort (2026, Spain).
Market Opportunities
Electrified Used-Car Retail and Battery Certification
- Used electrified vehicle sales were expected to grow approximately 30% in 2026 (Spain), supporting premium revenues from battery diagnostics, charging advice, warranty products, and home-charger referrals.
- Retailers, lenders, insurers, and fleet owners benefit when standardized battery certificates reduce uncertainty and enable more accurate pricing for approximately 4.5% of 2026 used transactions (Spain).
- Market development requires interoperable state-of-health testing, technician training, warranty underwriting, and consumer education before electrified penetration can rise from 3.3% in 2025 to double digits by 2030 (Spain).
Cross-Border Procurement and Import Services
- Import growth of 28% in 2025 (Spain) creates revenue opportunities in European sourcing, auction access, transport, inspection, homologation, registration, and tax administration.
- Scaled dealer groups and digital retailers benefit from cross-border procurement because broader sourcing can improve model availability, powertrain mix, purchase prices, and inventory turns across multiple European supply markets (2025).
- Opportunity realization requires stronger fraud prevention, mileage verification, maintenance-history access, emissions documentation, and standardized vehicle-condition grading for all imported units registered in Spain.
Certified Reconditioning and Embedded Finance
- Inventory-owning retailers can combine retail margin with finance commission, warranty income, trade-in sourcing, and insurance attachment across approximately 2.219 million annual transactions (2025, Spain).
- Consumers benefit from standardized inspections, legal guarantees, verified mileage, and return policies; professional sellers commonly provide at least one year of legal warranty (2025, Spain).
- Operators must invest in centralized refurbishment, digital pricing, credit decisioning, transport orchestration, and quality assurance to scale annual capacity toward benchmarks such as 30,000 reconditioned vehicles (2025).
Project Source Refer>V02 Market Size Calculator methodology: ?filecite?turn0fieport structure and generation controls: ?filecite?turn0file1? Key Assumptions The market lens is gross transaction value for used passenger cars and SUVs transferred in Spain, including professional and private transactions. New vehicles, motorcycles, heavy commercial vehicles, vehicle rentals, standalone repair revenue, insurance premiums, and financing principal are excluded. Market value equals transfer volume multiplied by an age-adjusted and channel-adjusted average transaction price converted into USD. Advertised prices were adjusted for negotiation, channel mix, private sales, vehicle age, and transaction realization. Historical currency conversion uses annual euro-to-dollar reference rates; forecast conversion is normalized to avoid exchange-rate speculation. Electrified share includes battery-electric and plug-in hybrid vehicles unless otherwise stated. The estimated player count includes active franchised dealers, independent retailers, digital retailers, and registered vehicle-trading businesses. Forecast Boundaries Forecasts assume moderate Spanish economic growth and continued household access to vehicle finance. No nationwide prohibition on transferring older combustion vehicles is assumed through 2031. Low-emission zones continue to influence urban demand and residual values without eliminating inter-regional liquidity. Used-car imports remain available from European markets without material customs or trade disruption. New-car registrations recover sufficiently to improve younger used-car supply after 2026. Average transaction prices increase moderately as higher-value powertrains and certified vehicles gain share. Limitations Private transaction prices are not comprehensively disclosed and require estimation from listings, tax values, dealer interviews, and age distributions. Reported annual transfer volumes may be revised when associations harmonize data from different registration and market-tracking systems. Company-specific Spain used-car revenues and market shares are generally not separately reported. Digital marketplace listings can include duplicate vehicles or stock marketed through several channels. Peer-country market values use a common transaction-volume and adjusted-ASP methodology to support comparability. Data Source Master Log # Variable Value Used Source Name Year of Data Confidence Level 1 Used passenger-car transactions 2.219 Mn GANVAM and Faconauto 2025 High 2 Average used-car offer price EUR 17,758 Barometer 2025 Medium-High 3 Used-to-new transaction ratio 1.9 GANVAM 2025 High 4 Used imports 172,504 units GANVAM and MSI 2025 Medium-High 5 Diesel used-car share 49.0% GANVAM and Ideauto 2025 Medium-High 6 Electrified used-car share 3.3% GANVAM 2025 Medium 7 Average passenger-car fleet age 14.5 years DGT and sector reporting 2025 High 8 Vehicles older than ten years 57.3% GANVAM and Faconauto 2025 Medium-High 9 Electrified used-car forecast share 10.6% GANVAM 2030 Medium 10 New passenger-car registrations 1.149 Mn ANFAC 2025 High 11 Low-emission-zone threshold 50,000 residents Spanish Official State Gazette 2021 onward High 12 Market value forecast USD 56,883 Mn Ken Research triangulated model 2031 Medium Table of Contents Market Assessment Phase 1. Executive Summary and Approach 2. Data Points for Spain Used Car Market Overview 2.1 Key Insights and Strategic Recommendations 2.2 Data Points for Spain Used Car Market Overview 2.3 Definition and Scope 2.4 Evolution of Market Ecosystem 2.5 Timeline of Key Regulatory Milestones 2.6 Value Chain and Stakeholder Mapping 2.7 Business Cycle Analysis 2.8 Policy and Incentive Landscape 3. Data Points for Spain Used Car Market Analysis 3.1 Growth Drivers 3.1.1 Used-Car Affordability Relative to New Vehicles 3.1.2 Aging Vehicle Fleet and Replacement Requirement 3.1.3 Professionalization of Used-Car Retail 3.2 Market Challenges 3.2.1 Environmental Restrictions on Older Inventory 3.2.2 Shortage of Younger Used Vehicles 3.2.3 Electrified Vehicle Residual-Value Risk 3.3 Market Opportunities 3.3.1 Electrified Used-Car Retail and Battery Certification 3.3.2 Cross-Border Procurement and Import Services 3.3.3 Certified Reconditioning and Embedded Finance 3.4 Market Trends 3.4.1 Growth of Young Used Vehicles 3.4.2 Digital Trade-In and Remote Appraisal 3.4.3 Expansion of Certified Used Programs 3.4.4 Increasing Cross-Border Vehicle Procurement 3.5 Government Regulation 3.5.1 Low-Emission-Zone Access Requirements 3.5.2 Professional Seller Warranty Obligations 3.5.3 DGT Vehicle Transfer and Registration Controls 3.5.4 Environmental Label Classification 4. SWOT Analysis 5. Stakeholder Analysis 6. Porter's Five Forces Analysis 7. Data Points for Spain Used Car Market Market Size 7.1 By Value 7.2 By Volume 7.3 By Average Selling Price 8. Data Points for Spain Used Car Market Segmentation 8.1 Vehicle Type 8.1.1 Hatchbacks and Compacts 8.1.2 SUVs and Crossovers 8.1.3 Sedans and Estates 8.1.4 MPVs and Passenger Vans 8.2 Customer Type 8.2.1 Private Households 8.2.2 Corporate Fleets 8.2.3 Rental and Mobility Operators 8.2.4 Professional Resellers 8.3 Sales Channel 8.3.1 Authorized Dealer Programs 8.3.2 Independent Dealers 8.3.3 Digital-First Retailers and Marketplaces 8.3.4 Private and Auction Channels 8.4 Powertrain 8.4.1 Diesel 8.4.2 Gasoline 8.4.3 Hybrid 8.4.4 Battery Electric and Plug-In Hybrid 8.5 Usage Type 8.5.1 Urban Commuting 8.5.2 Intercity and Family Mobility 8.5.3 Commercial and Fleet Use 8.5.4 Leisure and Tourism Mobility 8.6 Price Tier 8.6.1 Under USD 11,000 8.6.2 USD 11,000-22,000 8.6.3 USD 22,001-38,000 8.6.4 Above USD 38,000 8.7 Geography 8.7.1 Andalusia 8.7.2 Catalonia 8.7.3 Community of Madrid 8.7.4 Valencian Community and Rest of Spain 9. Data Points for Spain Used Car Market Competitive Analysis 9.1 Market Share of Key Players (Micro, Small, Medium, Large Enterprises) 9.2 Cross Comparison of Key Players 9.2.1 Company Name 9.2.2 Group Size 9.2.3 Retail Units Sold 9.2.4 Inventory Turnover Days 9.2.5 Used-Car Revenue Growth 9.2.6 Gross Profit per Retail Unit 9.3 SWOT Analysis of Top Players 9.4 Pricing Analysis 9.5 Detailed Profile of Major Companies 9.5.1 Flexicar 9.5.2 OcasionPlus 9.5.3 Clicars 9.5.4 Autohero Spain 9.5.5 HR Motor 9.5.6 Yamovil 9.5.7 Crestanevada 9.5.8 Stellantis &You Spain 9.5.9 Quadis Ocasión 9.5.10 Caetano Retail España 10. Data Points for Spain Used Car Market End-User Analysis 10.1 Procurement Behavior of Key End-Users 10.1.1 Household Budget and Finance Selection 10.1.2 Corporate Fleet Replacement Cycles 10.1.3 Rental Operator De-Fleeting Demand 10.1.4 Dealer Wholesale Procurement 10.2 Corporate Spend Patterns 10.2.1 Fleet Acquisition Budgets 10.2.2 Refurbishment and Maintenance Spend 10.2.3 Finance and Insurance Attachment 10.2.4 Vehicle Disposal and Remarketing 10.3 Pain Point Analysis by End-User Category 10.3.1 Vehicle History and Mileage Verification 10.3.2 Financing Cost and Approval 10.3.3 Urban Environmental Access 10.3.4 Warranty and Repair Exposure 10.4 User Readiness for Adoption 10.4.1 Digital Purchase Readiness 10.4.2 Electrified Vehicle Readiness 10.4.3 Remote Appraisal Readiness 10.4.4 Subscription and Flexible Ownership Readiness 10.5 Post-Deployment ROI and Use Case Expansion 10.5.1 Lower Vehicle Acquisition Cost 10.5.2 Improved Fleet Utilization 10.5.3 Residual-Value Optimization 10.5.4 Finance and Aftersales Expansion 11. Data Points for Spain Used Car Market Future Size 11.1 By Value 11.2 By Volume 11.3 By Average Selling Price Go-To-Market Strategy Phase 1. Whitespace Analysis and Business Model Canvas 1.1 Electrified Used-Car Certification 1.2 Regional Inventory Exchange 1.3 Embedded Finance and Warranty 1.4 Cross-Border Procurement Services 2. Marketing and Positioning Recommendations 2.1 Verified Vehicle History Positioning 2.2 Monthly Affordability Communication 2.3 Environmental Label Segmentation 2.4 Certified Reconditioning Proposition 3. Distribution Plan 3.1 National Digital Inventory 3.2 Metropolitan Experience Centers 3.3 Regional Collection and Delivery Hubs 3.4 Wholesale Dealer Partnerships 4. Channel and Pricing Gaps 4.1 Private-to-Professional Conversion 4.2 Older Vehicle Pricing Transparency 4.3 Electrified Residual-Value Tools 4.4 Regional Inventory Price Arbitrage 5. Unmet Demand and Latent Needs 5.1 Affordable Low-Emission Vehicles 5.2 Battery Health Disclosure 5.3 Faster Vehicle Finance Approval 5.4 Trusted Cross-Border Inventory 6. Customer Relationship 6.1 Digital Trade-In Journeys 6.2 Warranty Claims Support 6.3 Lifecycle Maintenance Engagement 6.4 Repurchase and Upgrade Programs 7. Value Proposition 7.1 Verified and Inspected Inventory 7.2 Predictable Monthly Ownership Cost 7.3 National Vehicle Selection 7.4 Integrated Finance and Warranty 8. Key Activities 8.1 Vehicle Procurement and Appraisal 8.2 Centralized Reconditioning 8.3 Dynamic Pricing and Merchandising 8.4 Finance and Warranty Administration 9. Entry Strategy Evaluation 9.1 Domestic Market Entry Strategy 9.1.1 Acquire Regional Dealer Platform 9.1.2 Build Digital Procurement Funnel 9.1.3 Establish Refurbishment Capacity 9.1.4 Launch Finance Partnerships 9.2 Export Entry Strategy 9.2.1 Source Vehicles Across the European Union 9.2.2 Establish Spanish Import Operations 9.2.3 Develop Compliance and Registration Capability 9.2.4 Build Cross-Border Logistics Partnerships 10. Entry Mode Assessment 10.1 Organic Digital Retail Launch 10.2 Dealer Network Acquisition 10.3 Joint Venture with Dealer Group 10.4 Marketplace and Service Partnership 11. Capital and Timeline Estimation 11.1 Inventory Working Capital 11.2 Refurbishment Facility Investment 11.3 Technology and Data Investment 11.4 Market Launch Timeline 12. Control vs Risk Trade-Off 12.1 Inventory Ownership Exposure 12.2 Marketplace Capital Efficiency 12.3 Franchise Operating Control 12.4 Partner-Dependent Execution Risk 13. Profitability Outlook 13.1 Vehicle Gross Margin 13.2 Finance and Insurance Income 13.3 Warranty and Aftersales Income 13.4 Inventory Carrying Cost 14. Potential Partner List 14.1 Vehicle Finance Institutions 14.2 Inspection and Certification Providers 14.3 Automotive Logistics Operators 14.4 Warranty and Insurance Administrators 15. Execution Roadmap 15.1 Phased Plan for Market Entry 15.1.1 Market Setup 15.1.2 Market Entry 15.1.3 Growth Acceleration 15.1.4 Scale and Stabilize 15.2 Key Activities and Milestones 15.2.1 Complete Regulatory and Entity Setup 15.2.2 Launch Procurement and Retail Pilot 15.2.3 Expand Refurbishment and Delivery Network 15.2.4 Optimize Inventory Turns and Uit Economics Disclaimer Contact Us
Key Assumptions
- The market lens is gross transaction value for used passenger cars and SUVs transferred in Spain, including professional and private transactions.
- New vehicles, motorcycles, heavy commercial vehicles, vehicle rentals, standalone repair revenue, insurance premiums, and financing principal are excluded.
- Market value equals transfer volume multiplied by an age-adjusted and channel-adjusted average transaction price converted into USD.
- Advertised prices were adjusted for negotiation, channel mix, private sales, vehicle age, and transaction realization.
- Historical currency conversion uses annual euro-to-dollar reference rates; forecast conversion is normalized to avoid exchange-rate speculation.
- Electrified share includes battery-electric and plug-in hybrid vehicles unless otherwise stated.
- The estimated player count includes active franchised dealers, independent retailers, digital retailers, and registered vehicle-trading businesses.
Forecast Boundaries
- Forecasts assume moderate Spanish economic growth and continued household access to vehicle finance.
- No nationwide prohibition on transferring older combustion vehicles is assumed through 2031.
- Low-emission zones continue to influence urban demand and residual values without eliminating inter-regional liquidity.
- Used-car imports remain available from European markets without material customs or trade disruption.
- New-car registrations recover sufficiently to improve younger used-car supply after 2026.
- Average transaction prices increase moderately as higher-value powertrains and certified vehicles gain share.
Limitations
- Private transaction prices are not comprehensively disclosed and require estimation from listings, tax values, dealer interviews, and age distributions.
- Reported annual transfer volumes may be revised when associations harmonize data from different registration and market-tracking systems.
- Company-specific Spain used-car revenues and market shares are generally not separately reported.
- Digital marketplace listings can include duplicate vehicles or stock marketed through several channels.
- Peer-country market values use a common transaction-volume and adjusted-ASP methodology to support comparability.
CHAPTER 9 - Competitive Landscape
Competitive Landscape Overview
The market remains fragmented across private sellers and independent dealers, although scaled retailers are consolidating professional inventory through national sourcing, centralized refurbishment, digital distribution, finance attachment, and standardized warranties.
Market Share Distribution
Top 5 Players
Market Dynamics
8 new entrants in the past 5 years, indicating strong market attractiveness and growth potential.
Company Name | Market Share | Headquarters | Founding Year | Core Market Focus |
|---|---|---|---|---|
Flexicar | - | Madrid, Spain | - | National multi-location used-car retail, trade-ins, financing, warranties, and vehicle delivery |
OcasionPlus | - | Madrid, Spain | 2010 | Independent used-car retail, vehicle purchasing, financing, insurance, and aftersales services |
Clicars | - | Madrid, Spain | 2016 | Digital-first retail of inspected and reconditioned used vehicles |
Autohero Spain | - | Berlin, Germany | 2012 | Online used-car retail supported by AUTO1 procurement, refurbishment, finance, and logistics |
HR Motor | - | - | - | Multi-location used-car retail, vehicle acquisition, financing, warranties, and home delivery |
Yamovil | - | Madrid, Spain | - | Used-car retail, appraisals, vehicle purchasing, financing, and workshop services |
Crestanevada | - | Granada, Spain | - | Used and nearly new vehicle retail through physical dealerships and digital inventory |
Stellantis &You Spain | - | Madrid, Spain | - | Manufacturer-backed multi-brand used-car retail, certification, finance, and warranties |
Quadis Ocasión | - | Barcelona, Spain | - | Dealer-group used-car sourcing, certified inventory, trade-ins, finance, and aftersales |
Caetano Retail España | - | Madrid, Spain | - | Multi-brand automotive retail with used-car sales, fleet remarketing, finance, and service |
Cross Comparison Parameters
The report provides detailed cross-comparison of key players across 10 performance parameters to identify competitive strengths and weaknesses.
Retail Units Sold
Inventory Turnover Days
Used-Car Revenue Growth
Gross Profit per Retail Unit
Analysis Covered
Market Share Analysis:
Compares estimated transaction scale across leading professional used-car retail operators
Cross Comparison Matrix:
Benchmarks sales throughput, inventory productivity, growth, and unit economics
SWOT Analysis:
Evaluates sourcing strength, digital capabilities, capital requirements, and operating risks
Pricing Strategy Analysis:
Assesses acquisition discipline, retail markups, financing, and warranty bundling
Company Profiles:
Reviews operating footprint, channel model, inventory focus, and differentiation
CHAPTER 10 - REPORT TOC
CHAPTER 14 - Table Of Contents
Phase 1Market Assessment Phase
11
Chapters
Supply-side and competitive intelligence covering market sizing, segmentation, competitive dynamics, regulatory landscape, and future forecasts.
Phase 2Go-To-Market Strategy Phase
15
Chapters
Entry strategy evaluation, execution roadmap, partner recommendations, and profitability outlook.
Complete Report Coverage
201+ detailed sections covering every aspect of the market
143
Assessment Sections
58
Strategy Sections
CHAPTER 11 - Our Approach
Research Methodology
Desk Research
- Reviewed Spanish vehicle transfer statistics
- Analyzed used-car pricing barometers
- Mapped emissions and warranty regulations
- Assessed dealer and platform disclosures
Primary Research
- Interviewed used-car retail directors
- Consulted fleet remarketing managers
- Engaged automotive finance risk heads
- Interviewed vehicle inspection specialists
Validation and Triangulation
- Validated findings across 300 respondents
- Reconciled vehicle volumes and pricing
- Compared dealer and private channels
- Stress-tested residual-value assumptions
CHAPTER 12 - FAQ
FAQs
Still have questions?
Our research team is here to help you find the right solution
CHAPTER 13 - Related Research
Explore Related Reports
Expand your market intelligence with complementary research across regions and adjacent markets.
Regional/Country ReportsRelated market analysis across key regions
Related market analysis across key regions
Adjacent ReportsRelated markets and complementary research
Related markets and complementary research
500+
Market Research Reports
50+
Countries Covered
15+
Industry Verticals