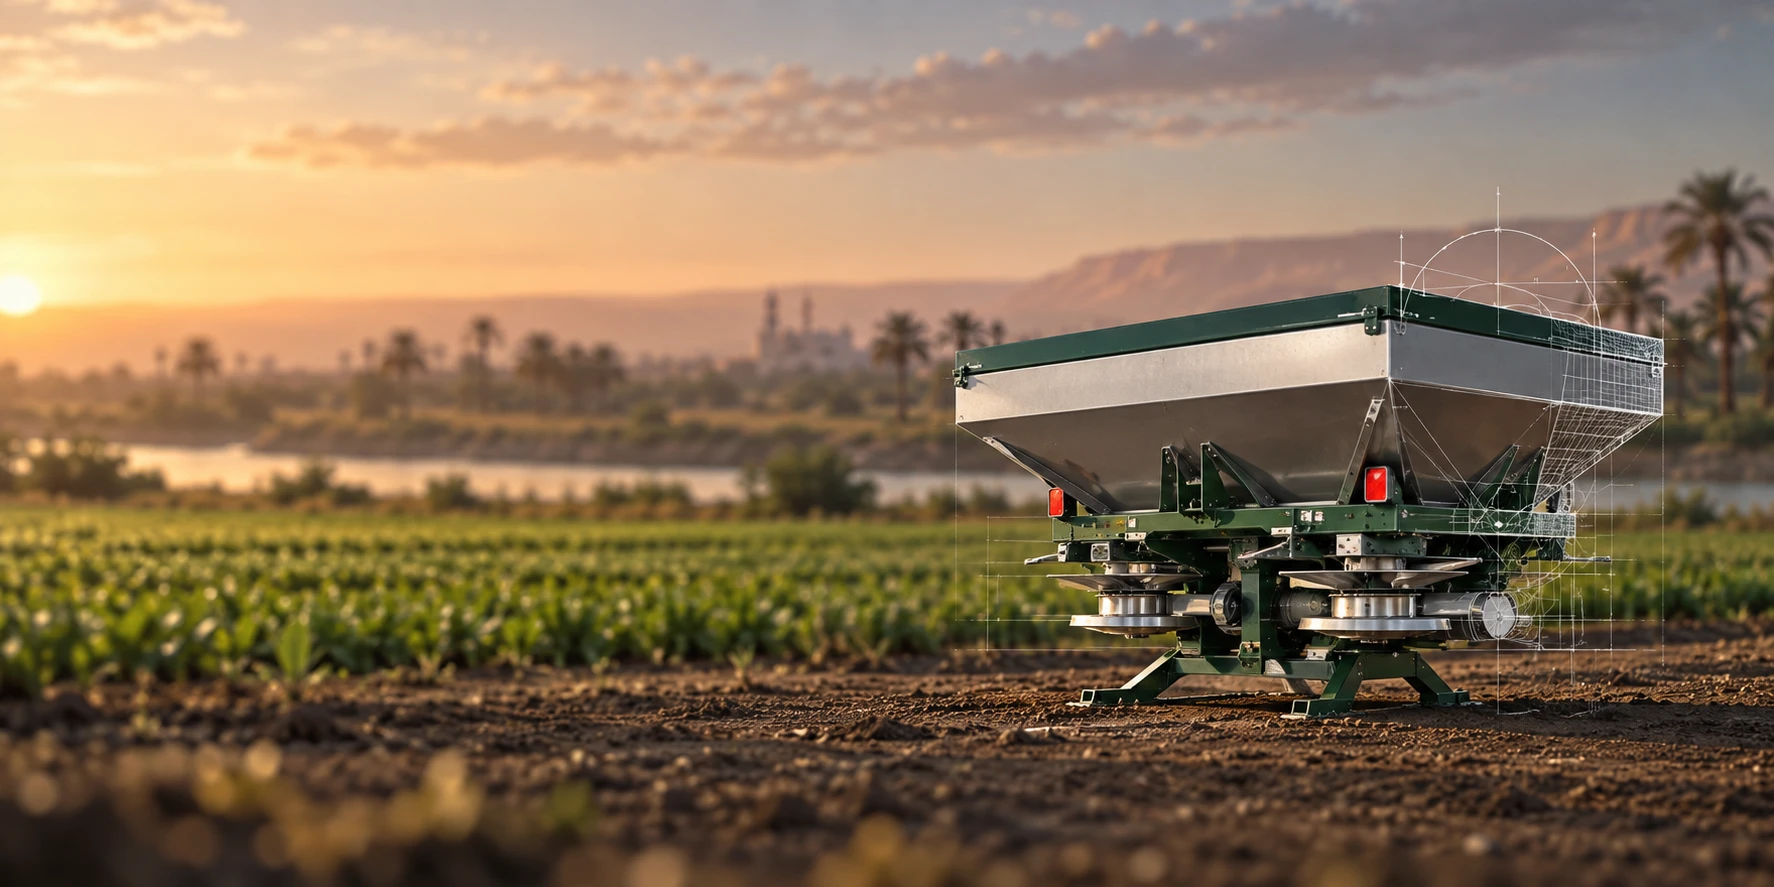
CHAPTER 1 - MARKET SUMMARY
Market Overview
The Egypt Fertilizer and Crop Nutrition Market connects natural gas-based nitrogen production, phosphate conversion, imported potash, domestic blending and agricultural distribution. Demand is structurally intensive because fertilizer consumption reached approximately 532.8 kilograms per hectare of arable land in 2023. High cropping intensity, irrigated production and limited cultivable land make nutrient productivity commercially critical for farmers, cooperatives and food-security programs.
Production is concentrated around Alexandria, Damietta, Ain Sokhna, Suez, Aswan and the Nile Delta logistics network. Egypt has annual capacity of approximately 7.8 million tonnes of nitrogen fertilizers and 4.0 million tonnes of phosphate fertilizers. Port proximity enables producers to serve domestic cooperative channels while exporting through Mediterranean and Red Sea terminals, creating scale advantages unavailable to smaller regional competitors.
Market Value
USD 3,500 million
2025
Dominant Region
Nile Delta and Mediterranean Industrial Corridor
2025
Dominant Segment
Nitrogen Fertilizers
2025
Total Number of Players
120
Future Outlook
The Egypt Fertilizer and Crop Nutrition Market is projected to expand from USD 3,500 Mn in 2025 to USD 4,895 Mn by 2031. The forecast reflects a 5.75% CAGR, compared with a 6.10% historical CAGR during 2020-2025. Growth will be supported by agricultural reclamation, higher cropping intensity, recovery in export pricing, specialty nutrient penetration and capacity additions in compound fertilizers. Volume growth will remain below value growth as water-soluble fertilizers, micronutrients, stabilized nitrogen and crop-specific blends gain share. Domestic supply obligations will preserve a substantial base-load market, while export sales will provide the principal earnings upside for integrated producers.
Strategic differentiation will shift from commodity capacity toward energy efficiency, nutrient-use performance and carbon traceability. MOPCO's planned production of up to 150,000 tonnes of green ammonia annually and Fertiglobe's Egyptian green-hydrogen pathway indicate the direction of capital deployment. Producers that reduce natural gas consumption, verify embedded emissions and expand NPK or specialty formulations should achieve stronger margins than commodity-only suppliers. Distribution companies will benefit from fertigation adoption in new desert farms, although fragmented smallholder demand will continue to require cooperative access, field agronomy and smaller pack formats. Forecast downside remains concentrated in natural gas disruption, price controls and water scarcity.
5.75%
Forecast CAGR
$4,895 Mn
2030 Projection
Base Year
2025
Historical Period
2020-2025
Forecast Period
2026-2031
Historical CAGR
6.10%
CHAPTER 2 - SCOPE OF REPORT
Scope of the Market
CHAPTER 3 - Key Stakeholders
Key Target Audience
Key stakeholders who can leverage from this market analysis for investment, strategy, and operational planning.
Investors
CAGR, export netbacks, capex intensity, gas risk, margins
Corporates
capacity utilization, product mix, procurement, pricing, emissions
Government
farmer affordability, allocation compliance, food security, exports
Operators
feedstock efficiency, uptime, distribution, inventory, product quality
Financial institutions
project finance, gas exposure, covenants, export cashflows
CHAPTER 4 - Market Size & Growth
Market Size, Growth Forecast and Trends
This section evaluates the historical market size, analyzes year-over-year growth dynamics, and presents forecast projections supported by market performance indicators and demand-side drivers.
Historical & Projected Market Size ($ Million)
Year-over-Year Growth Rate (%)
Market Value vs Volume Growth (%)
Historical Market Performance (2020-2025)
Market value reached a historical peak in 2022 as international urea, ammonia and phosphate prices rose sharply, while underlying product volume increased only 2.0%. The subsequent 27.1% value correction in 2023 reflected price normalization rather than structural demand contraction, with volume expanding 10.0%. Export performance strengthened in 2024, when Egypt shipped approximately 8.3 million tonnes of fertilizer. By 2025, product volume reached an estimated 12.0 million tonnes across domestic and export channels, while the implied blended selling value normalized to approximately USD 292 per tonne.
Forecast Market Outlook (2026-2031)
The forecast assumes product volume reaches approximately 14.3 million tonnes by 2031, representing a 3.0% to 3.1% annual expansion during most of the period. Value growth exceeds volume growth because average price and product mix improve from approximately USD 300 per tonne in 2026 to USD 342 per tonne in 2031. Expansion of water-soluble fertilizers, micronutrients, customized NPK blends and lower-carbon nitrogen products supports the mix uplift. Commodity-price volatility remains material, but reclamation projects and export diversification provide a stronger structural demand floor than during the historical period.
CHAPTER 5 - Market Data
Market Breakdown
The Egypt Fertilizer and Crop Nutrition Market combines high-volume commodity fertilizers with a faster-expanding specialty nutrition segment. The following indicators show how volume, pricing and specialty penetration shape the revenue trajectory relevant to manufacturers, exporters and agricultural input investors.
Year | Market Size (USD Mn) | YoY Growth (%) | Product Volume (Mn Tonnes) | Average Selling Value (USD/Tonne) | Specialty Product Share (%) | Period |
|---|---|---|---|---|---|---|
| 2020 | $2,603 Mn | +- | 9.40 | 277 | Forecast | |
| 2021 | $3,000 Mn | +15.3% | 9.80 | 306 | Forecast | |
| 2022 | $4,250 Mn | +41.7% | 10.00 | 425 | Forecast | |
| 2023 | $3,100 Mn | +-27.1% | 11.00 | 282 | Forecast | |
| 2024 | $3,320 Mn | +7.1% | 11.70 | 284 | Forecast | |
| 2025 | $3,500 Mn | +5.4% | 12.00 | 292 | Forecast | |
| 2026 | $3,701 Mn | +5.7% | 12.35 | 300 | Forecast | |
| 2027 | $3,914 Mn | +5.8% | 12.72 | 308 | Forecast | |
| 2028 | $4,139 Mn | +5.7% | 13.10 | 316 | Forecast | |
| 2029 | $4,377 Mn | +5.8% | 13.50 | 324 | Forecast | |
| 2030 | $4,629 Mn | +5.8% | 13.90 | 333 | Forecast | |
| 2031 | $4,895 Mn | +5.7% | 14.30 | 342 | Forecast |
Product Volume
12.0 million tonnes, 2025, Egypt. Large production scale supports export competitiveness and domestic security. Egypt's installed base includes approximately 7.8 million tonnes of nitrogen fertilizer capacity and 4.0 million tonnes of phosphate fertilizer capacity.
Average Selling Value
USD 292 per tonne, 2025, Egypt. The blended indicator reflects subsidized domestic sales, commercial products and higher-value exports. Nitrogen fertilizer exports alone totaled approximately 3.54 million tonnes and USD 1.55 billion in 2024.
Specialty Product Share
10.5%, 2025, Egypt. Specialty penetration raises revenue per tonne and reduces reliance on commodity cycles. Evergrow reports annual capacity of 360,000 tonnes of potassium sulfate and 120,000 tonnes of calcium nitrate.
CHAPTER 6 - Segmentation
Market Segmentation Framework
Comprehensive analysis across key dimensions providing insights into market structure, consumer preferences, and distribution patterns.
No of Segments
7
Dominant Segment
Product Type
Fastest Growing Segment
Application
Product Type
Crop Type
Customer Type
Application
Distribution Channel
Farm Size
Geography
Key Segmentation Takeaways
Comprehensive analysis across all extracted segmentation dimensions providing insights into market structure, consumer preferences, and distribution patterns.
Product Type
Product type remains the dominant segmentation dimension because nitrogen, phosphate, compound and specialty products have materially different feedstocks, pricing structures, distribution controls and export economics. Nitrogen fertilizers form the largest volume pool due to intensive cereal cultivation and Egypt's gas-based production assets. Specialty and biological products generate higher revenue per tonne but remain smaller in absolute scale.
Application
Application is the fastest-growing dimension as desert agriculture and high-value horticulture shift nutrient delivery from broad soil application toward fertigation and foliar programs. Drip-irrigated farms require soluble, low-salt and crop-specific formulations that can be dosed through irrigation systems. This shift creates stronger demand for potassium nitrate, calcium nitrate, chelated micronutrients, biostimulants and technical agronomy services.
CHAPTER 7 - Regional Analysis
Regional Analysis
Egypt ranks among the largest fertilizer and crop nutrition markets across North Africa and the Eastern Mediterranean, supported by a substantial domestic agricultural base and export-oriented nitrogen capacity. On a comparable revenue basis, Egypt trails Turkey but exceeds Morocco, Saudi Arabia, Algeria and Jordan, while retaining stronger product-volume economics than most peers.
Focus Country Ranking
2nd
Focus Country Market Size
USD 3,500 Mn (2025)
Focus Country CAGR (2026-2031)
5.75%
Focus Country Ranking
2nd
Focus Country Market Size
USD 3,500 Mn (2025)
Focus Country CAGR (2026-2031)
5.75%
Regional Analysis (Current Year)
Market Position
Egypt ranks second in the peer set with USD 3,500 Mn in 2025, supported by 11.8 million tonnes of nitrogen and phosphate fertilizer capacity and intensive domestic nutrient demand.
Growth Advantage
Egypt's 5.75% forecast CAGR exceeds Turkey's 5.10% and Algeria's 4.80%, although Morocco grows faster at 6.40% through phosphate investment and export-oriented capacity expansion.
Competitive Strengths
Egypt combines 533 kilograms-per-hectare fertilizer intensity, Mediterranean and Red Sea port access, and record 2024 fertilizer exports of 8.3 million tonnes, strengthening plant utilization and distribution economics.
CHAPTER 8 - INDUSTRY ANALYSIS
Growth Drivers, Challenges & Opportunities
Comprehensive analysis of key factors shaping the Egypt Fertilizer and Crop Nutrition Market, including growth catalysts, operational challenges, and emerging opportunities across production, distribution, and consumer segments.
Growth Drivers
Agricultural Land Expansion and Crop Intensification
- Cultivated land increased 12.4% between 2014 and 2024 (Egypt), creating recurring nutrient demand beyond established Nile Valley acreage and supporting regional dealer expansion.
- The Future of Egypt project targets 4.5 million feddans of reclamation and 800,000 newly cultivated feddans (project scope, Egypt), benefiting fertigation-grade suppliers and institutional sales teams.
- Wheat occupied approximately 3.1 million feddans with expected production of 9-10 million tonnes (2025, Egypt), preserving large seasonal demand for subsidized nitrogen and phosphate fertilizers.
Export-Oriented Production and Port Connectivity
- Total fertilizer shipments reached 8.3 million tonnes (2024, Egypt), a scale that improves plant utilization, freight negotiation and access to European, Mediterranean and African buyers.
- Nitrogen fertilizer exports totaled 3.54 million tonnes and USD 1.55 billion (2024, Egypt), confirming the strategic importance of urea and nitrogen derivatives to industry earnings.
- Fertiglobe's Egyptian EFC and EBIC assets have access to three ports, Ain Sokhna, Adabeya and Damietta (current operating network, Egypt), lowering freight friction and widening customer reach.
Transition Toward Specialty and Low-Carbon Nutrition
- MOPCO's converter modernization targets approximately 10% lower natural gas consumption in the synthesis loop (project design, Egypt), improving cash cost and reducing exposure to gas curtailment.
- Egypt's first green-hydrogen fertilizer project targets 15,000 tonnes of green hydrogen and more than 130,000 tonnes of annual CO2 savings (project capacity, Egypt).
- Evergrow operates capacity of 360,000 tonnes of potassium sulfate and 120,000 tonnes of calcium nitrate annually (current capacity, Egypt), demonstrating commercial scale in specialty nutrients.
Market Challenges
Natural Gas Supply Volatility
- Abu Qir, MOPCO and other producers announced 24-hour operating suspensions (June 2024, Egypt), reducing saleable production and creating shipment-reliability risks for export customers.
- Egypt committed more than USD 1 billion for imported gas and fuel oil (2024, Egypt), illustrating the fiscal cost required to stabilize power and industrial feedstock supply.
- The country awarded a tender for 20 LNG cargoes (2024, Egypt), showing that fertilizer utilization can depend on imported energy availability during peak electricity-demand periods.
Dual Pricing and Domestic Allocation Complexity
- Only approximately 45% of output has historically been available for unrestricted export (policy framework, Egypt), limiting producers' flexibility when international prices exceed controlled domestic values.
- Egyptian nitrogen exports averaged approximately USD 438 per tonne (2024, Egypt), illustrating the opportunity cost associated with selling equivalent product through lower-priced regulated channels.
- Governance systems track fertilizer from factories through cooperatives to eligible farmers, covering three distribution stages (2025, Egypt) and increasing documentation, reconciliation and working-capital requirements.
Water Scarcity and Fragmented Farm Structure
- Average small-farm holdings are approximately 0.8-0.9 feddan (2023, Egypt), requiring smaller pack sizes, cooperative aggregation and extensive field-level agronomy support.
- Agricultural land represented approximately 4.1% of Egypt's total area in 2021, concentrating nutrient demand within heavily irrigated corridors and reclamation zones.
- Fertilizer use reached 532.8 kilograms per hectare in 2023 (Egypt), making nutrient efficiency and runoff control economically important under constrained water availability.
Market Opportunities
Water-Soluble Fertilizers for New Agricultural Lands
- Suppliers can monetize recurring nutrient schedules through crop-specific fertigation programs, serving 800,000 newly cultivated feddans (project addition, Egypt) planned under the Future of Egypt initiative.
- Specialty producers, irrigation integrators and commercial farms benefit because soluble products generate higher revenue per tonne than commodity granular fertilizers across four core fertigation input categories (market scope, Egypt).
- Opportunity realization requires soil testing, dosing systems and dealer training to improve fertilizer productivity across a market applying 532.8 kilograms per hectare (2023, Egypt).
Low-Carbon Fertilizer Exports
- Producers can defend European margins by reducing embedded emissions and documenting plant-specific footprints for a fertilizer export base worth USD 2.58 billion in 2024 (Egypt).
- Fertiglobe, MOPCO, technology providers and infrastructure investors benefit from planned output of at least 150,000 tonnes of green ammonia annually (project capacity, Egypt).
- Commercial scaling requires renewable power, verified hydrogen sourcing and emissions accounting, building on expected annual savings exceeding 130,000 tonnes of CO2 (project design, Egypt).
Compound Fertilizer and African Distribution Expansion
- Integrated phosphoric acid, sulfuric acid and compound-fertilizer production can capture value beyond raw materials across three principal processing plants (project design, Egypt).
- Producers, port operators and African distributors benefit from Egypt's position as the ninth-largest global fertilizer exporter by value in 2024.
- Execution requires country-specific registrations, distributor credit systems and crop-adapted formulations to convert Egypt's 8.3 million-tonne export platform (2024, Egypt) into higher-margin branded nutrition sales.
CHAPTER 9 - Competitive Landscape
Competitive Landscape Overview
The market is concentrated in capital-intensive nitrogen and phosphate manufacturing, while specialty formulations remain more fragmented. Entry barriers include natural gas access, environmental approvals, port logistics, working capital and regulated domestic allocation obligations.
Market Share Distribution
Top 5 Players
Market Dynamics
8 new entrants in the past 5 years, indicating strong market attractiveness and growth potential.
Company Name | Market Share | Headquarters | Founding Year | Core Market Focus |
|---|---|---|---|---|
Abu Qir Fertilizers and Chemical Industries Company | - | Alexandria, Egypt | 1976 | Urea, ammonia, ammonium nitrate and liquid nitrogen fertilizers |
Misr Fertilizers Production Company (MOPCO) | - | Damietta, Egypt | 1998 | Granular urea, ammonia and low-carbon ammonia development |
Egyptian Fertilizers Company (EFC) | - | Ain Sokhna, Egypt | - | Export-oriented granular urea and ammonia production |
Egypt Basic Industries Corporation (EBIC) | - | Ain Sokhna, Egypt | - | Merchant ammonia and nitrogen fertilizer intermediates |
Egyptian Chemical Industries Company (KIMA) | - | Aswan, Egypt | 1956 | Urea, ammonia and nitrogenous fertilizers |
Helwan Fertilizers Company | - | Cairo, Egypt | - | Granular urea, ammonia and automotive-grade urea |
Egyptian Financial and Industrial Company (EFIC) | - | Cairo, Egypt | 1929 | Single superphosphate, sulfuric acid and phosphate fertilizers |
Alexandria Fertilizers Company (AlexFert) | - | Alexandria, Egypt | 2003 | Granular urea and anhydrous ammonia |
Suez Company for Fertilizers Production | - | Suez, Egypt | 2002 | Single superphosphate, ammonium sulfate and sulfuric acid |
Evergrow for Specialty Fertilizers | - | Giza, Egypt | 2006 | Potassium sulfate, calcium nitrate and specialty crop nutrition |
Cross Comparison Parameters
The report provides detailed cross-comparison of key players across 10 performance parameters to identify competitive strengths and weaknesses.
Domestic Sales Volume
Export Volume
Revenue Growth
EBITDA Margin
Analysis Covered
Market Share Analysis:
Compares domestic sales, exports and addressable product revenue pools
Cross Comparison Matrix:
Benchmarks scale, utilization, portfolio breadth and financial performance indicators
SWOT Analysis:
Assesses feedstock access, channel strength, emissions exposure and expansion options
Pricing Strategy Analysis:
Evaluates regulated allocation, commercial pricing and export netback realization
Company Profiles:
Reviews capacity, locations, products, investment pipeline and strategic positioning
CHAPTER 10 - REPORT TOC
Table of Contents
Market Assessment Phase
Supply-side and competitive intelligence covering market sizing, segmentation, competitive dynamics, regulatory landscape, and future forecasts.
Go-To-Market Strategy Phase
15 chapters
Entry strategy evaluation, execution roadmap, partner recommendations, and profitability outlook.
Survey Phase
8 chapters
Demand-side primary research conducted through structured interviews and online surveys with end users across priority metros and Tier 2/3 cities to capture consumption behavior, unmet needs, and purchase drivers.
Complete Report Coverage
201+ detailed sections covering every aspect of the market
143
Assessment Sections
58
Strategy Sections
CHAPTER 11 - Our Approach
Research Methodology
Desk Research
- Mapped Egyptian fertilizer production capacities
- Reviewed fertilizer trade-flow statistics
- Analyzed agricultural acreage and crops
- Assessed allocation and pricing policies
Primary Research
- Fertilizer plant commercial directors interviewed
- Agricultural cooperative managers consulted
- Specialty fertilizer distributors interviewed
- Commercial farm agronomists consulted
Validation and Triangulation
- Validated findings across 286 respondents
- Reconciled production and export volumes
- Cross-checked domestic allocation estimates
- Tested fertilizer price and mix
CHAPTER 12 - FAQ
FAQs
Still have questions?
Our research team is here to help you find the right solution
CHAPTER 13 - Related Research
Explore Related Reports
Expand your market intelligence with complementary research across regions and adjacent markets.
Regional/Country ReportsRelated market analysis across key regions
Related market analysis across key regions
- South Africa Fertilizer and Crop Nutrition Market Size, Share & Forecast, By Product Type, Crop Type & Distribution Channel, 2025-2032
- Philippines Fertilizer and Crop Nutrition Market Size, Share & Forecast, By Product Type, Crop Type & Distribution Channel, 2025-2032
- Mexico Fertilizer and Crop Nutrition Market Size, Share & Forecast, By Product Type, Crop Type & Distribution Channel, 2026-2031
- South Africa Fertilizer and Crop Nutrition Market
- Indonesia Fertilizer and Crop Nutrition Market
Adjacent ReportsRelated markets and complementary research
Related markets and complementary research
- Indonesia Nitrogen Fertilizer Market
- Global phosphate fertilizer market report size, share, growth drivers, trends, opportunities & forecast 2025–2030
- UAE potash market report size, share, growth drivers, trends, opportunities & forecast 2025–2030
- Bahrain Agricultural Distribution Market
- Egypt Crop Nutrition Solutions Market
500+
Market Research Reports
50+
Countries Covered
15+
Industry Verticals