CHAPTER 1 - MARKET SUMMARY
Market Overview
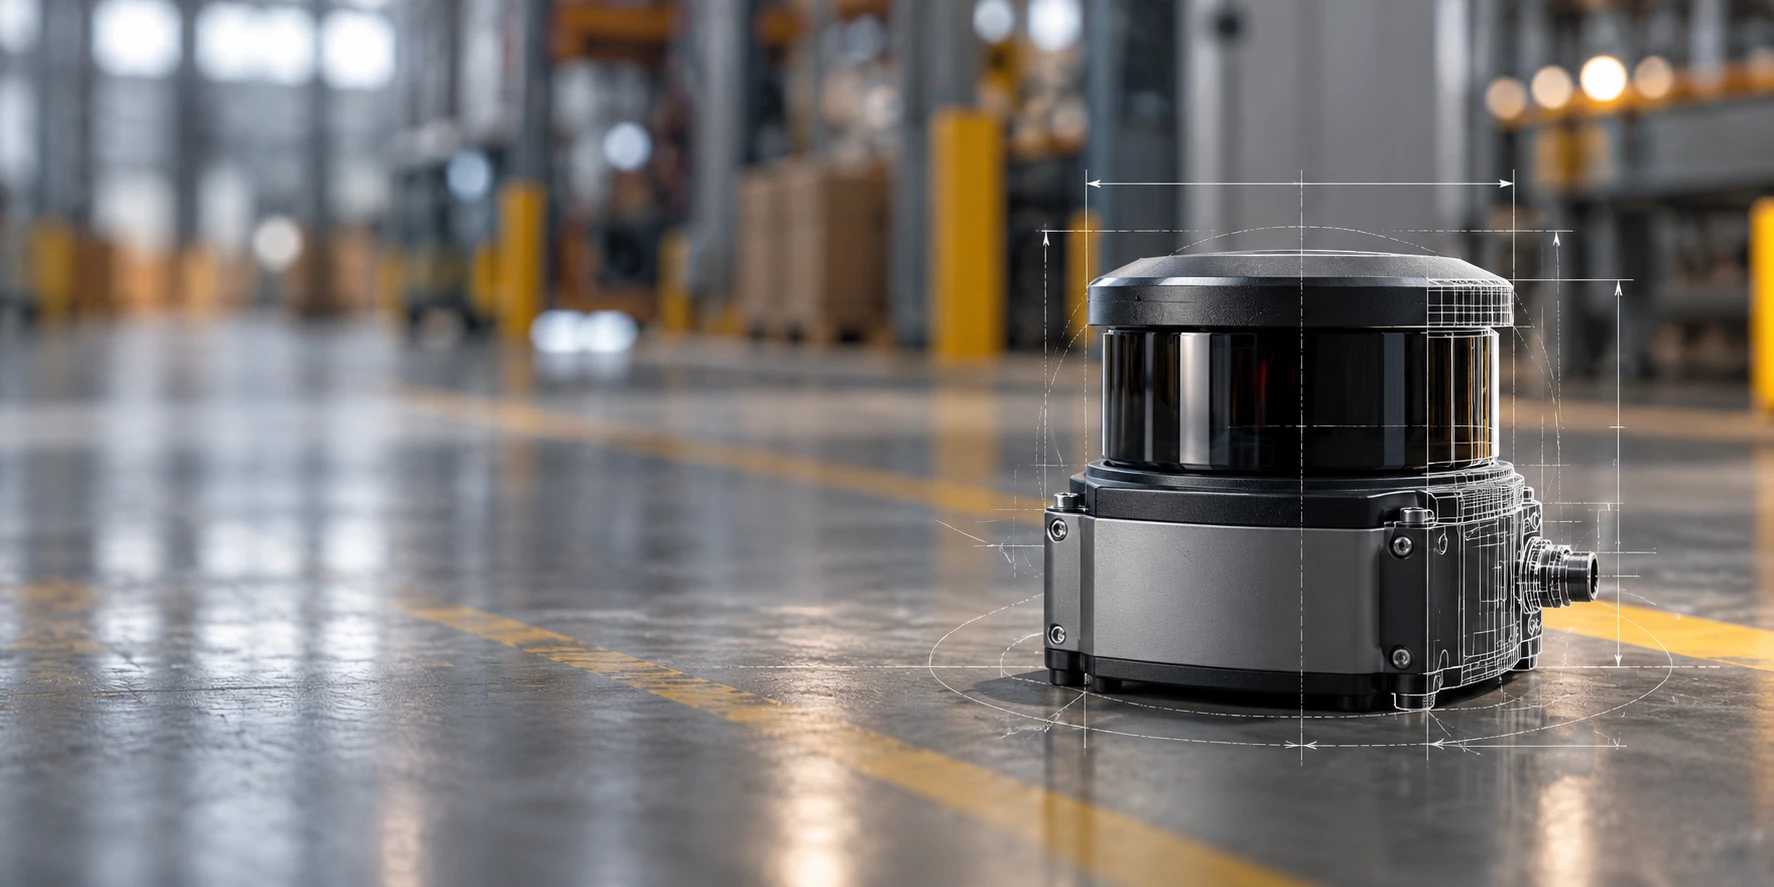
The Global 2D Laser Scanners Market operates across industrial ranging, machine protection, autonomous navigation and dimensional measurement, with suppliers monetizing sensor hardware, controllers, safety-certified interfaces and integration support. Demand is reinforced by a global operational stock of 4.664 million industrial robots in 2024, up 9% year-on-year, creating a large addressable installed base for planar sensing, localization and safeguarding applications.
Asia-Pacific represents the most strategically important production and deployment hub for industrial 2D scanning systems. Asia accounted for 74% of global industrial robot installations in 2024, with China alone installing 295,000 units. This concentration strengthens regional demand for scanners used in AGVs, AMRs, production cells, material handling and automated inspection while supporting an increasingly localized automation-component supply chain.
Market Value
USD 2,090 million
2025
Dominant Region
Asia-Pacific
Dominant Segment
AGV/AMR Navigation
fastest growing
Total Number of Players
55
Future Outlook
The Global 2D Laser Scanners Market is projected to expand from USD 2,090 million in 2025 to USD 3,513 million by 2032, representing a forecast CAGR of 7.70%. The modeled trajectory accelerates from the 6.76% historical CAGR recorded during 2020-2025 as industrial automation broadens beyond automotive into electronics, warehousing, food processing, pharmaceuticals and general manufacturing. Market value is projected at approximately USD 3,262 million by 2031 before reaching the 2032 terminal value. Increasing AMR penetration, configurable safety fields and Ethernet-enabled scanners should support a higher-value product mix alongside sustained volume expansion.
Growth is expected to remain structurally stronger in Asia-Pacific, where industrial robot deployment and automation investment provide the deepest demand base. North America and Europe should retain substantial value pools because safety compliance, advanced manufacturing and installed automation systems support premium scanner configurations. Scanner-equivalent shipment growth is expected to trail value growth as average selling prices increase through longer-range optics, higher scan rates, safety certification and integrated processing. Competitive pressure from 3D sensing will limit pricing power in general navigation applications, while 2D systems should retain cost and computational advantages in planar environments such as warehouses and factory floors.
7.70%
Forecast CAGR
$3,513 Mn
2030 Projection
Base Year
2025
Historical Period
2020-2025
Forecast Period
2025-2032
Historical CAGR
6.76%
CHAPTER 2 - SCOPE OF REPORT
Scope of the Market
CHAPTER 3 - Key Stakeholders
Key Target Audience
Key stakeholders who can leverage from this market analysis for investment, strategy, and operational planning.
Investors
CAGR, robotics exposure, product margins, technology substitution, risk
Corporates
scanner sourcing, automation roadmap, specifications, safety compliance, pricing
Government
automation intensity, machinery safety, localization, standards, productivity resilience
Operators
scanner uptime, navigation accuracy, integration, maintenance, safety performance
Financial institutions
automation capex, supplier quality, demand stability, technology risk
CHAPTER 4 - Market Size & Growth
Market Size, Growth Forecast and Trends
This section evaluates the historical market size, analyzes year-over-year growth dynamics, and presents forecast projections supported by market performance indicators and demand-side drivers.
Historical & Projected Market Size ($ Million)
Year-over-Year Growth Rate (%)
Market Value vs Volume Growth (%)
Historical Market Performance (2020-2025)
Market value increased from USD 1,507 million in 2020 to USD 2,090 million in 2025, producing a 6.76% historical CAGR. The most visible acceleration occurred in 2025, when modeled growth reached 7.73%, following expanding industrial automation and post-pandemic logistics investment. Scanner-equivalent shipments increased from approximately 612,000 units to 789,000 units during the period. Industrial robot installations reached a record 553,052 units in 2022 and remained above 500,000 annually through 2024, supporting recurring demand for navigation, safety and precision sensing.
Forecast Market Outlook (2025-2032)
The market is forecast to reach USD 3,513 million by 2032 at a 7.70% CAGR. Scanner-equivalent shipments are modeled to reach approximately 1.21 million units, while mix improvement raises weighted unit value through networked safety scanners, long-range 360-degree devices and higher-resolution profile scanners. The external laser-scanner benchmark identifies 2D scanning as the largest technology type, with its value rising from USD 1.94 billion in 2024 toward USD 4.39 billion by 2035.
CHAPTER 5 - Market Data
Market Breakdown
The market's growth trajectory is closely linked to automation intensity, mobile-robot adoption and the installed base of programmable manufacturing equipment. For CEOs and investors, these KPIs indicate the depth of addressable scanner replacement, retrofit and new-build demand.
Year | Market Size (USD Mn) | YoY Growth (%) | Industrial Robot Installations (000 Units) | Operational Industrial Robot Stock (Mn Units) | Professional Service Robot Sales (000 Units) | Period |
|---|---|---|---|---|---|---|
| 2020 | $1,507 Mn | +- | - | - | Forecast | |
| 2021 | $1,603 Mn | +6.37% | - | - | Forecast | |
| 2022 | $1,713 Mn | +6.86% | 553.1 | - | Forecast | |
| 2023 | $1,829 Mn | +6.77% | 541.3 | 4.282 | Forecast | |
| 2024 | $1,940 Mn | +6.07% | 542.0 | 4.664 | Forecast | |
| 2025 | $2,090 Mn | +7.73% | - | - | Forecast | |
| 2026 | $2,251 Mn | +7.70% | - | - | Forecast | |
| 2027 | $2,424 Mn | +7.69% | - | - | Forecast | |
| 2028 | $2,611 Mn | +7.71% | - | - | Forecast | |
| 2029 | $2,812 Mn | +7.70% | - | - | Forecast | |
| 2030 | $3,028 Mn | +7.68% | - | - | Forecast | |
| 2031 | $3,262 Mn | +7.73% | - | - | Forecast | |
| 2032 | $3,513 Mn | +7.69% | - | - | Forecast |
Industrial Robot Installations
542,000 units, 2024, global. Sustained installations above half a million units annually create recurring demand for scanners embedded in robot cells, automated material handling and machine-safety systems. Asia accounted for 74% of installations.
Operational Industrial Robot Stock
4.664 million units, 2024, global. The expanding operational fleet supports replacement scanners, safety retrofits and navigation upgrades beyond new robot installations alone. Operational stock increased 9% from the prior year.
Professional Service Robot Sales
almost 200,000 units, 2024, global. Service-robot expansion widens the addressable market for compact 2D LiDAR in logistics, transportation, cleaning and inspection. Professional service robot sales increased 9% during 2024.
CHAPTER 6 - Segmentation
Market Segmentation Framework
Comprehensive analysis across key dimensions providing insights into market structure, customer requirements, technology choices and distribution patterns.
No of Segments
7
Dominant Segment
Application
Fastest Growing Segment
Technology
Scanning Angle
Application
End-Use Industry
Customer Type
Sales Channel
Technology
Geography
Key Segmentation Takeaways
Comprehensive analysis across all extracted segmentation dimensions providing insights into market structure, customer preferences, technology selection and distribution patterns.
Application
Navigation, collision avoidance, industrial profiling and safety applications form distinct revenue pools with different performance specifications. AGV and AMR navigation is becoming strategically central because planar scanning delivers an effective combination of range, computational efficiency and cost. Safety applications command stronger certification requirements, while profile measurement generates premium opportunities around dimensional accuracy and high-speed inline inspection.
Technology
Technology is the fastest-changing segmentation axis as suppliers improve scan rate, angular resolution, onboard processing and industrial networking. Pulse-ranging and time-of-flight architectures are well suited to mobile navigation and area monitoring, while triangulation remains important for high-precision profile measurement. The fastest value growth is expected in network-enabled scanners combining ranging, configurable fields, diagnostics and machine-safety functionality.
CHAPTER 7 - Regional Analysis
Regional Analysis
Asia-Pacific is assessed as the largest 2D laser scanner demand hub because manufacturing automation and mobile robotics are concentrated heavily in China, Japan, South Korea and other Asian production economies. North America and Europe remain premium markets for safety-certified and high-performance industrial scanners. Asia accounted for 74% of global industrial robot deployments in 2024.
Global Regional Ranking Leader
Asia-Pacific, 1st
Asia-Pacific Market Size (2025)
USD 690 Mn
Asia-Pacific CAGR (2026-2032)
9.1%
Global Regional Ranking Leader
Asia-Pacific, 1st
Asia-Pacific Market Size (2025)
USD 690 Mn
Asia-Pacific CAGR (2026-2032)
9.1%
Regional Analysis (Current Year)
Regional Analysis Comparison
Market Position
Asia-Pacific ranks first in the 2025 2D laser scanner model at approximately USD 690 million, supported by the region's 74% share of global industrial robot installations in 2024.
Growth Advantage
Asia-Pacific's modeled 9.1% CAGR exceeds North America's 7.1% and Europe's 6.8%, reflecting faster automation deployment and China's 295,000 industrial robot installations in 2024.
Competitive Strengths
Asia combines 401,000-plus estimated 2024 robot installations, China's operational stock above 2 million units and strong sensor manufacturing ecosystems in Japan, China and South Korea.
CHAPTER 8 - INDUSTRY ANALYSIS
Growth Drivers, Challenges & Opportunities
Comprehensive analysis of key factors shaping the Global 2D Laser Scanners Market, including growth catalysts, operational challenges, and emerging opportunities across production, distribution, automation and end-user segments.
Growth Drivers
Expansion of Industrial Automation Installed Base
- The operational industrial robot stock reached 4.664 million units in 2024 globally, expanding the retrofit and replacement pool for safety, navigation and measurement sensors beyond new equipment demand.
- Asia captured 74% of new industrial robot installations in 2024, directing scanner suppliers toward Asian OEM partnerships, local distribution and application engineering capacity.
- China installed 295,000 industrial robots in 2024, creating scale benefits for navigation, machine-safety and automated inspection ecosystems that integrate planar laser sensing.
Rapid Commercialization of Mobile Robots
- Professional service robot sales increased 9% in 2024, creating incremental demand for compact scanners used in localization, navigation and dynamic obstacle detection.
- Robot-as-a-service fleets expanded 31% in 2024, increasing the economic importance of sensor uptime, standardized interfaces and field-replaceable scanner modules for fleet operators.
- Mobile safety laser scanners are forecast to grow at 8.28% CAGR through 2031, faster than stationary safety scanners as AMR and AGV fleets proliferate.
Improving Range, Connectivity and Functional Safety
- KEYENCE's SZ-V platform offers an 8.4-meter protection zone, illustrating continued performance expansion for flexible machine guarding and automation layouts.
- Leuze's RSL 400 supports an operating range of up to 8.25 meters with measurement-value output for AGV and AMR navigation, supporting combined safety and navigation architectures.
- Pepperl+Fuchs' R2000 provides 360-degree scanning, expanding use cases in omnidirectional navigation, freight measurement and industrial field monitoring.
Market Challenges
Substitution Pressure from 3D Sensing
- The 3D laser-scanner segment is projected to reach USD 6.77 billion by 2035, forcing 2D suppliers to defend applications where planar sensing offers sufficient performance at lower complexity.
- The 2D segment is projected from USD 1.94 billion in 2024 to USD 4.39 billion by 2035, confirming growth but also a competitive shift toward richer spatial data in advanced applications.
- Global 3D scanning is reported at a 10.1% CAGR from 2025-2030, raising the risk that high-value inspection and digital-twin workloads migrate from 2D toward 3D solutions.
Installation Cost and Environmental Sensitivity
- Safety laser scanners require installation, programming and maintenance, increasing total ownership costs for smaller manufacturers despite a market expected to grow at 6.2% CAGR through 2035.
- Oil, dust and grease can cause unwanted trips in demanding industrial environments, creating productivity penalties where scanners are deployed around 24/7 automated operations.
- Stationary scanners represented 58.5% of safety laser scanner revenue in 2025, showing that proven fixed installations still dominate where environmental control and predictable safety zones reduce operational risk.
Certification and Integration Complexity
- Driverless industrial trucks are governed by ISO 3691-4:2023 safety requirements, making certified integration a commercial prerequisite in many AGV and AMR applications.
- Laser products fall under optical safety requirements including IEC 60825-1:2014, requiring manufacturers to control accessible radiation and product classification.
- OMRON's OS32C is classified as a Type 3 safety laser scanner complying with IEC 61496-related requirements, illustrating the certification depth needed for machinery-safety applications.
Market Opportunities
Asia-Pacific Automation Localization
- China's 295,000 robot installations in 2024 support local OEM supply agreements, sensor customization and high-volume scanner platforms for manufacturing and logistics automation.
- India installed a record 9,100 industrial robots in 2024, up 7%, supporting an emerging demand pool for lower-cost scanners, integrator partnerships and localized application engineering.
- Japan maintained 450,500 industrial robots in operational stock in 2024, sustaining replacement demand and advanced sensor integration opportunities across mature factory automation installations.
Premium Networked Safety and Navigation Platforms
- Leuze's RSL 400 offers up to four parallel protective functions, creating opportunities for scanner vendors to monetize software-configurable safety functionality rather than hardware range alone.
- KEYENCE offers a warning zone extending to 26 meters on the SZ-V platform, demonstrating the willingness of industrial customers to procure higher-performance scanners for complex layouts.
- Pepperl+Fuchs' R2000 supports scan rates of up to 50 Hz in industrial implementations, enabling higher-value freight measurement, navigation and fast material-handling applications.
Safety Retrofit and Intralogistics Expansion
- Safety laser scanner revenue is forecast to reach USD 719.68 million by 2031, supporting investment in certified scanner portfolios, service capability and channel coverage.
- Conveyor and packaging lines represented 32.60% of safety scanner revenue in 2025, identifying material handling and intralogistics as a monetizable retrofit segment.
- Mobile safety scanners are forecast at 8.28% CAGR through 2031, supporting product development aimed at battery-efficient AMRs, configurable fields and compact mobile platforms.
CHAPTER 9 - Competitive Landscape
Competitive Landscape Overview
Competition is moderately concentrated among established industrial sensor and automation companies, while specialist LiDAR and profile-measurement vendors compete through scan range, safety certification, angular coverage, integration software and application-specific performance.
Market Share Distribution
Top 5 Players
Market Dynamics
8 new entrants in the past 5 years, indicating strong market attractiveness and growth potential.
Company Name | Market Share | Headquarters | Founding Year | Core Market Focus |
|---|---|---|---|---|
SICK AG | - | Waldkirch, Germany | 1946 | Industrial LiDAR, safety laser scanners, automation sensing |
HOKUYO AUTOMATIC CO., LTD. | - | Osaka, Japan | 1946 | 2D scanning rangefinders, LiDAR, AGV and mobile robot sensing |
KEYENCE Corporation | - | Osaka, Japan | 1974 | Safety laser scanners, factory automation and measurement sensors |
OMRON Corporation | - | Kyoto, Japan | 1933 | Machine safety, safety laser scanners and industrial automation |
Pepperl+Fuchs SE | - | Mannheim, Germany | 1945 | 2D LiDAR, industrial ranging and automation sensors |
Leuze electronic GmbH + Co. KG | - | Owen, Germany | 1963 | Safety laser scanners, intralogistics and industrial sensor systems |
Banner Engineering Corp. | - | Minneapolis, United States | 1966 | Safety laser scanners and machine-safety automation products |
IDEC Corporation | - | Osaka, Japan | 1945 | Safety laser scanners and human-machine safety systems |
Pilz GmbH & Co. KG | - | Ostfildern, Germany | 1948 | Safe automation, safety laser scanning and machinery protection |
Micro-Epsilon Messtechnik GmbH & Co. KG | - | Ortenburg, Germany | 1968 | 2D/3D laser profile scanners and precision industrial measurement |
Cross Comparison Parameters
The report provides detailed cross-comparison of key players across 10 performance parameters to identify competitive strengths and weaknesses.
Maximum Scanning Range
Angular Coverage and Scan Rate
Scanner-Segment Revenue Growth
R&D Intensity
Analysis Covered
Market Share Analysis:
Benchmarks competitive positioning across major global scanner suppliers and specialists
Cross Comparison Matrix:
Compares product performance, technology capability, economics and commercial positioning globally
SWOT Analysis:
Evaluates strategic strengths, weaknesses, market opportunities and competitive threats systematically
Pricing Strategy Analysis:
Assesses premiumization, channel margins, specifications and application-led pricing differences globally
Company Profiles:
Reviews company footprint, portfolio positioning, capabilities and strategic market focus
CHAPTER 10 - REPORT TOC
Table of Contents
Market Assessment Phase
Supply-side and competitive intelligence covering market sizing, segmentation, competitive dynamics, regulatory landscape, and future forecasts.
Go-To-Market Strategy Phase
15 chapters
Entry strategy evaluation, execution roadmap, partner recommendations, and profitability outlook.
Survey Phase
8 chapters
Demand-side primary research conducted through structured interviews and online surveys with end users across priority metros and Tier 2/3 cities to capture consumption behavior, unmet needs, and purchase drivers.
Complete Report Coverage
201+ detailed sections covering every aspect of the market
143
Assessment Sections
58
Strategy Sections
CHAPTER 11 - Our Approach
Research Methodology
Desk Research
- Mapped global 2D scanner suppliers
- Reviewed industrial robotics deployment statistics
- Assessed laser safety standards evolution
- Benchmarked scanner specifications and applications
Primary Research
- Industrial automation product managers interviewed
- Robotics system integrators interviewed
- Machine safety engineers interviewed globally
- LiDAR procurement managers interviewed globally
Validation and Triangulation
- Validated findings across 284 respondents
- Cross-checked OEM and integrator demand
- Reconciled scanner values and volumes
- Validated regional automation intensity assumptions
CHAPTER 12 - FAQ
FAQs
Still have questions?
Our research team is here to help you find the right solution
CHAPTER 13 - Related Research
Explore Related Reports
Expand your market intelligence with complementary research across regions and adjacent markets.
Regional/Country ReportsRelated market analysis across key regions
Related market analysis across key regions
- Indonesia 2D Laser Scanners Market
- Vietnam 2D Laser Scanners Market
- Thailand 2D Laser Scanners Market
- Malaysia 2D Laser Scanners Market
- Philippines 2D Laser Scanners Market
Adjacent ReportsRelated markets and complementary research
Related markets and complementary research
- India Industrial Robotics Market Size, Share & Forecast, By Robot Type, Application & End-Use Industry, 2026-2031
- India Automated Guided Vehicle Market Outlook to 2030
- South Korea Machine Vision Systems Market
- Brazil Safety Compliance Technology Market
- Belgium Sensor Fusion Solutions Market
500+
Market Research Reports
50+
Countries Covered
15+
Industry Verticals