Global In-line UV-Vis Spectroscopy Market Outlook to 2030

Region:Global

Author(s):Naman Rohilla

Product Code:KROD6536

Published On

December 2024

Total pages

89

About the Report

Global In-line UV-Vis Spectroscopy Market Overview

  • The Global In-line UV-Vis Spectroscopy Market is valued at USD 436 million. This market size has been driven primarily by advancements in real-time monitoring technology and the increasing adoption of automation in industries like pharmaceuticals, food and beverages, and chemical processing. In-line UV-Vis spectroscopy is widely used in manufacturing processes to ensure product quality by enabling real-time monitoring and analysis, reducing the need for off-line testing. These factors have contributed to the growth trajectory of the market based on a detailed five-year analysis of historical market data.
  • Countries like the United States, Germany, and Japan are leading the market due to their strong industrial bases and high demand for precision-based quality control. These regions have a well-established pharmaceutical and chemical industry, which contributes to the adoption of in-line spectroscopy solutions. Additionally, government regulations mandating stringent quality standards and the presence of major spectroscopy equipment manufacturers in these regions have made them dominant players in the global market.
  • The FDA has stringent guidelines on the use of analytical instrumentation in manufacturing, particularly in the pharmaceutical sector. These guidelines mandate that companies use validated analytical methods to ensure product safety and efficacy. As of 2023, over 90% of pharmaceutical companies in the USA reported compliance with FDA guidelines on analytical instrumentation, including UV-Vis spectroscopy systems. The FDAs focus on process analytical technologies (PAT) as part of quality control has driven the adoption of in-line spectroscopy, particularly in the production of biologics and small-molecule drugs.

Global In-line UV-Vis Spectroscopy Market Size

Global In-line UV-Vis Spectroscopy Market Segmentation

  • By Product Type: The Global In-line UV-Vis Spectroscopy Market is segmented by product type into process UV-Vis spectrophotometers, fiber optic spectrometers, compact UV-Vis spectrometers, and scanning spectrophotometers. Among these, process UV-Vis spectrophotometers hold a dominant share due to their extensive application in industrial processes requiring continuous monitoring and quality control. Industries such as pharmaceuticals and food & beverages have increased the use of process spectrophotometers to meet strict quality standards, contributing to their market dominance.

Global In-line UV-Vis Spectroscopy Market Segmentation by Product Type

  • By Application: The market is segmented by application into pharmaceutical & biotechnology, chemical processing, food & beverage, environmental monitoring, and academic research. The pharmaceutical and biotechnology segment dominates due to the rising demand for real-time quality control in drug development and manufacturing. The need for precision, regulatory compliance, and the ability to detect and measure critical components in production lines have made UV-Vis spectroscopy indispensable in this industry.
  • By Region: The regional segmentation includes North America, Europe, Asia-Pacific, Latin America, and Middle East & Africa. North America leads the global market with the highest share due to the advanced industrial landscape and high adoption rates of automation technologies. The region's stringent quality standards and well-developed pharmaceutical and biotechnology industries are the primary drivers. Europe follows closely, with countries like Germany and the UK investing in technological advancements in process monitoring.

Global In-line UV-Vis Spectroscopy Market Segmentation by Region

Global In-line UV-Vis Spectroscopy Market Competitive Landscape

The Global In-line UV-Vis Spectroscopy Market is dominated by major players who focus on technological innovation, strategic partnerships, and continuous product development. Companies such as Agilent Technologies Inc., Thermo Fisher Scientific Inc., and PerkinElmer Inc. have made investments in R&D to enhance their product offerings. The competitive landscape is marked by the integration of advanced software solutions and real-time monitoring capabilities, making spectroscopy systems more efficient and user-friendly.

Company

Establishment Year

Headquarters

No. of Employees

Revenue (USD)

Global Presence

Product Innovation

R&D Investment

Key Partnerships

Technology Integration

Agilent Technologies Inc.

1999

Santa Clara, USA

-

-

-

-

-

-

-

Thermo Fisher Scientific Inc.

1956

Waltham, USA

-

-

-

-

-

-

-

PerkinElmer Inc.

1937

Waltham, USA

-

-

-

-

-

-

-

Shimadzu Corporation

1875

Kyoto, Japan

-

-

-

-

-

-

-

Horiba Ltd.

1945

Kyoto, Japan

-

-

-

-

-

-

-

Global In-line UV-Vis Spectroscopy Market Analysis

Global In-line UV-Vis Spectroscopy Market Growth Drivers

  • Growing Demand for Quality Control in Manufacturing: The demand for quality control in manufacturing sectors, including pharmaceuticals, food & beverage, and chemicals, has surged due to stricter regulatory requirements and consumer demand for high-quality products. For example, the global pharmaceutical industry, valued at USD 1.42 trillion in 2022, heavily relies on in-line UV-Vis spectroscopy for real-time monitoring of production processes. Similarly, the food and beverage industry, valued at USD 8 trillion globally, has adopted these technologies to comply with food safety standards such as HACCP (Hazard Analysis Critical Control Point). This rise in adoption ensures efficient process management, reducing downtime and contamination risks.
  • Integration of Automation in Analytical Processes: Automation is revolutionizing the way analytical processes are conducted, especially in the use of in-line UV-Vis spectroscopy. In manufacturing, automation helps integrate real-time monitoring, ensuring that analytical data is immediately processed and used to make adjustments in production. As of 2023, nearly 45% of manufacturing companies globally have incorporated automation systems, according to IMF reports. This shift is essential for reducing human error and increasing operational efficiency. Automated systems in pharmaceutical production alone have resulted in a 15% reduction in production errors, supporting the adoption of in-line UV-Vis spectroscopy across different sectors.
  • Increasing Adoption in Academic and Research Institutions: Academic and research institutions are at the forefront of adopting in-line UV-Vis spectroscopy technologies, driven by the need for accurate and high-throughput analysis in research laboratories. The global expenditure on higher education research increased by 4% in 2022, amounting to over USD 640 billion, according to the World Bank. Universities and research centers are heavily investing in UV-Vis spectroscopy for applications in chemical, biological, and materials research. This growing interest has led to a 12% increase in the purchase of spectrometers by academic institutions, reflecting the expanding application of the technology in research.

Global In-line UV-Vis Spectroscopy Market Challenges

  • High Initial Investment Costs: The high initial costs associated with setting up in-line UV-Vis spectroscopy systems remain a challenge, particularly for small and medium-sized enterprises (SMEs). The average cost of advanced UV-Vis spectrophotometers ranges from USD 25,000 to USD 50,000, which is a investment for companies with limited capital. In 2023, nearly 60% of SMEs in emerging markets reported financial barriers to adopting advanced analytical technologies. This high cost of adoption, combined with the cost of integrating these systems with existing production lines, limits market penetration, particularly in sectors such as food and beverage manufacturing.
  • Technical Complexity in Operational Settings: In-line UV-Vis spectroscopy requires trained personnel to operate and maintain the systems, making it a technically complex solution for many industries. A study conducted by the International Labour Organization (ILO) in 2023 revealed that only 30% of manufacturing companies in developing regions have the required technical expertise to operate advanced analytical instruments. This lack of skilled labor presents a major barrier to the widespread adoption of these technologies, as companies struggle to find and retain qualified personnel to manage in-line spectroscopy systems effectively.

Global In-line UV-Vis Spectroscopy Market Future Outlook

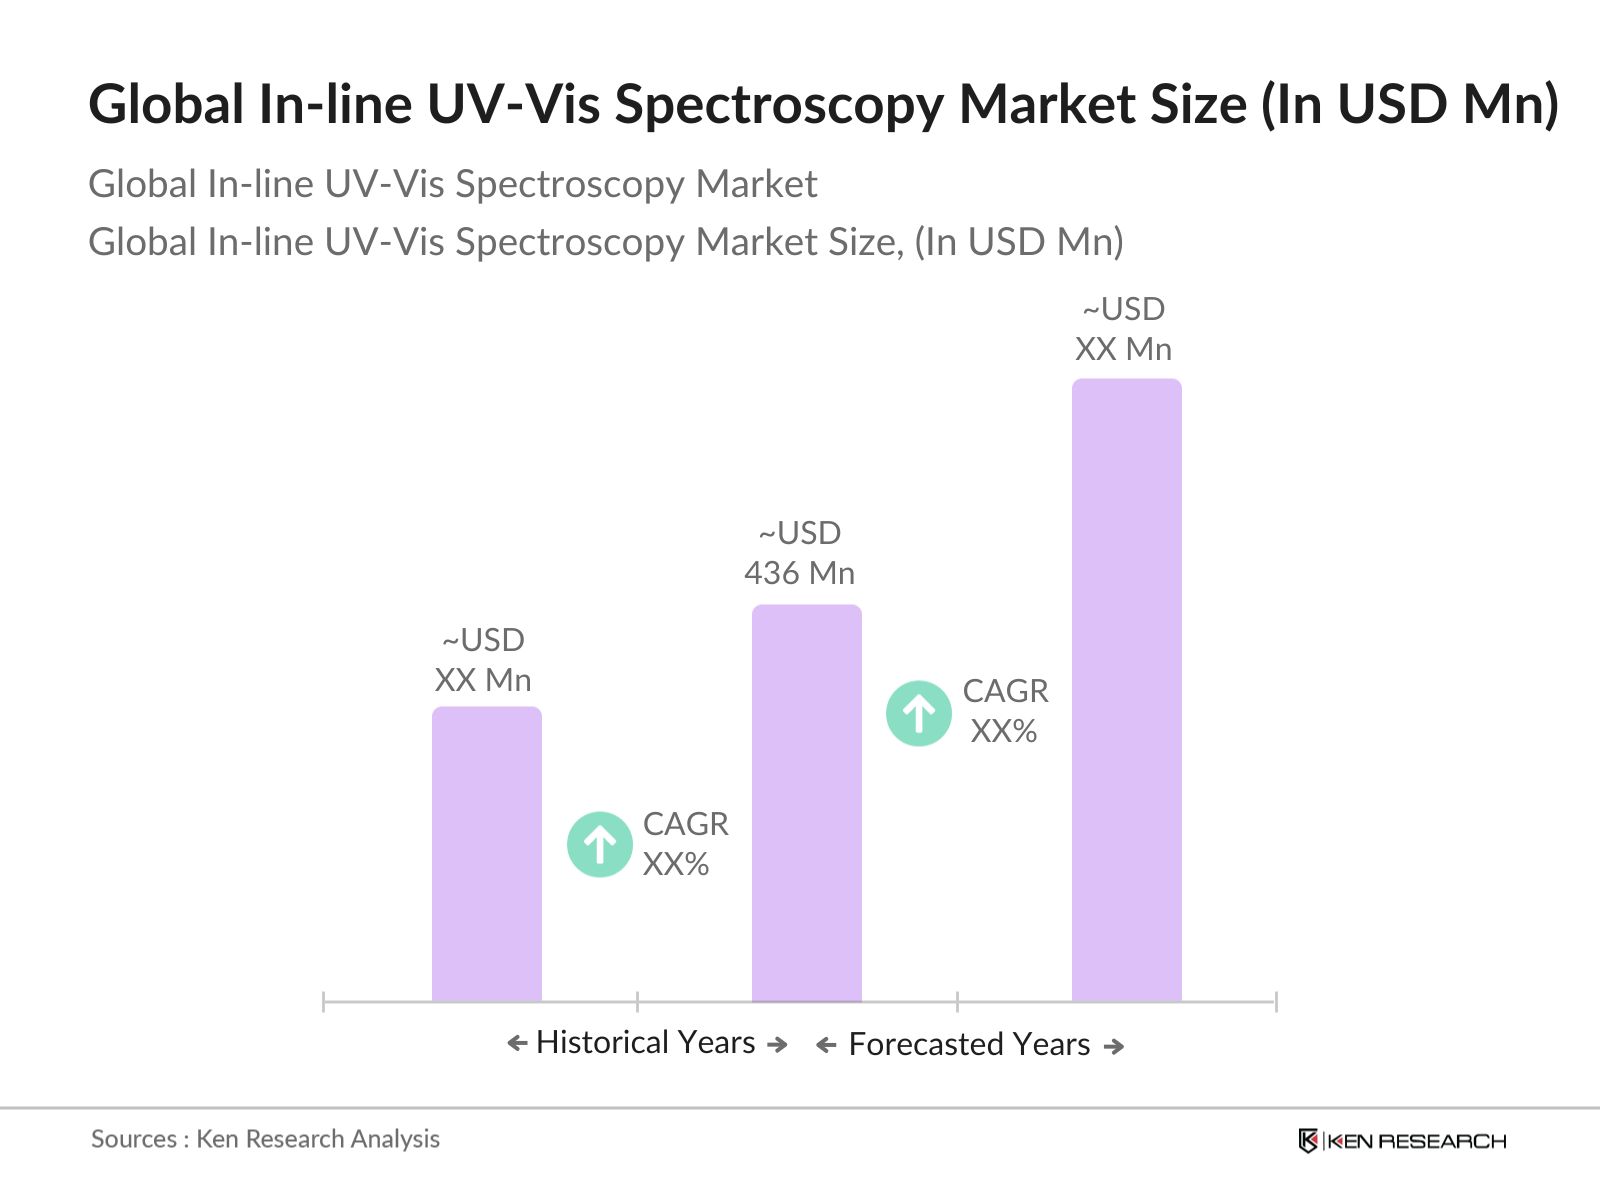
Over the next five years, the Global In-line UV-Vis Spectroscopy Market is expected to witness considerable growth. This is primarily driven by advancements in real-time analytical technologies, the integration of AI and IoT into monitoring systems, and the growing need for quality control across industries like pharmaceuticals and chemical processing. The increasing demand for precision in production processes, coupled with technological innovations in spectroscopy instruments, is likely to drive market expansion further.

Global In-line UV-Vis Spectroscopy Market Opportunities

  • Emergence of Real-time Monitoring Systems: The increasing demand for real-time monitoring systems in industries like biopharmaceuticals and chemicals presents a substantial growth opportunity for in-line UV-Vis spectroscopy. Real-time systems are becoming essential for reducing process times and ensuring product consistency. In 2023, around 58% of pharmaceutical companies reported the use of real-time analytical technologies, as noted by government health agencies. This growing adoption rate, combined with the need for more precise control over production processes, opens new avenues for in-line spectroscopy, particularly in sectors requiring stringent quality control, such as drug manufacturing.
  • Expansion in Biopharmaceuticals and Advanced Material Science: The biopharmaceutical industry, valued at over USD 345 billion in 2023, is expected to drive demand for in-line UV-Vis spectroscopy as companies focus on innovation in biologics and advanced materials. The technology is particularly useful for monitoring complex molecular structures, which are critical in drug formulation and material science applications. Over 75% of biopharmaceutical companies surveyed in 2023 indicated plans to increase investment in process analytical technologies (PAT), including in-line spectroscopy, as part of their quality assurance protocols. This surge in demand provides substantial growth potential for the spectroscopy market.

Scope of the Report

Product Type

Process UV-Vis Spectrophotometers

Fiber Optic Spectrometers

Compact UV-Vis Spectrometers

Scanning Spectrophotometers

Application

Pharmaceutical & Biotechnology

Chemical Processing

Food & Beverage

Environmental Monitoring

Academic Research

End-User

Manufacturing Industries

R&D Laboratories

Quality Assurance/Quality Control Departments

Wavelength Range

Visible Spectroscopy

Ultraviolet Spectroscopy

Extended Wavelength Spectroscopy

Region

North America

Europe

Asia-Pacific

Latin America

Middle East & Africa

Products

Key Target Audience

  • Pharmaceutical and Biotechnology Manufacturers

  • Chemical Processing Companies

  • Food & Beverage Industry

  • Banks and Financial institutions

  • Quality Assurance/Control Departments

  • Research & Development Laboratories

  • Government and Regulatory Bodies (FDA, EU Directives)

  • Investors and Venture Capitalist Firms

  • Automation Solution Providers

Companies

Players Mentioned in the Report

  • Agilent Technologies Inc.

  • Thermo Fisher Scientific Inc.

  • PerkinElmer Inc.

  • Shimadzu Corporation

  • Horiba Ltd.

  • Ocean Insight

  • Hach Company

  • ABB Analytical

  • Sartorius AG

  • Hitachi High-Technologies Corporation

Table of Contents

1. Global In-line UV-Vis Spectroscopy Market Overview

1.1. Definition and Scope
1.2. Market Taxonomy
1.3. Market Growth Rate
1.4. Market Segmentation Overview

2. Global In-line UV-Vis Spectroscopy Market Size (In USD Mn)

2.1. Historical Market Size
2.2. Year-On-Year Growth Analysis
2.3. Key Market Developments and Milestones

3. Global In-line UV-Vis Spectroscopy Market Analysis

3.1. Growth Drivers

3.1.1. Advancements in Analytical Technologies

3.1.2. Growing Demand for Quality Control in Manufacturing (Pharmaceutical, Food & Beverage, Chemicals)

3.1.3. Integration of Automation in Analytical Processes

3.1.4. Increasing Adoption in Academic and Research Institutions

3.2. Market Challenges

3.2.1. High Initial Investment Costs

3.2.2. Technical Complexity in Operational Settings

3.2.3. Limited Penetration in Developing Economies

3.3. Opportunities

3.3.1. Emergence of Real-time Monitoring Systems

3.3.2. Expansion in Biopharmaceuticals and Advanced Material Science

3.3.3. Collaboration with Industry 4.0 and IoT Technologies

3.4. Trends

3.4.1. Shift Towards Cloud-based Analytical Solutions

3.4.2. Miniaturization of In-line Spectroscopy Instruments

3.4.3. AI-driven Analytical Insights for Enhanced Process Efficiency

3.5. Government Regulations

3.5.1. FDA Guidelines on Analytical Instrumentation

3.5.2. EU Directives for Process Analytical Technologies

3.5.3. Quality Standards for UV-Vis Spectroscopy in Industrial Settings

3.6. SWOT Analysis

3.7. Porters Five Forces Analysis

3.8. Stake Ecosystem

3.9. Competition Ecosystem

4. Global In-line UV-Vis Spectroscopy Market Segmentation

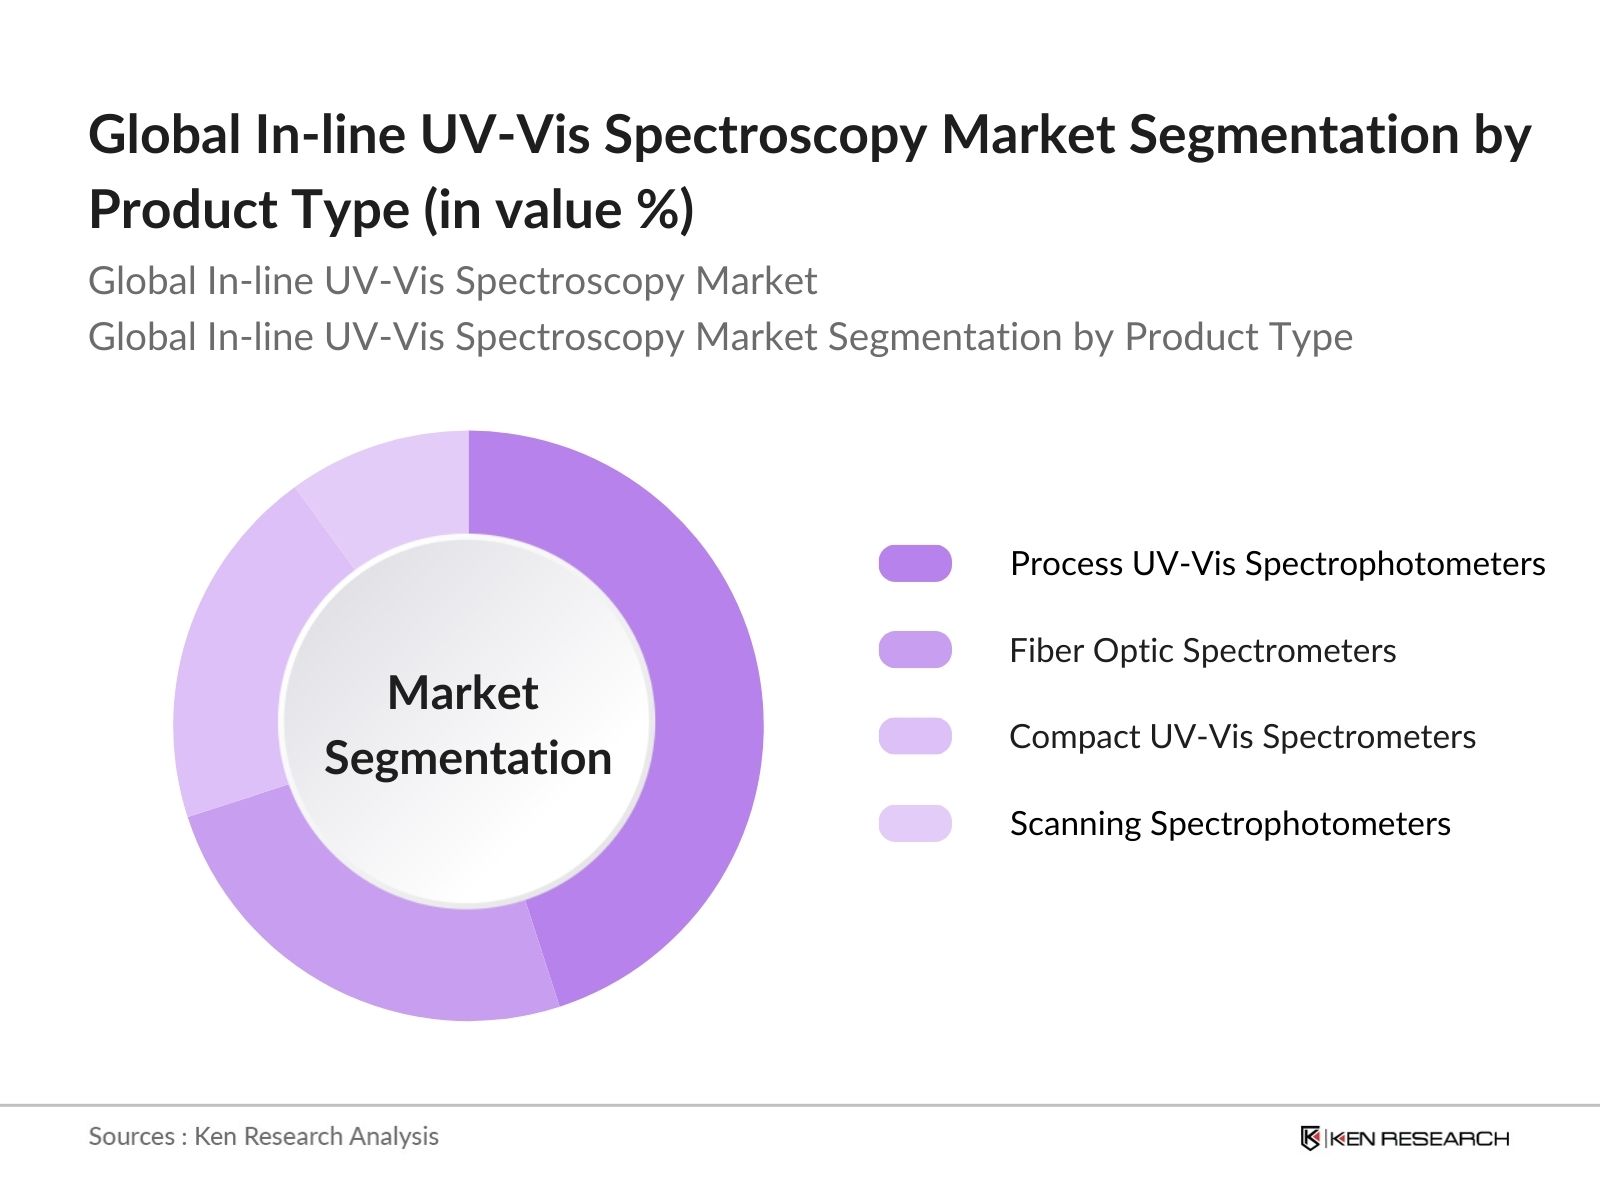
4.1. By Product Type (In Value %)

4.1.1. Process UV-Vis Spectrophotometers

4.1.2. Fiber Optic Spectrometers

4.1.3. Compact UV-Vis Spectrometers

4.1.4. Scanning Spectrophotometers

4.2. By Application (In Value %)

4.2.1. Pharmaceutical & Biotechnology

4.2.2. Chemical Processing

4.2.3. Food & Beverage Industry

4.2.4. Environmental Monitoring

4.2.5. Academic Research

4.3. By End-User (In Value %)

4.3.1. Manufacturing Industries

4.3.2. R&D Laboratories

4.3.3. Quality Assurance/Quality Control Departments

4.4. By Wavelength Range (In Value %)

4.4.1. Visible Spectroscopy (400700 nm)

4.4.2. Ultraviolet Spectroscopy (200400 nm)

4.4.3. Extended Wavelength Spectroscopy (1901100 nm)

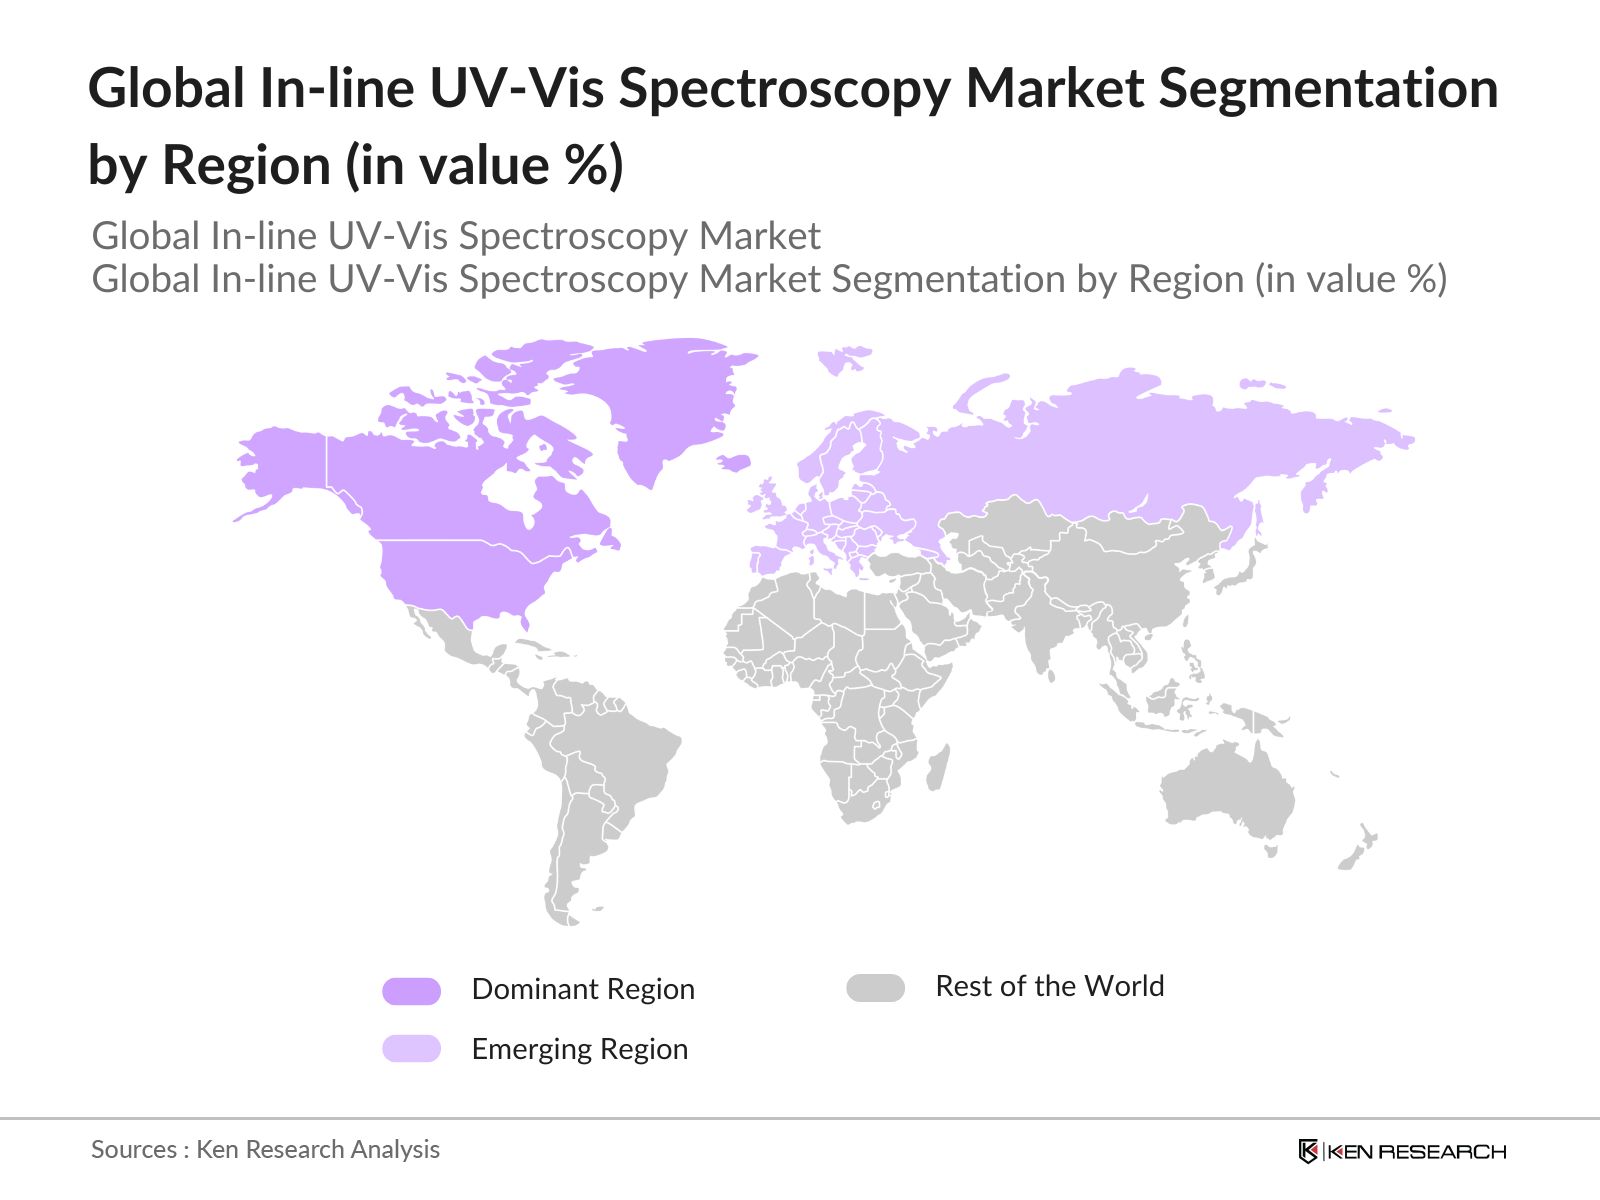
4.5. By Region (In Value %)

4.5.1. North America

4.5.2. Europe

4.5.3. Asia-Pacific

4.5.4. Latin America

4.5.5. Middle East & Africa

5. Global In-line UV-Vis Spectroscopy Market Competitive Analysis

5.1. Detailed Profiles of Major Competitors (In-depth profiles of 15 key competitors)

5.1.1. Agilent Technologies Inc.

5.1.2. Thermo Fisher Scientific Inc.

5.1.3. PerkinElmer Inc.

5.1.4. Shimadzu Corporation

5.1.5. Ocean Insight

5.1.6. Horiba Ltd.

5.1.7. Jasco Inc.

5.1.8. Hitachi High-Technologies Corporation

5.1.9. Hach Company

5.1.10. ABB Analytical

5.1.11. Metrohm AG

5.1.12. Mettler-Toledo International Inc.

5.1.13. Sartorius AG

5.1.14. Xenon Corporation

5.1.15. StellarNet Inc.

5.2. Cross Comparison Parameters (Headquarters, No. of Employees, Revenue, Product Innovation, Market Share, Global Presence, Product Portfolio, Technological Collaboration)

5.3. Market Share Analysis (In Value %)
5.4. Strategic Initiatives (Key partnerships, collaborations, and innovation strategies)
5.5. Mergers and Acquisitions
5.6. Investment Analysis (Venture capital and private equity involvement)
5.7. Key R&D Initiatives

6. Global In-line UV-Vis Spectroscopy Market Regulatory Framework

6.1. Industry-Specific Compliance and Standards
6.2. Validation and Calibration Requirements
6.3. Environmental and Safety Regulations

7. Global In-line UV-Vis Spectroscopy Future Market Size (In USD Mn)

7.1. Future Market Size Projections
7.2. Key Factors Driving Future Market Growth

8. Global In-line UV-Vis Spectroscopy Future Market Segmentation

8.1. By Product Type (In Value %)
8.2. By Application (In Value %)
8.3. By End-User (In Value %)
8.4. By Wavelength Range (In Value %)
8.5. By Region (In Value %)

9. Global In-line UV-Vis Spectroscopy Market Analysts Recommendations

9.1. TAM/SAM/SOM Analysis
9.2. Customer Cohort Analysis
9.3. Emerging Markets and Opportunities
9.4. Technological White Space Opportunity Analysis

Disclaimer Contact Us

Research Methodology

Step 1: Identification of Key Variables

This phase involved mapping all stakeholders in the global UV-Vis spectroscopy market. Secondary data from proprietary databases and industry sources were used to identify crucial variables influencing market dynamics, including technological trends and regulatory mandates.

Step 2: Market Analysis and Construction

Historical data on market penetration and revenue generation was gathered, along with a ratio analysis of in-line spectroscopy installations versus off-line solutions. This helped in constructing a robust understanding of market growth trends.

Step 3: Hypothesis Validation and Expert Consultation

Industry experts were consulted through CATIs to validate key hypotheses about market trends and technological innovations. These insights were crucial in corroborating and fine-tuning our research findings.

Step 4: Research Synthesis and Final Output

In the final stage, extensive data was collected directly from manufacturers to validate insights about product performance, market demand, and technological advancements, ensuring a comprehensive, validated report.

Frequently Asked Questions

01. How big is the Global In-line UV-Vis Spectroscopy Market?

The Global In-line UV-Vis Spectroscopy Market is valued at USD 436 million and is primarily driven by advancements in real-time monitoring technologies across several industries, including pharmaceuticals and food & beverage.

02. What are the challenges in the Global In-line UV-Vis Spectroscopy Market?

Challenges in the Global In-line UV-Vis Spectroscopy Market include high initial investment costs, technical complexity in process settings, and limited penetration in developing economies where the infrastructure for real-time monitoring is still evolving.

03. Who are the major players in the Global In-line UV-Vis Spectroscopy Market?

Key players in the Global In-line UV-Vis Spectroscopy Market include Agilent Technologies Inc., Thermo Fisher Scientific Inc., PerkinElmer Inc., Shimadzu Corporation, and Horiba Ltd.. These companies dominate the market due to their innovative solutions and global presence.

04. What are the growth drivers of the Global In-line UV-Vis Spectroscopy Market?

Growth drivers in the Global In-line UV-Vis Spectroscopy Market include increasing demand for real-time quality control, advancements in spectroscopy technology, and integration with automation systems in industries such as pharmaceuticals, chemicals, and food processing.

Why Buy From Us?

RRR
Refine Robust Result (RRR) Framework

What makes us stand out is that our consultants follows Robust, Refine and Result (RRR) methodology. i.e. Robust for clear definitions, approaches and sanity checking, Refine for differentiating respondents facts and opinions and Result for presenting data with story

Our Reach Is Unmatched

We have set a benchmark in the industry by offering our clients with syndicated and customized market research reports featuring coverage of entire market as well as meticulous research and analyst insights.

Research
Shifting the Research Paradigm

While we don't replace traditional research, we flip the method upside down. Our dual approach of Top Bottom & Bottom Top ensures quality deliverable by not just verifying company fundamentals but also looking at the sector and macroeconomic factors.

Insite
More Insights-Better Decisions

With one step in the future, our research team constantly tries to show you the bigger picture. We help with some of the tough questions you may encounter along the way: How is the industry positioned? Best marketing channel? KPI's of competitors? By aligning every element, we help maximize success.

Trust
Transparency and Trust

Our report gives you instant access to the answers and sources that other companies might choose to hide. We elaborate each steps of research methodology we have used and showcase you the sample size to earn your trust.

support
Round the Clock Support

If you need any support, we are here! We pride ourselves on universe strength, data quality, and quick, friendly, and professional service.

Why Client Choose Us?

400000+ Reports in repository
150+ Consulting project a year
100+ Analysts
8000+ Client Queries in 2022