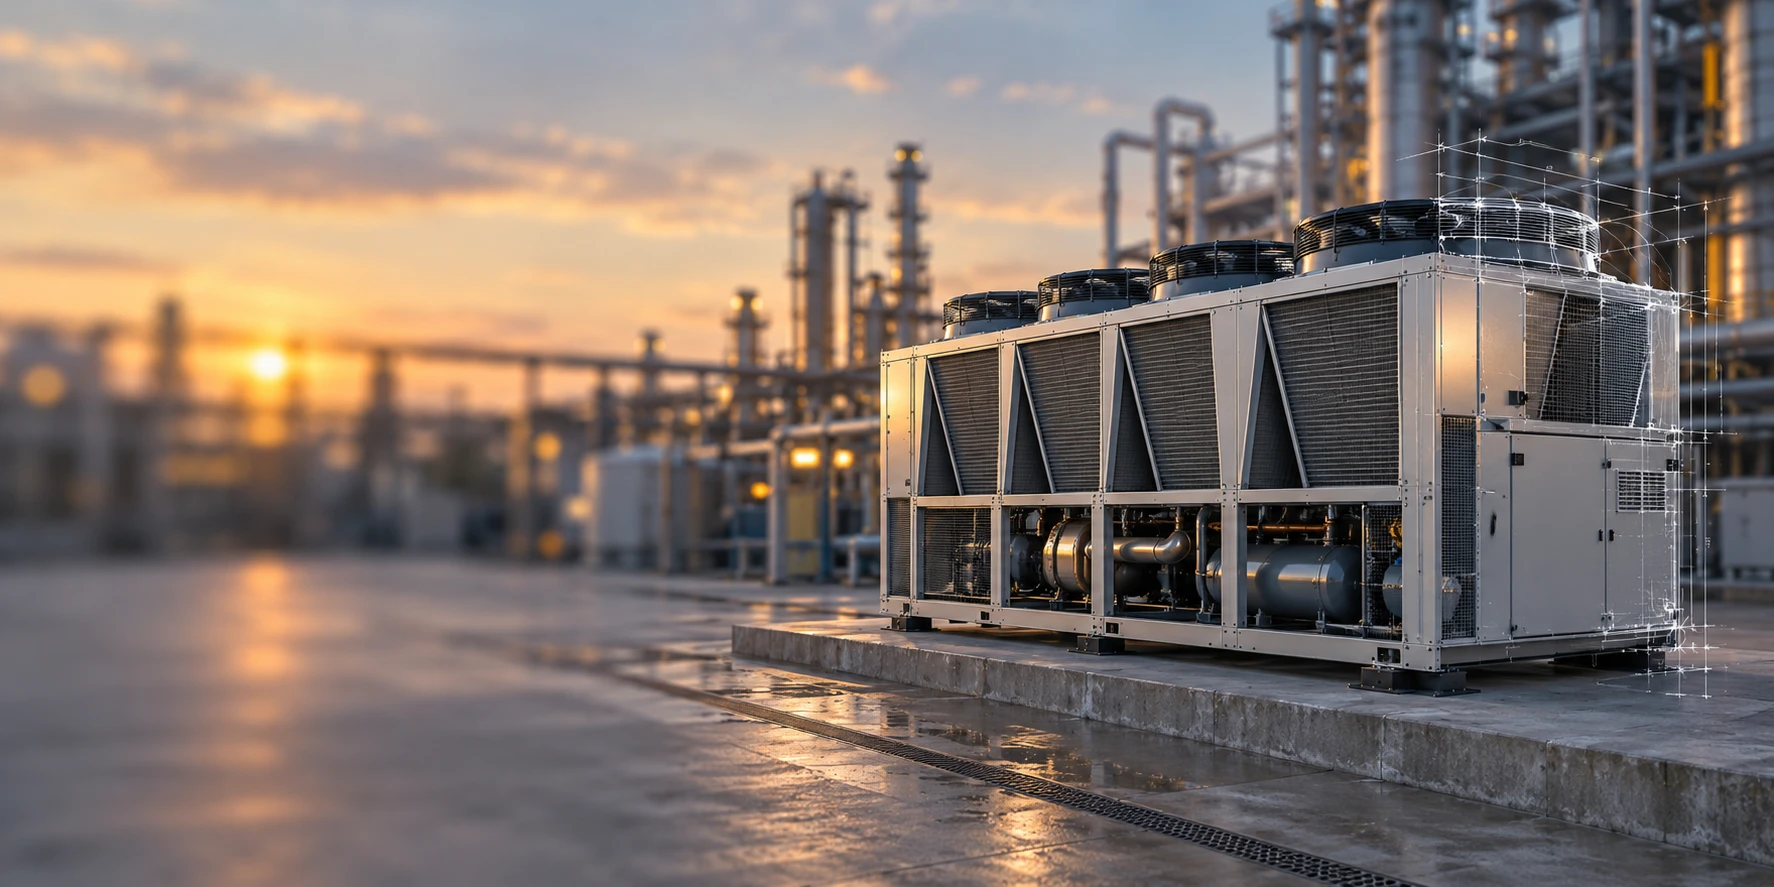
CHAPTER 1 - MARKET SUMMARY
Market Overview
The Global Industrial Cooling Systems Market is an equipment-and-system market built around heat removal from manufacturing processes, utility assets, food and pharmaceutical production, and mission-critical digital infrastructure. The 2025 operating model indicates about 950,000 systems shipped or commissioned globally, with a blended equipment-and-system ASP near USD 23,500 per unit. This makes specification quality, lifecycle efficiency and uptime central to procurement economics.
Asia Pacific is the principal expansion hub because China, India, Japan and Southeast Asia combine large manufacturing bases with accelerating digital infrastructure. Fortune Business Insights places Asia Pacific at 39.13% of global revenue in 2025, while other publishers use narrower definitions and report lower shares. The consistent signal is regional leadership or near-leadership, reinforced by an above-global growth profile.
Market Value
USD 22,320 Mn
2025
Dominant Region
Asia Pacific
2025
Dominant Segment
Water-Cooled Systems
2025
Total Number of Players
1,200+
Future Outlook
The base forecast extends the pre-validated 2025-2030 trajectory to 2032 without changing the authoritative 2025 market size or the supplied 2030 value. Market value rises from USD 22,320 Mn in 2025 to USD 33,620 Mn by 2032, equivalent to a 6.03% CAGR. Growth is stronger than the projected unit-volume CAGR because the mix shifts toward liquid cooling, hybrid and adiabatic heat rejection, low-GWP systems, larger-capacity equipment and digital controls. The extension assumes annual value growth moderates after 2030 as hyperscale retrofit intensity normalizes and standard equipment remains exposed to component price competition.
The historical model implies a 6.07% CAGR from 2020 to 2025, compared with about 4.16% annualized unit growth, showing that specification and pricing mix have already contributed to value expansion. Through 2032, annual unit volume is modeled at about 1.25 million systems, while the blended ASP increases to roughly USD 26,900 per unit. The most important upside is sustained AI infrastructure buildout; the key downside is slower industrial capex or faster commoditization. An external 2032 benchmark of USD 31,300 Mn provides an independent lower-range cross-check.
6.03%
Forecast CAGR
USD 33,620 Mn
2030 Projection
Base Year
2025
Historical Period
2020-2025
Forecast Period
2025-2032
Historical CAGR
6.07%
CHAPTER 2 - SCOPE OF REPORT
Scope of the Market
CHAPTER 3 - Key Stakeholders
Key Target Audience
Key stakeholders who can leverage from this market analysis for investment, strategy, and operational planning.
Investors
CAGR, premium mix, service margins, capex risk
Corporates
cooling TCO, uptime, water intensity, energy efficiency
Government
refrigerants, water efficiency, grid resilience, industrial policy
Operators
thermal load, redundancy, maintenance, lifecycle optimization
Financial institutions
project finance, replacement cycles, demand stability, covenants
CHAPTER 4 - Market Size & Growth
Market Size, Growth Forecast and Trends
This section evaluates the historical market size, analyzes year-over-year growth dynamics, and presents forecast projections supported by market performance indicators and demand-side drivers.
Historical & Projected Market Size ($ Million)
Year-over-Year Growth Rate (%)
Market Value vs Volume Growth (%)
Historical Market Performance (2020-2025)
The modeled historical series rises from USD 16,625 Mn in 2020 to the locked USD 22,320 Mn base in 2025, a 6.07% CAGR. The 2020 anchor is independently supported by Allied Market Research, while intermediate years are normalized estimates designed to bridge to the authoritative 2025 base without adopting any single syndicated publisher's changing scope. Unit volume increases from about 775,000 to 950,000 systems, indicating that value growth outpaced physical unit growth as efficiency, capacity and control sophistication improved.
Forecast Market Outlook (2025-2032)
The supplied forecast remains unchanged through 2030 at USD 30,240 Mn and is extended to USD 33,620 Mn in 2032 using a decelerating long-run growth profile. The seven-year forecast CAGR is 6.03%, while modeled unit volume reaches about 1.25 million systems at a 3.98% CAGR. Blended ASP expands from roughly USD 23,495 to USD 26,923 per unit as liquid cooling, hybrid heat rejection, low-GWP equipment and advanced controls gain mix. External 2032 estimates around USD 31,300 Mn remain within a reasonable validation range.
CHAPTER 5 - Market Data
Market Breakdown
The market's value trajectory reflects both rising equipment volumes and a shift toward higher-efficiency, higher-capacity thermal architectures. For CEOs and investors, the critical mix indicators are the persistence of water-cooled systems, the rising data-center contribution and the premiumization of hybrid and adiabatic platforms.
Year | Market Size (USD Mn) | YoY Growth (%) | Water-Cooled Systems Share (%) | Data-Center End-Use Share (%) | Hybrid/Adiabatic Systems Share (%) | Period |
|---|---|---|---|---|---|---|
| 2020 | $16,625 Mn | +- | 37.0% | 9.5% | Forecast | |
| 2021 | $17,450 Mn | +4.96% | 37.4% | 10.2% | Forecast | |
| 2022 | $18,460 Mn | +5.79% | 38.0% | 11.0% | Forecast | |
| 2023 | $19,620 Mn | +6.28% | 38.5% | 12.0% | Forecast | |
| 2024 | $20,910 Mn | +6.57% | 39.2% | 13.5% | Forecast | |
| 2025 | $22,320 Mn | +6.74% | 39.5% | 15.0% | Forecast | |
| 2026 | $23,770 Mn | +6.50% | 39.8% | 16.0% | Forecast | |
| 2027 | $25,370 Mn | +6.73% | 40.1% | 17.0% | Forecast | |
| 2028 | $26,970 Mn | +6.31% | 40.4% | 18.0% | Forecast | |
| 2029 | $28,590 Mn | +6.01% | 40.7% | 18.8% | Forecast | |
| 2030 | $30,240 Mn | +5.77% | 41.0% | 19.5% | Forecast | |
| 2031 | $31,900 Mn | +5.49% | 41.2% | 20.0% | Forecast | |
| 2032 | $33,620 Mn | +5.39% | 41.5% | 20.5% | Forecast |
Water-Cooled Systems Share
39.5% estimated share, 2025, global. Water-cooled architectures remain central where continuous thermal loads and heat-rejection efficiency outweigh water constraints. Grand View Research reported water-cooling systems at more than 39% of 2024 product revenue, validating the model's base-year mix.
Data-Center End-Use Share
15.0% estimated share, 2025, global. The segment is expanding faster than traditional process demand because AI racks raise heat density and require integrated chilled-water, liquid-loop and heat-rejection systems. places data centers at roughly 15% of industrial cooling end use.
Hybrid/Adiabatic Systems Share
9.0% estimated share, 2025, global. Hybrid systems gain where water scarcity and energy efficiency must be balanced. Grand View Research identifies hybrid cooling as the fastest-growing product category, with growth above 9% through 2030, supporting a rising mix assumption.
CHAPTER 6 - Segmentation
Market Segmentation Framework
Comprehensive analysis across key dimensions providing insights into market structure, customer procurement, technology selection and route-to-market patterns.
No of Segments
7
Dominant Segment
Product Type
Fastest Growing Segment
Technology
Product Type
End-Use Industry
Application
Customer Type
Sales Channel
Technology
Geography
Key Segmentation Takeaways
Comprehensive analysis across all extracted segmentation dimensions providing insights into market structure, customer preferences and distribution patterns.
Product Type
Product architecture remains the most direct determinant of capital cost, energy use, water intensity and service requirements. Water-cooled systems retain the broadest installed-base relevance for large continuous loads, while evaporative and air-cooled systems address different climate and resource constraints. Hybrid and adiabatic variants increasingly bridge the efficiency-versus-water trade-off and support premium project economics.
Technology
Technology is the fastest-changing competitive dimension as buyers move toward variable-speed equipment, low-GWP refrigerants, liquid cooling, CDUs and predictive optimization. AI data centers accelerate the shift from room-level cooling to rack- and chip-adjacent thermal loops, while industrial users prioritize controls that reduce total energy and water consumption without compromising process uptime or product quality.
CHAPTER 7 - Regional Analysis
Regional Analysis
Regional allocation is normalized to the locked 2025 global market value. The split uses a coherent 2024 regional structure from Grand View Research as the primary allocation anchor, then cross-checks Asia Pacific leadership against Fortune Business Insights and The Business Research Company. Because publishers differ on data-center liquid cooling and commercial chiller inclusion, the values below are a consistent analytical allocation rather than a direct sum of syndicated estimates.
Largest Regional Market
Asia Pacific
Asia Pacific Market Size (2025)
USD 7,812 Mn
Asia Pacific CAGR (2025-2030)
8.4%
Largest Regional Market
Asia Pacific
Asia Pacific Market Size (2025)
USD 7,812 Mn
Asia Pacific CAGR (2025-2030)
8.4%
Regional Analysis (Current Year)
Regional Analysis Comparison
| Metric | Asia Pacific | North America | Europe | Latin America | Middle East and Africa |
|---|---|---|---|---|---|
| 2025 Market Size (USD Mn) | 7,812 | 5,803 | 6,250 | 1,339 | 1,116 |
| 2025-2030 CAGR | 8.4% | 5.8% | 6.5% | 5.5% | 6.0% |
Market Position
Asia Pacific leads the normalized 2025 allocation at 35.0%, while Fortune Business Insights reports a higher 39.13% share under its scope. Both indicate regional leadership or near-leadership, supported by manufacturing, power and digital-infrastructure investment.
Growth Advantage
Asia Pacific's industrial cooling CAGR is estimated at 8.4% through 2030, above North America's 5.8% and Europe's 6.5%. New-build manufacturing and infrastructure provide more unit growth than the replacement-heavy mature markets.
Competitive Strengths
Energy-efficient industrial cooling grows faster than the broader category, with regional CAGRs of 12.2% in Asia Pacific, 9.3% in North America and 8.8% in Europe, favoring variable-speed, low-GWP and water-efficient systems.
CHAPTER 8 - INDUSTRY ANALYSIS
Growth Drivers, Challenges & Opportunities
Comprehensive analysis of key factors shaping the Global Industrial Cooling Systems Market, including growth catalysts, operating constraints and monetizable opportunities across equipment, integration, services and industrial end-use.
Growth Drivers
AI and High-Density Data-Center Buildout
- Accelerated-server electricity consumption is projected to grow by roughly 30% annually in the IEA base case, materially increasing heat density.
- Cooling and other data-center infrastructure account for about 20% of the net increase in data-center electricity consumption through 2030.
- Schneider Electric's liquid-cooling portfolio targets 100 kW+ AI racks, illustrating the move toward megawatt-scale coolant distribution and integrated thermal chains.
Energy Efficiency and Low-GWP Regulation
- From 1 January 2027, specified stationary chillers face new GWP thresholds, including stricter rules for systems up to 12 kW and larger equipment.
- UNEP estimates global cooling demand could more than triple by 2050 under business as usual, increasing pressure for efficient equipment.
- UNEP's sustainable cooling pathway could reduce expected 2050 cooling emissions by 64%, reinforcing policy and buyer preference for efficient thermal systems.
Asia Pacific Industrial Capacity Expansion
- Grand View Research estimates Asia Pacific industrial cooling growth at roughly 8.4% to 8.9% through 2030, depending on its regional presentation.
- The energy-efficient industrial cooling submarket in Asia Pacific is projected to grow about 12.2% through 2030, indicating premiumization beyond unit demand.
- Asia Pacific also leads the industrial-chiller submarket, with an estimated 41.4% share in 2025, supporting the region's manufacturing and process-cooling intensity.
Market Challenges
Water Scarcity Constrains Conventional Heat Rejection
- At least 50% of the world's population experiences highly water-stressed conditions for at least one month each year, increasing scrutiny of cooling-water consumption.
- Water-cooled systems represent more than 39% of 2024 product revenue, so water constraints affect a large installed base rather than a niche architecture.
- Zero-water air-cooled designs are becoming more capable, with Johnson Controls launching a data-center chiller rated up to 3.5 MW in 2026.
Refrigerant Transition Raises Redesign and Service Complexity
- EU stationary-chiller restrictions tighten from 2027, forcing OEMs to qualify lower-GWP alternatives and adjust safety design where required.
- Further prohibitions affecting smaller stationary chillers take effect by 2032, extending compliance pressure through the report horizon.
- Low-GWP refrigerant capability is already embedded in major OEM portfolios; Trane markets data-center chillers using refrigerants such as R-1233zd and R-514A.
Data-Center Cooling Definitions Create Scope and Investment Risk
- Grand View Research estimates the dedicated data-center liquid-cooling market at USD 6,650 Mn in 2025.
- Astute Analytica reports a narrower USD 2,750 Mn in 2025, demonstrating how component and system boundaries can change the apparent market by more than twofold.
- Global Market Insights estimates the top five liquid-cooling vendors held about 35% share in 2025, indicating a concentrated high-growth niche inside a broader fragmented cooling market.
Market Opportunities
Liquid Cooling and CDU Integration for AI Factories
- Schneider Electric's newer CDU platform includes a 2.5 MW unit scalable toward 10 MW+, creating higher-value project content per facility.
- Johnson Controls' Silent-Aire CDU platform spans roughly 500 kW to more than 10 MW, demonstrating convergence between building cooling and direct liquid distribution.
- Trane water-cooled data-center chillers are offered at capacities up to 21 MW, supporting increasingly large thermal plants.
Hybrid, Adiabatic and Water-Saving Heat Rejection
- Hybrid cooling is identified as the fastest-growing industrial-cooling product group, with growth above 9% through 2030.
- WRI identifies 25 extremely water-stressed countries, strengthening the business case for dry and hybrid heat rejection in exposed industrial hubs.
- SPX Cooling Technologies markets dry, adiabatic, evaporative and hybrid-style heat-rejection platforms, enabling portfolio-based optimization by climate and water availability.
Controls, Lifecycle Services and Waste-Heat Optimization
- Daikin and NTT DATA launched a 2026-2027 proof of concept using AI to predict server thermal conditions and optimize data-center HVAC and chiller operation.
- Johnson Controls states that absorption-chiller designs can reduce chiller electricity use by more than 90% in suitable waste-heat configurations.
- Alfa Laval positions certified plate heat exchangers for data-center free cooling and heat-transfer duties, creating service and retrofit opportunities beyond compressor-based cooling.
CHAPTER 9 - Competitive Landscape
Competitive Landscape Overview
The market is moderately fragmented. Large HVAC and thermal-management groups compete with cooling-tower specialists and data-center thermal vendors, while hundreds of regional manufacturers serve standardized industrial applications. In the adjacent liquid-cooling niche, the top five vendors held about 35% in 2025.
Market Share Distribution
Top 5 Players
Market Dynamics
8 new entrants in the past 5 years, indicating strong market attractiveness and growth potential.
Company Name | Market Share | Headquarters | Founding Year | Core Market Focus |
|---|---|---|---|---|
Johnson Controls | - | Cork, Ireland | - | YORK chillers, liquid cooling, controls and lifecycle thermal services |
Daikin Industries | - | Osaka, Japan | - | Applied chillers, process cooling and data-center thermal systems |
Trane Technologies | - | Swords, Ireland | - | Trane chillers, process cooling, heat rejection and mission-critical systems |
SPX Technologies | - | Charlotte, North Carolina, USA | - | Marley cooling towers, fluid coolers, evaporative and adiabatic systems |
Alfa Laval | - | Lund, Sweden | - | Industrial heat exchangers, free cooling and thermal-transfer systems |
Schneider Electric | - | Rueil-Malmaison, France | - | Motivair liquid cooling, CDUs and integrated data-center thermal infrastructure |
Vertiv | - | Columbus, Ohio, USA | - | Critical digital infrastructure, air and liquid thermal-management systems |
Munters | - | Kista, Sweden | 1955 | Industrial air treatment, evaporative cooling and data-center climate solutions |
Baltimore Aircoil Company | - | Jessup, Maryland, USA | 1938 | Cooling towers, evaporative condensers, closed-circuit and hybrid cooling |
EVAPCO | - | Taneytown, Maryland, USA | 1976 | Industrial process cooling, cooling towers, evaporative and dry heat rejection |
Cross Comparison Parameters
The report provides detailed cross-comparison of key players across 10 performance parameters to identify competitive strengths and weaknesses.
Cooling Capacity Range
Water and Energy Efficiency Performance
Cooling-Segment Revenue Growth
Adjusted Operating Margin
Analysis Covered
Tier coverage: Tier 1 includes the ten profiled global and specialist players. Tier 2 comprises several hundred regional cooling-tower, chiller, heat-exchanger and systems integrators. Tier 3 includes an estimated 800+ small and informal fabricators concentrated primarily in China, India and Southeast Asia, especially in standardized cooling towers and evaporative equipment.
Revenue boundary: Competitive assessment counts only the identifiable cooling, heat-rejection, heat-transfer, liquid-cooling and related lifecycle-service activity relevant to this market. Total corporate revenue for diversified groups is not treated as market revenue.
Market Share Analysis:
Compares scoped cooling revenues across diversified and specialist competitors globally.
Cross Comparison Matrix:
Benchmarks capacity, efficiency, growth and profitability across leading suppliers.
SWOT Analysis:
Evaluates portfolio depth, channel reach, technology gaps and execution risks.
Pricing Strategy Analysis:
Assesses value premiums for efficiency, capacity, controls and service.
Company Profiles:
Summarizes industrial cooling focus, footprint, technology positioning and market role.
CHAPTER 10 - REPORT TOC
Table of Contents
Market Assessment Phase
Supply-side and competitive intelligence covering market sizing, segmentation, competitive dynamics, regulatory landscape, and future forecasts.
Go-To-Market Strategy Phase
15 chapters
Entry strategy evaluation, execution roadmap, partner recommendations, and profitability outlook.
Survey Phase
8 chapters
Demand-side primary research conducted through structured interviews and online surveys with end users across priority metros and Tier 2/3 cities to capture consumption behavior, unmet needs, and purchase drivers.
Complete Report Coverage
201+ detailed sections covering every aspect of the market
143
Assessment Sections
58
Strategy Sections
CHAPTER 11 - Our Approach
Research Methodology
Desk Research
- Review cooling-system company financial disclosures
- Map industrial thermal-management product portfolios
- Benchmark chiller and tower demand
- Track refrigerant and efficiency regulation
Primary Research
- Interview industrial cooling product directors
- Interview plant engineering procurement leaders
- Interview data-center facilities directors
- Interview EPC mechanical project managers
Validation and Triangulation
- 250-response cross-segment validation design
- Reconcile OEM and buyer estimates
- Check unit volumes against pricing
- Stress-test data-center scope boundaries
CHAPTER 12 - FAQ
FAQs
Still have questions?
Our research team is here to help you find the right solution
CHAPTER 13 - Related Research
Explore Related Reports
Expand your market intelligence with complementary research across regions and adjacent markets.
Regional/Country ReportsRelated market analysis across key regions
Related market analysis across key regions
- GCC industrial cooling systems market report size, share, growth drivers, trends, opportunities & forecast 2025–2030
- Oman industrial cooling systems market report size, share, growth drivers, trends, opportunities & forecast 2025–2030
- Indonesia Industrial Cooling Systems Market
- Vietnam Industrial Cooling Systems Market
- Thailand Industrial Cooling Systems Market
Adjacent ReportsRelated markets and complementary research
Related markets and complementary research
- Qatar Industrial Process Cooling Market
- Oman Commercial Refrigeration Systems Market
- Malaysia Data Center Cooling Solutions Market
- Kuwait Heat Exchanger Systems Market
- USA HVAC Equipment Market
500+
Market Research Reports
50+
Countries Covered
15+
Industry Verticals