CHAPTER 1 - MARKET SUMMARY
Market Overview
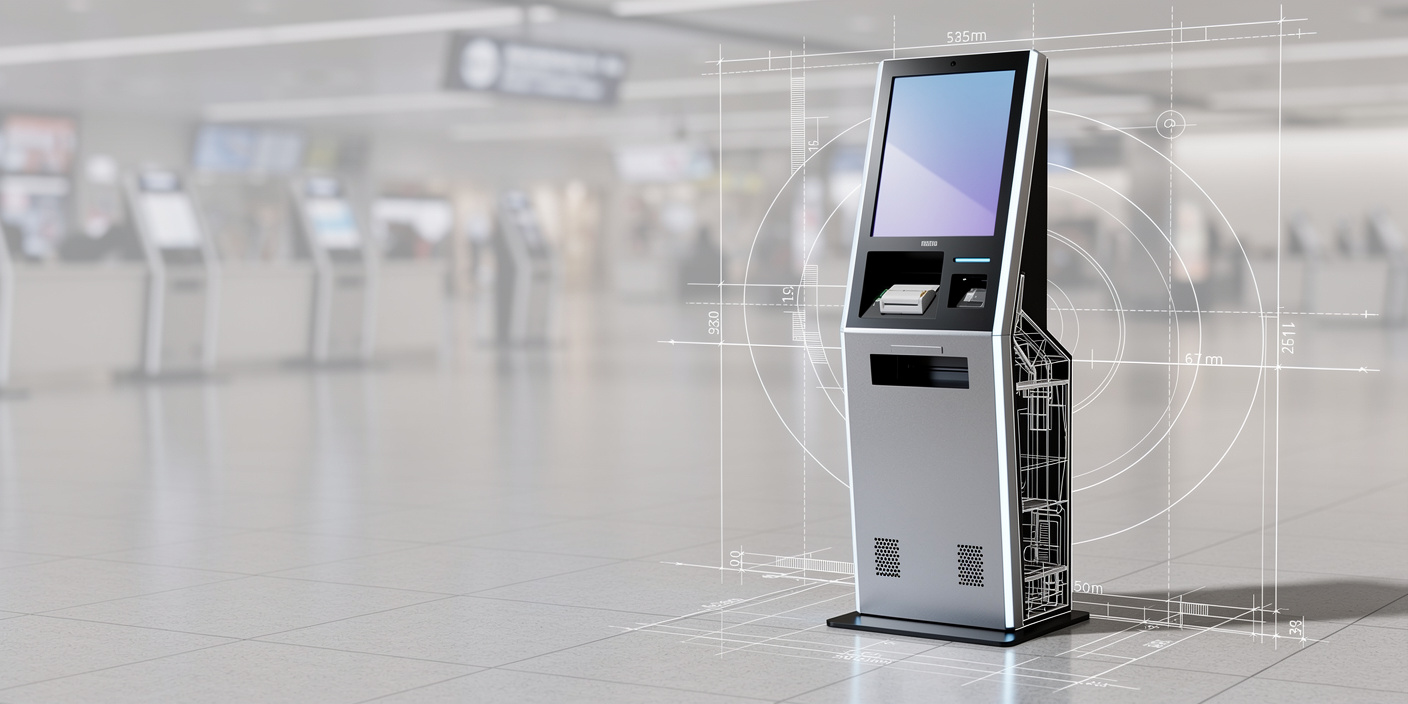
The Global Self-Service Kiosk Market combines purpose-built hardware, transaction software, payment acceptance, peripherals and lifecycle services into a unified automation stack. Commercial demand is supported by digital transaction readiness: 79% of adults globally held a financial account in 2025, widening the addressable base for payment-enabled kiosks across retail, transportation, banking and public services. Suppliers monetize equipment sales, subscriptions, maintenance and transaction-support services.
North America remained the largest regional hub with an estimated 33.0% of global revenue in 2025, reflecting dense retail networks, mature card acceptance and established field-service coverage. Asia Pacific followed at 31.0% and is becoming the deployment-volume center because manufacturing ecosystems, urban service digitization and high passenger flows support lower unit costs and larger fleet rollouts. Regional concentration shapes localization, procurement and support economics.
Market Value
USD 39.1 billion
2025
Dominant Region
North America
2025
Dominant Segment
Self-Checkout Kiosks
fastest growing, 2025
Total Number of Players
1,800
Future Outlook
The Global Self-Service Kiosk Market is projected to expand from USD 39.1 billion in 2025 to USD 67.2 billion by 2031, representing a 9.45% forecast CAGR. Growth will remain broad-based, but value creation will become increasingly concentrated in software, managed services and AI-enabled peripherals. Annual deployments and major upgrades are expected to rise from 3.95 million units in 2025 to 5.88 million units in 2031. Cashless-capable systems should represent 82% of annual deployments by 2031, while hybrid cash support remains important in public services, transportation and financially inclusive retail formats.
The forecast assumes stable enterprise capital spending, continued migration from staffed counters to assisted self-service and tighter security requirements. Hardware value growth moderates as component costs normalize, but revenue per deployed or substantially upgraded system rises from USD 9.90 thousand in 2025 to USD 11.43 thousand in 2031 because cloud orchestration, remote monitoring, computer vision and compliance services increase contract scope. Asia Pacific is expected to record the fastest regional CAGR at 11.2%, while North America retains the largest revenue pool through installed-base refresh cycles and higher software attachment rates.
9.45%
Forecast CAGR
$67,200 Mn
2030 Projection
Base Year
2025
Historical Period
2020-2025
Forecast Period
2026-2031
Historical CAGR
10.07%
CHAPTER 2 - SCOPE OF REPORT
Scope of the Market
CHAPTER 3 - Key Stakeholders
Key Target Audience
Key stakeholders who can leverage from this market analysis for investment, strategy, and operational planning.
Market sizing and trajectory
Policy and compliance mapping
Regional demand indicators
Segment structure and levers
Competitive landscape shortlist
CEO-grade risk priorities
CHAPTER 4 - Market Size & Growth
Market Size, Growth Forecast and Trends
This section evaluates the historical market size, analyzes year-over-year growth dynamics, and presents forecast projections supported by market performance indicators and demand-side drivers.
Historical & Projected Market Size ($ Million)
Year-over-Year Growth Rate (%)
Market Value vs Volume Growth (%)
Historical Market Performance (2020-2025)
Market value increased by USD 14.9 billion between 2020 and 2025. The trough was 2020, when hospitality and transportation deployments were deferred, while 2021 marked the first recovery year at 9.09% growth. The strongest annual expansion occurred in 2025 at 10.45%, supported by installed-base refreshes and larger software attachments. Deployment volume rose from 2.76 million to 3.95 million units, but value grew faster than units because payment security, remote management and integration increased average revenue per project.
Forecast Market Outlook (2026-2031)
Forecast growth remains near 9.4% annually, taking market value to USD 67.2 billion in 2031. Deployment volume reaches 5.88 million units, while software and services rise to 60% of value. The forecast implies more recurring revenue and higher lifecycle monetization rather than pure shipment expansion. Growth accelerates in AI-enabled self-checkout, transportation automation and public-service access, while replacement demand in North America and Europe supports a stable floor. Terminal-year value growth is 9.45%, broadly aligned with the six-year CAGR.
Scope Lock
Reconciliation Summary
CHAPTER 5 - Market Data
Market Breakdown
The Global Self-Service Kiosk Market combines a durable hardware base with expanding software and service economics. The trajectory is relevant to CEOs and investors because deployment growth, payment mix and recurring revenue attachment rates determine margin quality and capital intensity.
Year | Market Size (USD Mn) | YoY Growth (%) | Annual Deployments and Major Upgrades (Mn Units) | Cashless-Capable Share (%) | Software and Services Share (%) | Period |
|---|---|---|---|---|---|---|
| 2020 | $24,200 Mn | +- | 2.76 | 62% | Forecast | |
| 2021 | $26,400 Mn | +9.09% | 2.92 | 65% | Forecast | |
| 2022 | $29,100 Mn | +10.23% | 3.13 | 68% | Forecast | |
| 2023 | $32,100 Mn | +10.31% | 3.36 | 71% | Forecast | |
| 2024 | $35,400 Mn | +10.28% | 3.63 | 74% | Forecast | |
| 2025 | $39,100 Mn | +10.45% | 3.95 | 76% | Forecast | |
| 2026 | $42,800 Mn | +9.46% | 4.22 | 77% | Forecast | |
| 2027 | $46,900 Mn | +9.58% | 4.51 | 78% | Forecast | |
| 2028 | $51,300 Mn | +9.38% | 4.82 | 79% | Forecast | |
| 2029 | $56,100 Mn | +9.36% | 5.15 | 80% | Forecast | |
| 2030 | $61,400 Mn | +9.45% | 5.50 | 81% | Forecast | |
| 2031 | $67,200 Mn | +9.45% | 5.88 | 82% | Forecast |
Annual Deployments and Major Upgrades
3.95 million units, 2025, global. Scale creates service-density advantages for vendors with remote monitoring and field support. Global air traffic rose 10.4% in 2024, reinforcing airport and transit deployment pipelines.
Cashless-Capable Share
76%, 2025, global. Higher cashless penetration reduces mechanical complexity but raises payment-security obligations. PCI DSS v4.x moved 51 requirements into mandatory status on 31 March 2025.
Software and Services Share
54%, 2025, global. Recurring software and managed services improve revenue visibility and customer retention. NCR Voyix reported USD 1.91 billion of service revenue in 2025, demonstrating the scale of service-led economics in commerce infrastructure.
CHAPTER 6 - Segmentation
Market Segmentation Framework
Comprehensive analysis across key dimensions providing insights into market structure, customer requirements and distribution patterns.
No of Segments
7
Dominant Segment
Component
Fastest Growing Segment
Technology
Product Type
Component
End-Use Industry
Deployment Model
Payment Capability
Technology
Geography
Key Segmentation Takeaways
Comprehensive analysis across all extracted segmentation dimensions provides insights into market structure, customer requirements and distribution patterns.
Component
Hardware remains the deployment anchor, but software, managed services and integration collectively account for the larger value pool. Buyers increasingly evaluate total lifecycle cost, remote uptime and interoperability rather than enclosure price. Software is the most strategically important Level-2 sub-segment because orchestration, security, analytics and content layers support recurring revenue and cross-fleet standardization.
Technology
Computer Vision and AI is the fastest-growing Level-2 sub-segment as retailers and transportation operators seek lower intervention rates, stronger loss prevention and faster throughput. Biometric and voice-accessibility layers also expand addressable use cases. Growth depends on privacy controls, model accuracy and edge processing that limits latency while maintaining compliance across payment, identity and public-service environments.
CHAPTER 7 - Regional Analysis
Regional Analysis
North America led the 2025 global revenue pool, while Asia Pacific was the closest peer and is expected to become the largest deployment-volume region. Regional differences reflect payment readiness, retail density, passenger throughput, labor economics and accessibility regulation.
Focus Region Ranking
North America, 1st
Focus Region Market Size
USD 12.9 Bn (2025)
Focus Region CAGR (2026-2031)
8.4%
Focus Region Ranking
North America, 1st
Focus Region Market Size
USD 12.9 Bn (2025)
Focus Region CAGR (2026-2031)
8.4%
Regional Analysis (Current Year)
Market Position
North America ranked first with USD 12.9 billion in 2025, supported by mature retail automation, high card usage and dense national service networks.
Growth Advantage
Asia Pacific's 11.2% forecast CAGR exceeds North America's 8.4% and Europe's 8.7%, reflecting faster urban digitization and higher incremental deployment volumes.
Competitive Strengths
North America benefits from 95% modeled digital-payment usage, 86% cashless-capable deployments and a deep vendor ecosystem, while Europe gains from harmonized accessibility rules across 27 states.
CHAPTER 8 - INDUSTRY ANALYSIS
Growth Drivers, Challenges & Opportunities
Comprehensive analysis of key factors shaping the Global Self-Service Kiosk Market, including growth catalysts, operational challenges and emerging opportunities across production, distribution and customer segments.
Growth Drivers
Digital Payment Readiness
- Digital-payment usage in developing economies rose from 35% to 57% (2014-2021, World Bank), creating a larger user base for QR, wallet and contactless kiosk transactions. Vendors capture value through certified payment software, peripherals and transaction monitoring.
- Cashless-capable systems represent 76% (2025, global model) of deployments, reducing cash-handling maintenance while increasing demand for encryption, tokenization and remote security updates. Payment specialists and managed-service providers gain recurring revenue.
- PCI DSS v4.x moved 51 requirements (2025, global standard) into mandatory status, encouraging enterprises to refresh aging devices and controls. Qualified integrators gain from compliance assessments, fleet remediation and lifecycle support contracts.
Labor Reconfiguration and Throughput Economics
- The median cashier wage reached USD 14.99 per hour (2024, United States), improving kiosk breakeven economics in high-volume retail and foodservice locations. Operators capture value by redeploying staff toward fulfillment and customer assistance.
- Self-checkout represented about 30% of transactions (2021, surveyed retailers), showing that self-service is operationally material rather than experimental. Retailers benefit when lane design, item limits and supervision are optimized.
- Cashier openings remain 542,600 annually (2024-2034, United States) despite declining employment, signaling continued labor churn. Kiosks reduce dependence on constant recruitment but require better uptime and exception handling.
Passenger and Venue Digitization
- International passenger traffic expanded 13.6% (2024, global), increasing terminal pressure and the need for scalable common-use self-service. Airports, airlines and integrators benefit through faster processing and lower counter demand.
- Average passenger load factor reached a record 83.5% (2024, global), making throughput constraints more commercially costly. Automated check-in and bag-drop can defer terminal expansion and improve asset utilization.
- Traffic finished 3.8% above 2019 (2024, global), confirming that airport kiosk demand is supported by structural volumes rather than only post-pandemic recovery. Vendors with common-use software and biometric integration are positioned to capture value.
Market Challenges
Shrink, Fraud and Exception Costs
- Self-checkout systems require attendant intervention for age checks, scanning errors and payment exceptions, which can erode anticipated labor savings. Operators must model total exception cost rather than only cashier substitution.
- Computer vision and weight-validation upgrades raise capital requirements but can reduce unidentified-item and skip-scan losses. Vendors that demonstrate measurable false-positive control can defend higher software pricing and service margins.
- Retailers are limiting item counts or removing selected lanes where operational design is weak, creating replacement risk for undifferentiated hardware suppliers. Integrated analytics and staffed-assistance workflows become essential for renewal decisions.
Cybersecurity and Compliance Burden
- Distributed kiosks combine payment readers, operating systems, printers, cameras and network interfaces, widening the attack surface. Buyers increasingly require signed software, encrypted communications and centralized asset inventories.
- Legacy fleets often lack secure boot, modern operating systems or remote patch capability, forcing expensive replacement or segmented-network remediation. Managed-service providers benefit, but owners face higher lifecycle budgets and downtime risk.
- Cross-border deployments must reconcile payment, privacy, accessibility and data-localization rules. Vendors without modular compliance architectures face slower approvals and higher customization expense, weakening scalability.
Accessibility and User Experience Gaps
- Self-service terminals must support users with visual, auditory, motor and cognitive limitations, requiring reachable controls, audio guidance and consistent interaction patterns. Non-compliant fleets face redesign costs and procurement exclusion.
- Customer resistance increases when error states, bagging rules or payment flows are unclear. Poor usability can reduce loyalty and shift transactions back to staffed channels, weakening projected return on investment.
- Multilingual and accessible interfaces increase software testing complexity across device types. Vendors with reusable design systems and remote content management can convert compliance into a scalable competitive advantage.
Market Opportunities
AI-Enabled Loss Prevention and Assistance
- per-lane analytics, item-recognition and intervention software can be sold as recurring subscriptions, increasing lifetime value without replacing every enclosure.
- retailers reduce losses and attendant workload, while vendors gain higher-margin software revenue and proprietary operational data for continuous model improvement.
- deployments need calibrated cameras, edge computing, privacy controls and transparent exception logic to reduce false alerts and secure workforce acceptance.
Cloud Fleet Management and Managed Services
- device monitoring, remote updates, content orchestration, security logging and uptime guarantees can be bundled into multi-year per-device contracts.
- large operators gain one control plane across locations, while integrators improve revenue visibility and reduce field visits through predictive maintenance.
- open APIs, standardized telemetry and secure over-the-air updates are needed to manage mixed fleets without vendor lock-in or fragmented support processes.
Accessible Public and Healthcare Service Kiosks
- governments, hospitals and financial institutions can procure kiosks through managed-service or availability-based contracts, shifting upfront capital into predictable operating budgets.
- citizens gain extended service access, institutions reduce queueing pressure and integrators earn from identity, payment and workflow integration.
- accessibility certification, multilingual design, secure identity verification and human escalation channels must be embedded from procurement rather than retrofitted after deployment.
CHAPTER 9 - Competitive Landscape
Competitive Landscape Overview
The market is moderately fragmented: large platform vendors lead enterprise accounts, while specialist manufacturers compete through customization, vertical expertise, deployment speed and localized field-service capability.
Market Share Distribution
Top 5 Players
Market Dynamics
8 new entrants in the past 5 years, indicating strong market attractiveness and growth potential.
Company Name | Market Share | Headquarters | Founding Year | Core Market Focus |
|---|---|---|---|---|
NCR Voyix | 5.0% | Atlanta, United States | 1884 | Retail and restaurant self-service commerce platforms |
Diebold Nixdorf | 5.8% | North Canton, United States | 1859 | Retail self-checkout, banking automation and services |
Glory Global Solutions | 3.7% | Tokyo, Japan | 1918 | Cash automation, assisted self-service and transaction systems |
Fujitsu | 2.8% | Kawasaki, Japan | 1935 | Retail technology, self-checkout and customer service systems |
GRGBanking | 2.4% | Guangzhou, China | 1999 | Financial, retail and public-service self-service terminals |
Posiflex Technology | 1.8% | New Taipei City, Taiwan | 1984 | POS hardware and custom kiosk platforms |
Embross | 0.6% | Toronto, Canada | 1984 | Airline self-service, common-use and bag-drop solutions |
Meridian Kiosks | 0.5% | Aberdeen, United States | 1999 | Custom indoor, outdoor and digital self-service kiosks |
Olea Kiosks | 0.4% | Cerritos, United States | 1975 | Custom kiosk design and high-volume manufacturing |
REDYREF | 0.3% | Riverdale, United States | 1913 | Interactive kiosks, digital signage and queue solutions |
Cross Comparison Parameters
The report provides detailed cross-comparison of key players across 10 performance parameters to identify competitive strengths and weaknesses.
Analysis Covered
Market Share Analysis:
Estimates global kiosk revenue concentration across leading platform and hardware vendors.
Cross Comparison Matrix:
Benchmarks installed fleet, uptime, growth and recurring revenue performance.
SWOT Analysis:
Assesses capabilities, vulnerabilities, expansion options and competitive threats by company.
Pricing Strategy Analysis:
Compares hardware, software, services and lifecycle contract pricing models.
Company Profiles:
Reviews portfolio, geographic reach, vertical focus and operating differentiation.
CHAPTER 10 - REPORT TOC
Market Report Structure
Comprehensive coverage across three strategic phases — Market Assessment, Go-To-Market Strategy, and Survey — delivering end-to-end insights from market analysis and execution roadmap to customer demand validation.
Market Assessment Phase
Supply-side and competitive intelligence covering market sizing, segmentation, competitive dynamics, regulatory landscape, and future forecasts.
Go-To-Market Strategy Phase
15 chapters
Entry strategy evaluation, execution roadmap, partner recommendations, and profitability outlook.
Survey Phase
8 chapters
Demand-side primary research conducted through structured interviews and online surveys with end users across priority metros and Tier 2/3 cities to capture consumption behavior, unmet needs, and purchase drivers.
Complete Report Coverage
201+ detailed sections covering every aspect of the market
143
Assessment Sections
58
Strategy Sections
CHAPTER 11 - Our Approach
Research Methodology
Desk Research
- Reviewed kiosk vendor financial disclosures
- Mapped payment and accessibility regulations
- Analyzed passenger and retail indicators
- Benchmarked deployment and service economics
Primary Research
- Interviewed kiosk product directors
- Consulted retail operations executives
- Engaged payment security managers
- Surveyed field-service operations leaders
Validation and Triangulation
- Validated findings across 326 respondents
- Reconciled supply and demand estimates
- Tested deployment and pricing assumptions
- Reviewed regional adoption differentials
CHAPTER 12 - FAQ
FAQs
Still have questions?
Our research team is here to help you find the right solution
CHAPTER 13 - Related Research
Explore Related Reports
Expand your market intelligence with complementary research across regions and adjacent markets.
Regional/Country ReportsRelated market analysis across key regions
Related market analysis across key regions
- Indonesia Self-Service Kiosk Market
- Vietnam Self-Service Kiosk Market
- Thailand Self-Service Kiosk Market
- Malaysia Self-Service Kiosk Market
- Philippines Self-Service Kiosk Market
Adjacent ReportsRelated markets and complementary research
Related markets and complementary research
- Germany Self-Checkout Kiosks Market
- Egypt Point-of-Sale (POS) Terminal Market
- Qatar Digital Signage Solutions Market
- South Korea Automated Teller Machine (ATM) Market
- Qatar Retail Store Automation Market
500+
Market Research Reports
50+
Countries Covered
15+
Industry Verticals