
Global Smart TV Market Outlook 2030
Region:Global
Author(s):Shivani Mehra
Product Code:KROD11184
Region:Global
Author(s):Shivani Mehra
Product Code:KROD11184
December 2024
87
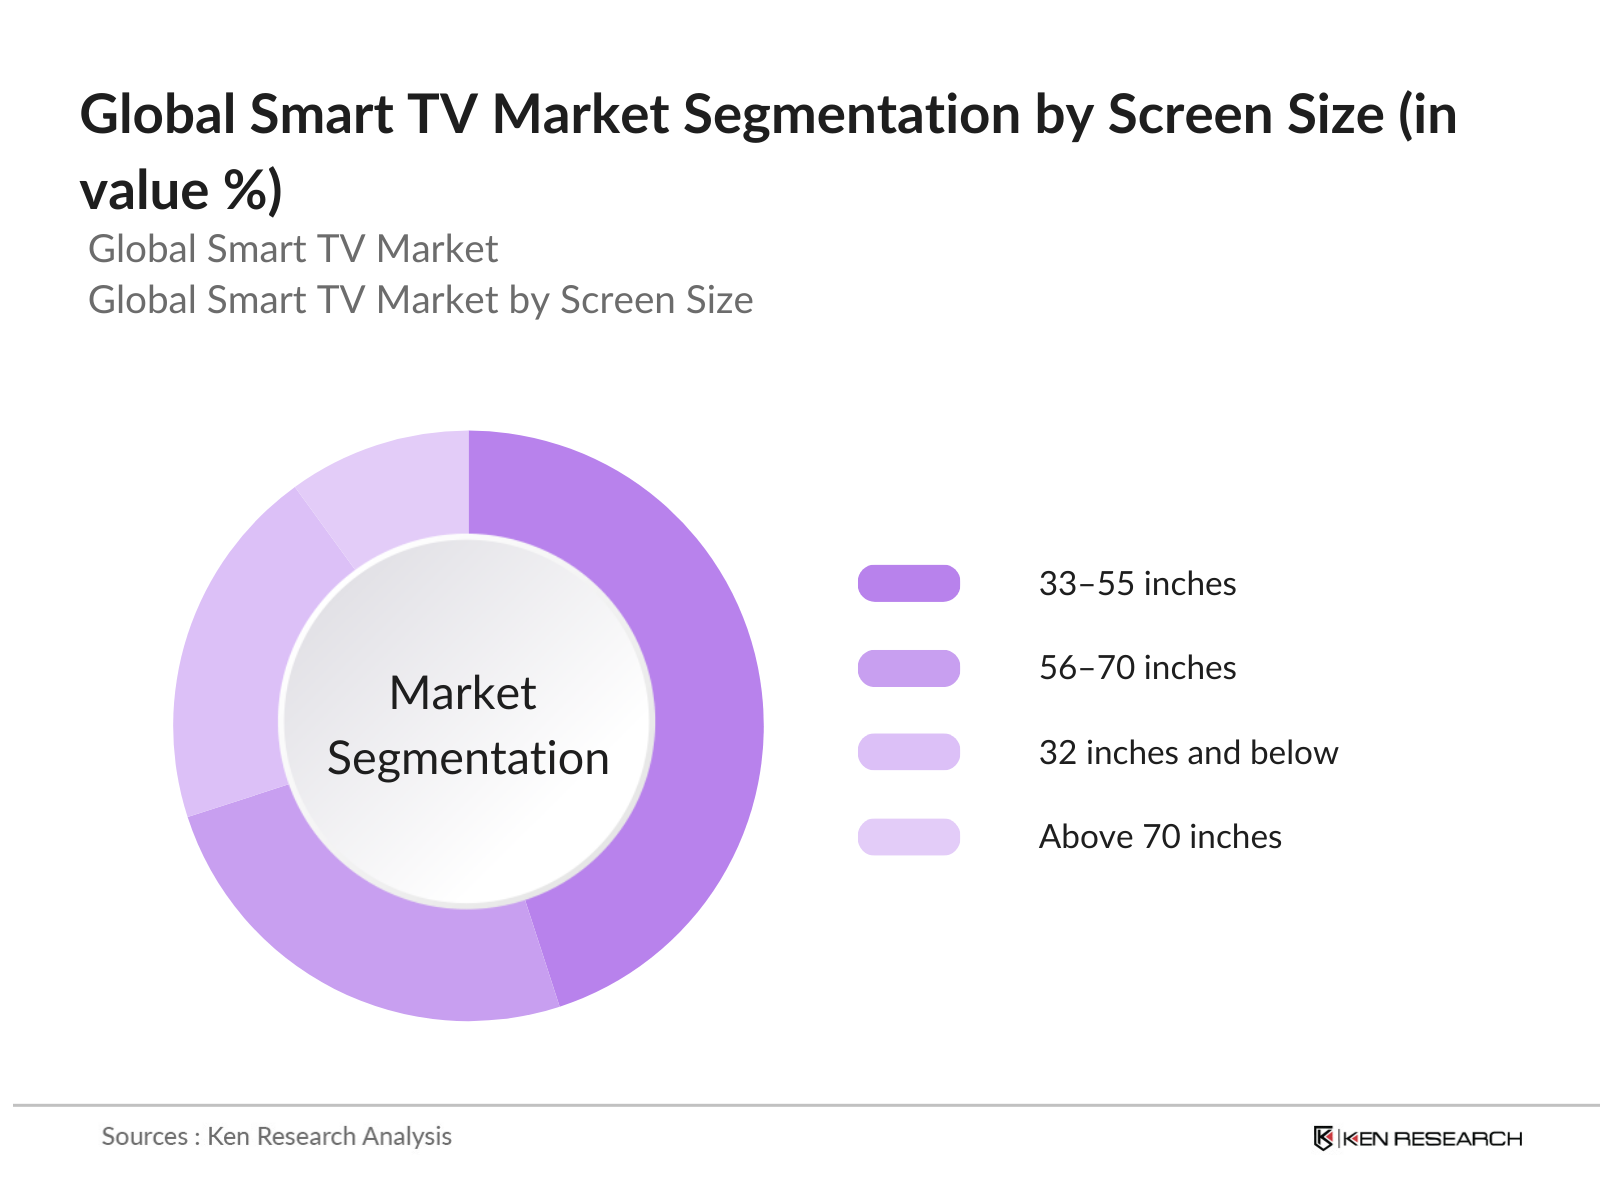
By Screen Size: The global smart TV market is segmented by screen size into 32 inches and below, 3355 inches, 5670 inches, and above 70 inches. Currently, the 3355 inch segment holds the dominant market share due to its widespread appeal, offering consumers an optimal balance between size and affordability. This segment has gained traction as it suits the typical living room setup and provides an enhanced viewing experience without requiring a premium investment. Major brands like Xiaomi and Hisense have strengthened this segment by offering competitively priced smart TVs, making them accessible to a broader audience and boosting their market presence.
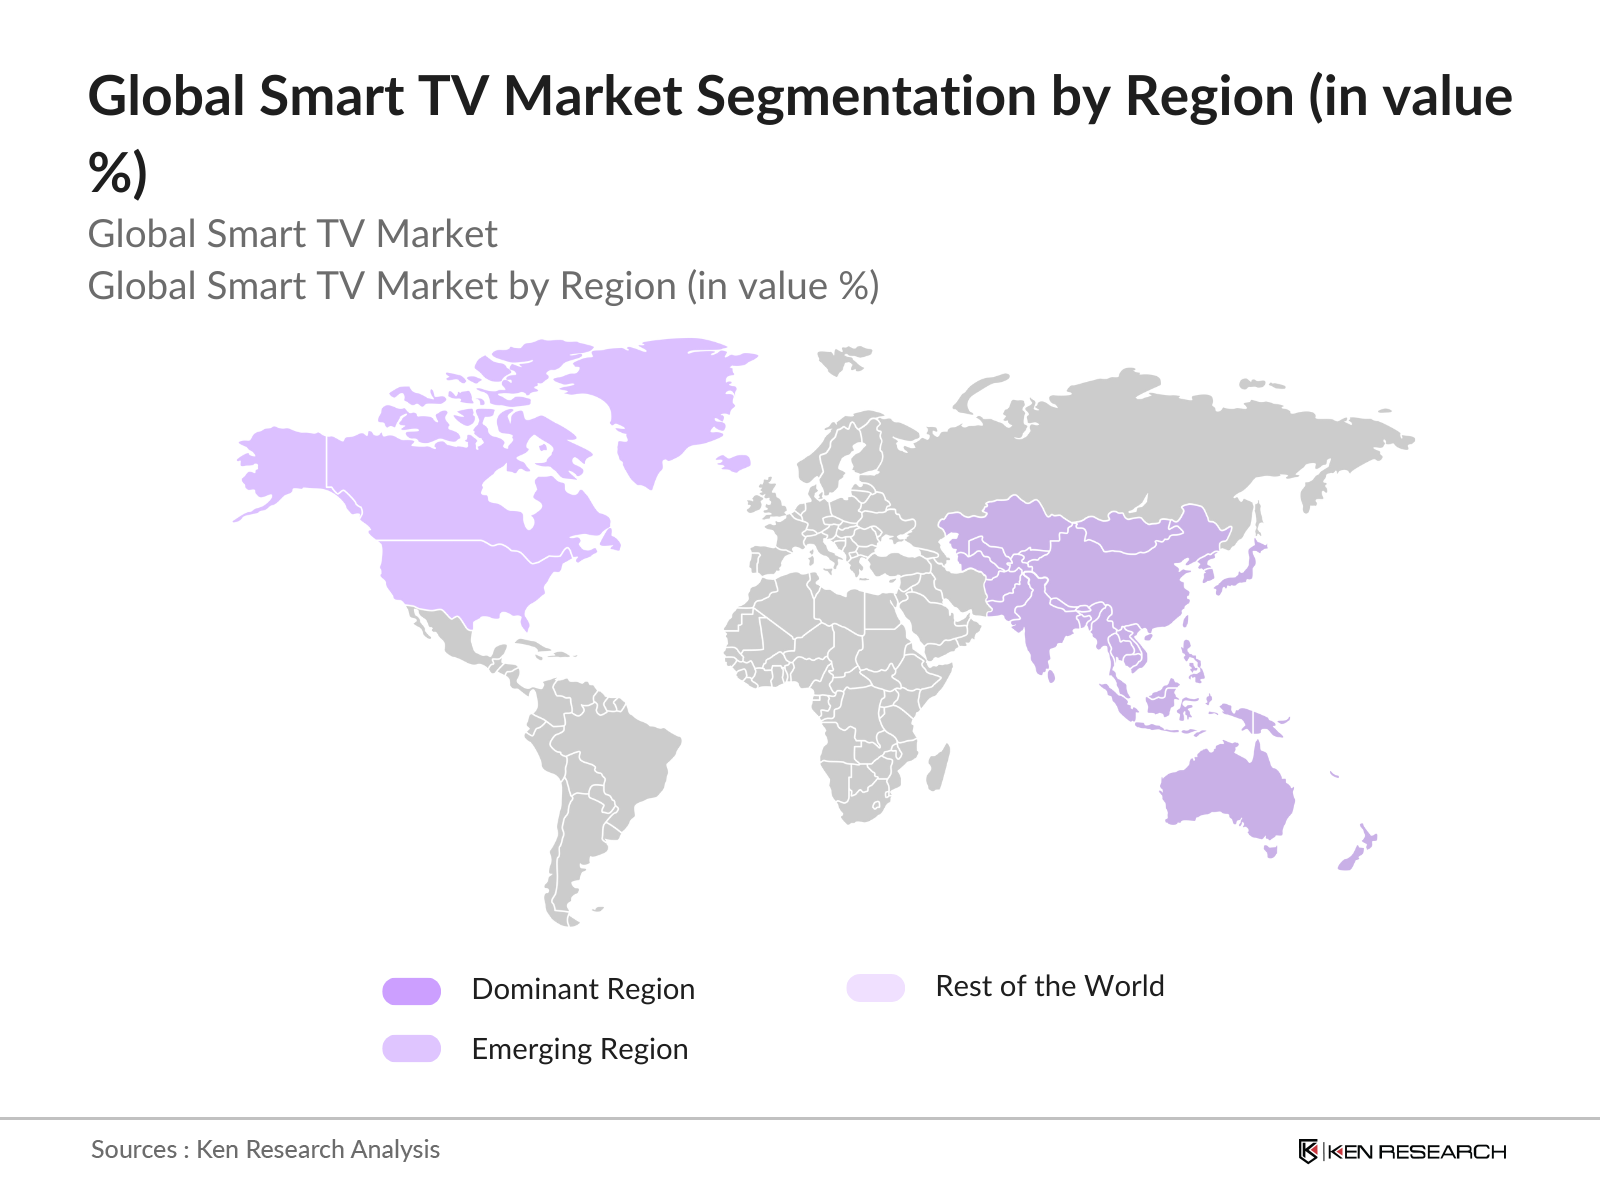
By Region: The global smart TV market is segmented by region into North America, Europe, Asia-Pacific, Middle East & Africa, and Latin America. Recently, Asia-Pacific has held the dominant market share, driven by the presence of leading manufacturers such as Samsung, LG, and TCL. The region's expanding middle class and increasing disposable incomes, particularly in countries like China and India, have fueled significant adoption of smart TVs. Additionally, urbanization and the shift towards connected home technologies have further accelerated growth in this segment.
The global smart TV market is dominated by several major players, each leveraging cutting-edge technology and strategic partnerships to maintain their market positions. The market is characterized by intense competition, with leading companies focusing on product innovation, partnerships with content providers, and AI-integrated user interfaces to differentiate their products.
|
Company |
Year Established |
Headquarters |
No. of Employees |
Revenue (USD Bn) |
Product Line |
R&D Investments |
Global Reach |
AI Integration |
Strategic Partnerships |
|
Samsung Electronics |
1938 |
Suwon, South Korea |
- |
- |
- |
- |
- |
- |
- |
|
LG Electronics |
1958 |
Seoul, South Korea |
- |
- |
- |
- |
- |
- |
- |
|
Sony Corporation |
1946 |
Tokyo, Japan |
- |
- |
- |
- |
- |
- |
- |
|
TCL Corporation |
1981 |
Huizhou, China |
- |
- |
- |
- |
- |
- |
- |
|
Hisense |
1969 |
Qingdao, China |
- |
- |
- |
- |
- |
- |
- |
Market Growth Drivers
Market Challenges:
Over the next five years, the global smart TV market is expected to experience substantial growth, fueled by advancements in display technology, integration with Internet of Things (IoT) devices, and growing demand for smart home ecosystems. The increasing availability of high-speed internet and streaming services across developing nations will further expand market adoption. As manufacturers continue to enhance the AI capabilities of smart TVs, integrating features such as voice assistance and personalized content recommendations, the smart TV market is poised for further innovation and user experience optimization.
Market Opportunities:
|
By Screen Size |
32 inches and Below 3355 inches 5670 inches Above 70 inches |
|
By Display Technology |
LED OLED QLED LCD |
|
By Resolution |
HD Full HD 4K 8K |
|
By Distribution Channel |
Online Offline (Retail Stores, Hypermarkets) |
|
By Region |
North America Europe Asia-Pacific Middle East and Africa Latin America |
1.1. Definition and Scope
1.2. Market Taxonomy
1.3. Market Growth Rate
1.4. Market Segmentation Overview
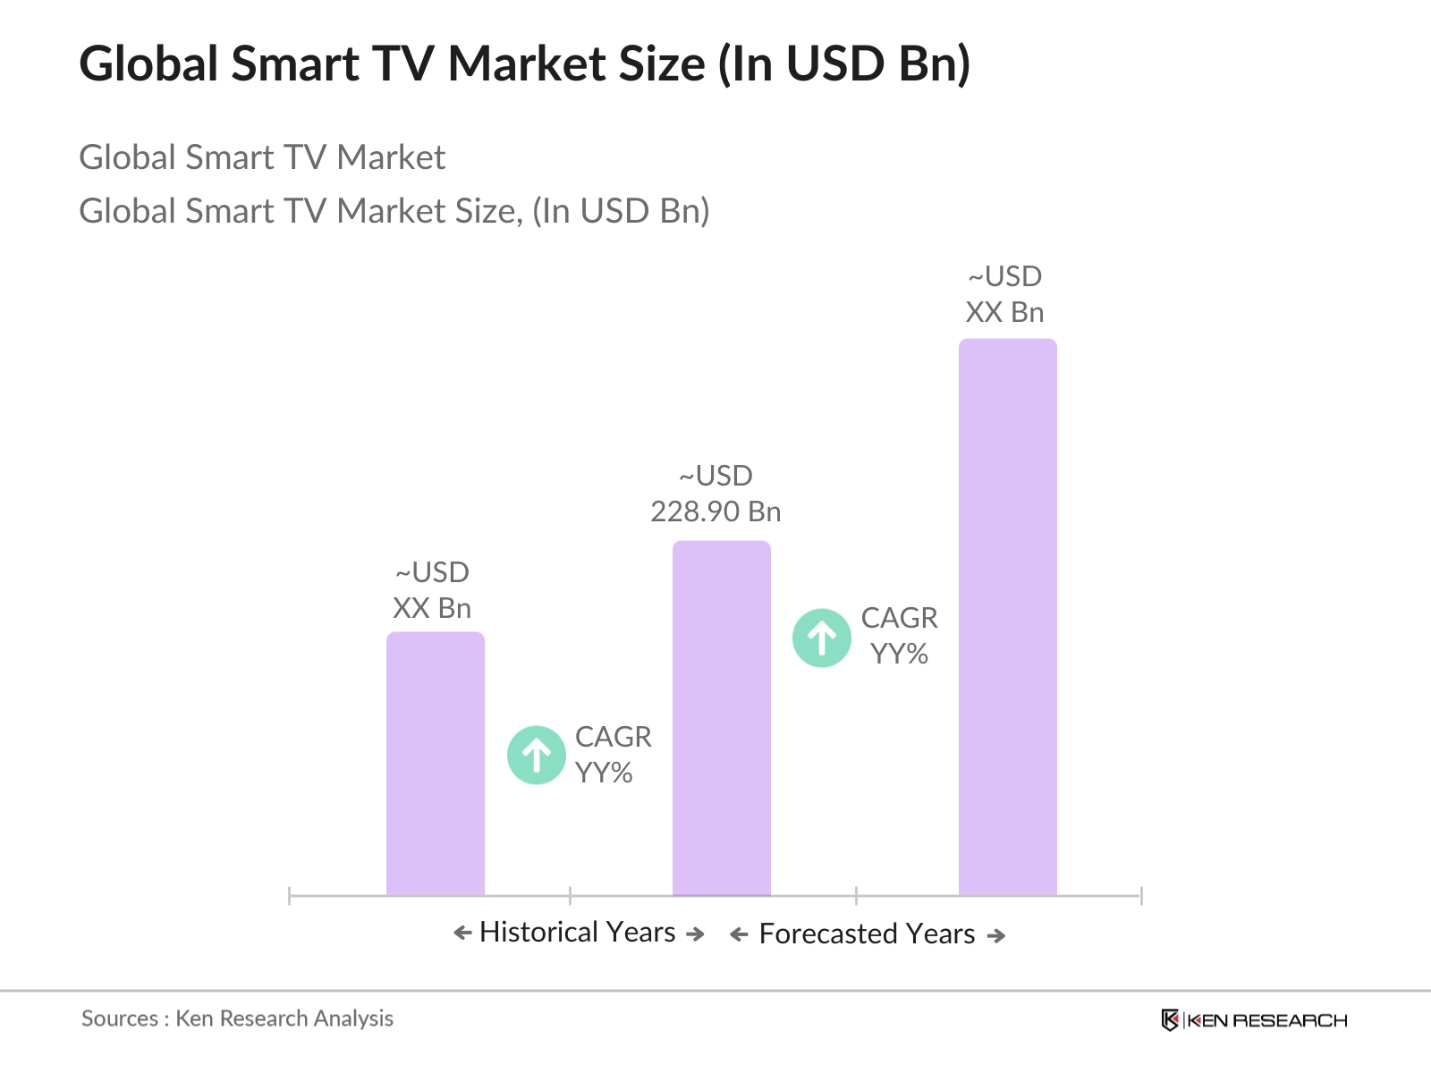
2.1. Historical Market Size
2.2. Year-On-Year Growth Analysis
2.3. Key Market Developments and Milestones
3.1. Growth Drivers
3.1.1. Rising Demand for Streaming Platforms
3.1.2. Technological Advancements in Display Technology
3.1.3. Increased Internet Penetration
3.1.4. Smart Home Integration
3.2. Market Challenges
3.2.1. High Production Costs [Impact on Price Sensitivity]
3.2.2. Intense Competition [Market Fragmentation]
3.2.3. Regional Disparity in Adoption Rates [Geographical Penetration]
3.3. Opportunities
3.3.1. Expansion of IoT Ecosystem [Connected Devices Integration]
3.3.2. Growth in Emerging Economies [Untapped Potential in APAC, LATAM]
3.3.3. Increasing Demand for Larger Screen Sizes [Consumer Preferences]
3.4. Trends
3.4.1. AI Integration in Smart TVs [Voice Assistance, Predictive Algorithms]
3.4.2. 4K and 8K UHD Displays [Market Adoption Rate]
3.4.3. Curved and OLED Displays [Premium Segment Growth]
3.5. Government Regulations
3.5.1. Digital Content Regulations [Content Streaming Rules]
3.5.2. Energy Efficiency Standards [Eco-Friendly Devices]
3.5.3. Import-Export Tariffs on Consumer Electronics [Global Trade Impact]
3.6. SWOT Analysis
3.7. Stake Ecosystem
3.8. Porters Five Forces
3.9. Competition Ecosystem
4.1. By Screen Size (In Value %)
4.1.1. 32 inches and Below
4.1.2. 3355 inches
4.1.3. 5670 inches
4.1.4. Above 70 inches
4.2. By Display Technology (In Value %)
4.2.1. LED
4.2.2. OLED
4.2.3. QLED
4.2.4. LCD
4.3. By Resolution (In Value %)
4.3.1. HD
4.3.2. Full HD
4.3.3. 4K
4.3.4. 8K
4.4. By Distribution Channel (In Value %)
4.4.1. Online
4.4.2. Offline (Retail Stores, Hypermarkets)
4.5. By Region (In Value %)
4.5.1. North America
4.5.2. Europe
4.5.3. Asia-Pacific
4.5.4. Middle East and Africa
4.5.5. Latin America
5.1. Detailed Profiles of Major Companies
5.1.1. Samsung Electronics
5.1.2. LG Electronics
5.1.3. Sony Corporation
5.1.4. Hisense
5.1.5. Panasonic Corporation
5.1.6. Vizio Inc.
5.1.7. TCL Corporation
5.1.8. Xiaomi
5.1.9. Sharp Corporation
5.1.10. Philips
5.1.11. Haier
5.1.12. Skyworth
5.1.13. Amazon Fire TV
5.1.14. Apple TV
5.1.15. Roku
5.2. Cross Comparison Parameters (Headquarters, Revenue, Employees, Product Line, Market Share, R&D Investment, Strategic Initiatives, Geographical Reach)
5.3. Market Share Analysis
5.4. Strategic Initiatives
5.5. Mergers and Acquisitions
5.6. Investment Analysis
5.7. Venture Capital Funding
5.8. Government Grants
5.9. Private Equity Investments
6.1. Certification Standards
6.2. Compliance Requirements
6.3. Market Entry Barriers
7.1. Future Market Size Projections
7.2. Key Factors Driving Future Market Growth
8.1. By Screen Size (In Value %)
8.2. By Display Technology (In Value %)
8.3. By Resolution (In Value %)
8.4. By Distribution Channel (In Value %)
8.5. By Region (In Value %)
9.1. TAM/SAM/SOM Analysis
9.2. Consumer Behavior Insights
9.3. Product Differentiation Strategies
9.4. White Space Opportunity Analysis
Disclaimer Contact UsThe initial phase involved developing a comprehensive ecosystem map, including all major stakeholders in the global smart TV market. Through a combination of desk research and proprietary data sources, critical variables influencing market dynamics, such as display technology innovation, consumer preferences, and content partnerships, were identified.
In this phase, historical data was collected on smart TV market penetration, product adoption rates, and revenue generation. Special attention was given to market differentiation based on screen size, display technology, and regional segmentation. Market growth was evaluated using data from verified databases and cross-referenced with industry reports.
Market hypotheses regarding consumer preferences, smart home integration, and content consumption were developed and validated through expert interviews. This process provided insights into product performance, demand forecasting, and future market trends directly from industry practitioners.
In the final phase, insights from key smart TV manufacturers were integrated with data from the bottom-up research approach to produce a validated and detailed analysis. This synthesis ensured accuracy in the estimation of market size, segmentation, and future outlook for the global smart TV market.
The global smart TV market is valued at USD 228.90 billion, driven by the increasing demand for high-resolution displays and growing integration with smart home ecosystems.
Key challenges include high competition among leading manufacturers, high production costs for premium technologies like OLED, and the need for continuous innovation to meet consumer expectations for AI integration.
The major players include Samsung, LG, Sony, Hisense, and TCL, which dominate the market due to their strong R&D capabilities, extensive product lines, and strategic content partnerships.
The market is primarily driven by advancements in display technologies, the rise of streaming services, and the increasing adoption of smart home ecosystems. Additionally, AI-powered features such as voice assistants and personalized recommendations are driving consumer demand.
 Framework")
What makes us stand out is that our consultants follows Robust, Refine and Result (RRR) methodology. i.e. Robust for clear definitions, approaches and sanity checking, Refine for differentiating respondents facts and opinions and Result for presenting data with story

We have set a benchmark in the industry by offering our clients with syndicated and customized market research reports featuring coverage of entire market as well as meticulous research and analyst insights.

While we don't replace traditional research, we flip the method upside down. Our dual approach of Top Bottom & Bottom Top ensures quality deliverable by not just verifying company fundamentals but also looking at the sector and macroeconomic factors.

With one step in the future, our research team constantly tries to show you the bigger picture. We help with some of the tough questions you may encounter along the way: How is the industry positioned? Best marketing channel? KPI's of competitors? By aligning every element, we help maximize success.

Our report gives you instant access to the answers and sources that other companies might choose to hide. We elaborate each steps of research methodology we have used and showcase you the sample size to earn your trust.

If you need any support, we are here! We pride ourselves on universe strength, data quality, and quick, friendly, and professional service.