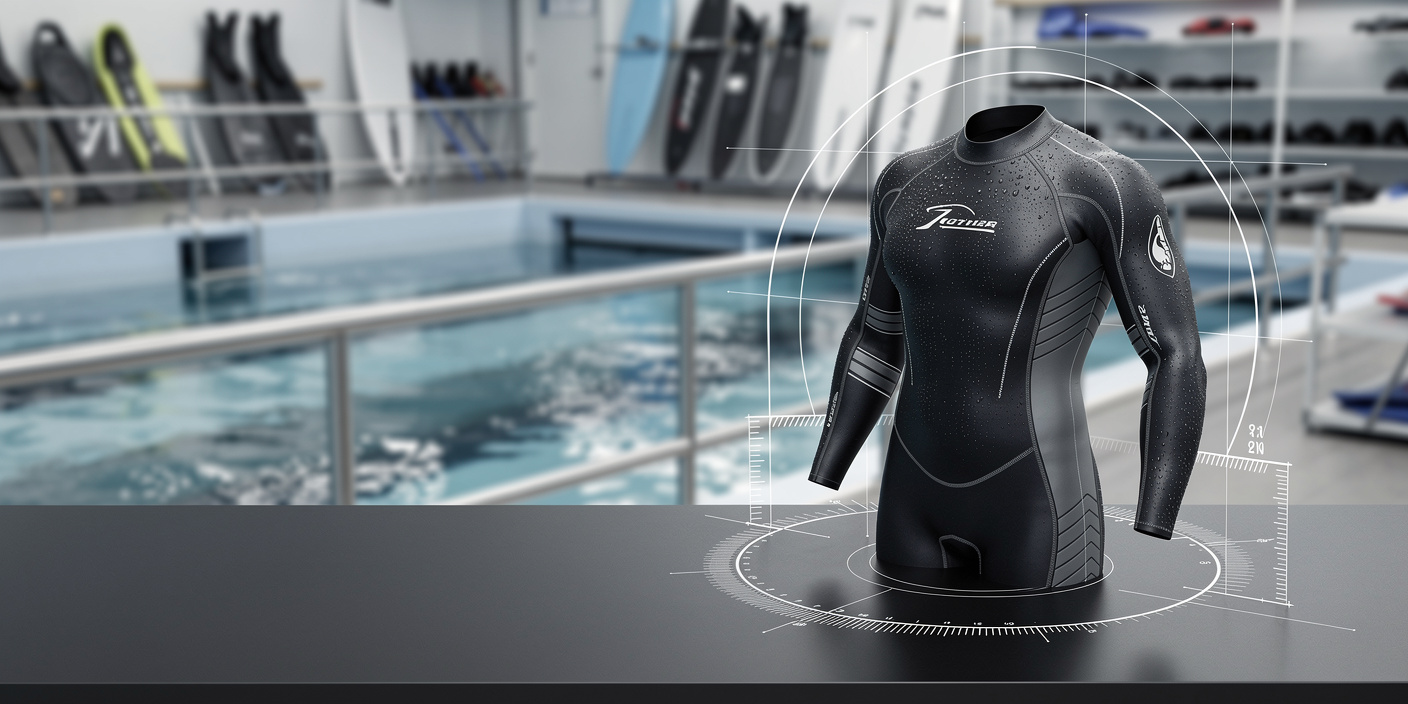
CHAPTER 1 - MARKET SUMMARY
Market Overview
The Global Water Sports Apparel Market Analysis 2013-2018 and Forecast 2019-2024 operates through a mix of technical sports brands, swim specialists, surf labels, original equipment manufacturers, and specialist retailers. Demand is supported by an estimated 146 million active category buyers globally in 2025, with replacement frequency determined by chlorine exposure, saltwater degradation, fit requirements, thermal performance, and changing participation intensity.
Asia Pacific represents the largest commercial hub, combining extensive textile manufacturing, high coastal population density, established surf and swim markets, and export-oriented wetsuit production. The region accounts for an estimated 37.0% of global category revenue in 2025. Broader swimwear research also identified Asia Pacific as the leading regional market, supporting the region's importance for sourcing, brand expansion, and consumer demand.
Market Value
USD 10.42 Bn
2025, global
Dominant Region
Asia Pacific
2025
Dominant Segment
Product Type, led by Performance Swimwear; fastest-growing axis: Technology
Total Number of Players
1,250
Future Outlook
The market is projected to advance from USD 10.42 Bn in 2025 to USD 15.50 Bn in 2031, representing a forecast CAGR of 6.8%. Unit demand is expected to increase from 117.1 million garments to 148.9 million garments, while the blended average selling price rises from USD 89.0 to USD 104.1. Growth will be supported by tourism normalization, wider outdoor participation, expansion of organized swimming, stronger direct-to-consumer distribution, and product replacement driven by performance deterioration in chlorine, ultraviolet exposure, saltwater, and repeated stretching.
Value growth is expected to remain above volume growth because brands are shifting toward technical laminates, bonded seams, chlorine-resistant yarns, recycled fibers, natural-rubber wetsuits, and premium thermal systems. The modeled sustainable-material mix increases from 38% in 2025 to 72% by 2031. Asia Pacific is expected to retain market leadership, while Latin America and the Middle East and Africa offer above-average growth from a smaller base. Competitive advantage will depend on material certification, specialist fit, disciplined inventory management, digital customer acquisition, and reliable access to technical manufacturing capacity.
6.8%
Forecast CAGR
USD 15,500 Mn
2030 Projection
Base Year
2025
Historical Period
2020-2025
Forecast Period
2026-2031
Historical CAGR
6.5%
CHAPTER 2 - SCOPE OF REPORT
Scope of the Market
CHAPTER 3 - Key Stakeholders
Key Target Audience
Key stakeholders who can leverage from this market analysis for investment, strategy, and operational planning.
Investors
CAGR, margin mix, brand equity, sourcing risk, consolidation
Corporates
assortment productivity, channel economics, materials, pricing, market entry
Government
participation, textile circularity, safety, tourism, coastal development
Operators
sell-through, lead times, returns, durability, capacity utilization
Financial institutions
working capital, seasonality, covenants, cash conversion, demand resilience
CHAPTER 4 - Market Size & Growth
Market Size, Growth Forecast and Trends
This section evaluates the historical market size, analyzes year-over-year growth dynamics, and presents forecast projections supported by market performance indicators and demand-side drivers.
Historical & Projected Market Size ($ Million)
Year-over-Year Growth Rate (%)
Market Value vs Volume Growth (%)
Historical Market Performance (2020-2025)
Historical growth was strongest in 2022, when market value increased 8.7% as organized sports participation, travel, swim-club activity, and coastal recreation normalized. Unit volume expanded from 92.5 million garments in 2020 to 117.1 million in 2025, while blended ASP increased from USD 82.2 to USD 89.0. Performance swimwear and wetsuits remained the largest revenue pools. Growth moderated to 5.7% in 2025 as retailers reduced inventory exposure and consumers became more selective, but replacement-led demand and technical product upgrades preserved positive category momentum.
Forecast Market Outlook (2026-2031)
Forecast growth increases from 6.7% in 2026 to 6.9% by 2031, supported by approximately 4% annual volume expansion and 2.6% to 2.7% annual price and mix improvement. The sustainable-material mix is projected to rise from 43% in 2026 to 72% in 2031 as recycled synthetics and natural-rubber wetsuits move into mainstream ranges. Professional and premium categories should outperform economy products because technical fit, thermal performance, seam construction, durability, and traceability support higher pricing. Asia Pacific remains the main volume engine, while direct-to-consumer channels improve product education and assortment economics.
CHAPTER 5 - Market Data
Market Breakdown
The Global Water Sports Apparel Market Analysis 2013-2018 and Forecast 2019-2024 combines participation-led unit expansion with increasing technical content per garment. The resulting growth profile is relevant to investors and operators assessing product-mix quality, sourcing exposure, sustainability investment, channel economics, and inventory risk.
Year | Market Size (USD Mn) | YoY Growth (%) | Unit Volume (Mn units) | Blended ASP (USD/unit) | Sustainable Material Mix (%) | Period |
|---|---|---|---|---|---|---|
| 2020 | $7,600 Mn | +- | 92.5 | 82.2 | Forecast | |
| 2021 | $8,050 Mn | +5.9% | 96.4 | 83.5 | Forecast | |
| 2022 | $8,750 Mn | +8.7% | 103.6 | 84.5 | Forecast | |
| 2023 | $9,320 Mn | +6.5% | 108.2 | 86.1 | Forecast | |
| 2024 | $9,860 Mn | +5.8% | 112.8 | 87.4 | Forecast | |
| 2025 | $10,420 Mn | +5.7% | 117.1 | 89.0 | Forecast | |
| 2026F | $11,120 Mn | +6.7% | 121.8 | 91.3 | Forecast | |
| 2027F | $11,880 Mn | +6.8% | 126.7 | 93.8 | Forecast | |
| 2028F | $12,690 Mn | +6.8% | 131.8 | 96.3 | Forecast | |
| 2029F | $13,560 Mn | +6.9% | 137.2 | 98.8 | Forecast | |
| 2030F | $14,500 Mn | +6.9% | 142.9 | 101.5 | Forecast | |
| 2031F | $15,500 Mn | +6.9% | 148.9 | 104.1 | Forecast |
Unit Volume
117.1 million units, 2025, global. Volume determines factory loading, fabric demand, wholesale inventory, and replenishment needs. The United States recorded 164.2 million outdoor participants in 2021, illustrating the broad participation base supporting specialist recreation apparel.
Blended ASP
USD 89.0 per unit, 2025, global. ASP expansion reflects higher technical content and premium product mix. Current natural-rubber wetsuit collections span approximately USD 249 to USD 609, demonstrating the pricing headroom available for thermal performance, materials, and construction complexity.
Sustainable Material Mix
38%, 2025, global modeled share. Material transition affects sourcing, product development, compliance, and brand positioning. A leading swimwear portfolio reported recycled materials as the main material in 61% of soft-goods products in 2022, indicating rapid commercialization of recycled inputs.
CHAPTER 6 - Segmentation
Market Segmentation Framework
Comprehensive analysis across key dimensions providing insights into market structure, consumer preferences, and distribution patterns.
No of Segments
7
Dominant Segment
Product Type
Fastest Growing Segment
Technology
Product Type
Application
End User
Technology
Price Tier
Distribution Channel
Geography
Key Segmentation Takeaways
Comprehensive analysis across all extracted segmentation dimensions providing insights into market structure, consumer preferences, and distribution patterns.
Product Type
Product configuration is the dominant commercial segmentation because technical requirements, replacement frequency, retail price, gross margin, and sourcing complexity differ materially across apparel groups. Performance Swimwear represents the largest Level-2 pool due to its broad recreational and competitive user base, year-round pool demand, frequent exposure to chlorine, and extensive presence across direct, specialty, club, and sporting-goods channels.
Technology
Technology is the fastest-growing segmentation axis as brands replace conventional inputs with recycled synthetics, solution-dyed fabrics, natural-rubber foams, chlorine-resistant yarns, and higher-UPF constructions. Natural Rubber and Neoprene Alternatives are expected to record the strongest momentum because they address petroleum dependence and brand sustainability commitments while retaining the insulation, flexibility, and durability required by surf and dive users.
CHAPTER 7 - Regional Analysis
Regional Analysis
The regional structure of the Global Water Sports Apparel Market Analysis 2013-2018 and Forecast 2019-2024 reflects differences in coastal participation, organized swimming, tourism, textile manufacturing, specialty retail, climate, disposable income, and technical sourcing capacity.
Leading Region Ranking
1st, Asia Pacific
Leading Region Market Size
USD 3.86 Bn (2025)
Leading Region CAGR
7.8% (2026-2031)
Leading Region Ranking
1st, Asia Pacific
Leading Region Market Size
USD 3.86 Bn (2025)
Leading Region CAGR
7.8% (2026-2031)
Regional Analysis (Current Year)
Regional Analysis Comparison
Market Position
Asia Pacific ranks first at USD 3.86 Bn in 2025 and combines the market's largest estimated buyer pool with the strongest technical-textile sourcing network. Broader swimwear analysis also identifies the region as the leading revenue geography.
Growth Advantage
Asia Pacific's projected 7.8% CAGR exceeds the global 6.8% rate because participation growth, coastal tourism, organized swimming, domestic brands, and manufacturing scale reinforce one another across China, Japan, Australia, South Korea, and Southeast Asia.
Competitive Strengths
The region's technical supply index of 92 reflects concentrated fabric, lamination, seam-sealing, and wetsuit manufacturing capabilities. This supports shorter development cycles, lower unit costs, supplier specialization, and export-oriented production for global brands.
CHAPTER 8 - INDUSTRY ANALYSIS
Growth Drivers, Market Challenges & Market Opportunities
Comprehensive analysis of key factors shaping the Global Water Sports Apparel Market Analysis 2013-2018 and Forecast 2019-2024, including growth catalysts, operational challenges, and emerging opportunities across production, distribution, and consumer segments.
Growth Drivers
Tourism and Coastal Recreation Recovery
- International arrivals recovered to approximately pre-pandemic levels in 2024, rebuilding customer volumes for coastal destinations, dive operators, surf schools, and resort stores that sell or rent water sports apparel.
- Global tourist arrivals increased another 4% in 2025, indicating that destination-driven demand has moved beyond initial recovery and into a more stable expansion cycle for operators and brands.
- The United States recorded 164.2 million outdoor participants in 2021, providing a large addressable base for cross-selling swimming, paddling, surfing, and coastal recreation apparel through sporting-goods and digital channels.
Expansion of Organized and Inclusive Participation
- Federation-led participation programs create demand for club uniforms, training swimwear, buoyancy-compatible layers, weather protection, and entry-level technical garments, benefiting brands with institutional and team-sales capabilities.
- A global sailing participation study found that more than half of respondents were aged above 45, creating demand for comfort, thermal protection, sun protection, inclusive sizing, and easier-entry wetsuit construction.
- The same study found approximately two-thirds of respondents were male, highlighting a significant whitespace opportunity for women's ranges, youth recruitment, adaptive designs, and community-specific product development.
Performance Materials and Product Premiumization
- Natural-rubber wetsuits can contain 85% natural rubber and 15% synthetic rubber, enabling brands to reduce conventional neoprene dependence while maintaining product performance and premium positioning.
- A leading swimwear group reported recycled materials as the principal input in 61% of soft-goods products in 2022, indicating that recycled fabrics have progressed from capsule collections toward scaled commercial adoption.
- High-value performance attributes such as chlorine resistance, UPF protection, bonded seams, thermal linings, and hydrodynamic fit support higher ASPs and reduce direct comparability with basic fashion swimwear.
Market Challenges
Discretionary Retail and Inventory Volatility
- Apparel, footwear, and equipment categories contracted as consumers prioritized experiences and reduced discretionary product purchases, increasing markdown risk for brands carrying seasonal colors, sizes, and technical variants.
- Water sports apparel requires broad size curves and climate-specific assortments, so incorrect demand forecasting can create fragmented residual inventory even when total category demand remains stable.
- Retailers increasingly favor proven products and replenishment programs, requiring suppliers to improve sell-through visibility, shorten lead times, and share inventory risk through direct fulfillment or smaller production runs.
Synthetic Fiber and Circularity Pressure
- Synthetic textiles have been associated with approximately 35% of primary microplastic releases in commonly cited assessments, creating reputational and regulatory risk for polyester, nylon, and elastane-intensive products.
- European textile policy is progressing toward ecodesign, Digital Product Passports, and harmonized producer responsibility, increasing data, testing, documentation, collection, and recycling obligations for brands selling into the region.
- Water sports garments combine stretch yarns, foams, adhesives, laminates, zippers, coatings, and seam tapes, making mechanical recycling more difficult than for mono-material apparel and increasing design-for-disassembly requirements.
Fragmented Scope and Customer Accessibility
- Market definitions frequently mix fashion swimwear, competitive swimwear, beachwear, wetsuits, and accessories, complicating competitor benchmarking and creating a need for disciplined category and revenue boundaries.
- Technical wetsuit price points of USD 249 to USD 609 can restrict entry-level participation, particularly where consumers also need boards, fins, masks, lessons, travel, or club membership.
- Participation remains uneven across gender, age, income, geography, and access to facilities, requiring brands to address affordability, inclusive fit, modest designs, adaptive features, and community distribution rather than relying solely on performance marketing.
Market Opportunities
Lower-Impact Materials and Circular Product Systems
- Natural-rubber foam, recycled nylon, recycled polyester, solution-dyed yarns, water-based lamination, and dope-dyed linings create monetizable premium ranges for brands able to substantiate performance and environmental claims.
- Manufacturers benefit from becoming qualified suppliers of lower-impact fabrics, foam, lamination, seam-sealing, and traceability services, reducing dependence on undifferentiated cut-and-sew economics.
- Commercial scale requires harmonized specifications, stable material supply, repair infrastructure, collection systems, and measurable durability because sustainability premiums will weaken if products underperform or lack credible verification.
Asia Pacific Participation and Brand Expansion
- International tourism recovery expands demand in Southeast Asia, Australia, Japan, island economies, and coastal China, supporting dive, surf, resort, open-water, and paddle-sport apparel categories.
- Regional manufacturers and brands can capture value by combining technical production capability with locally relevant fit, climate, modesty, price, and digital-channel strategies rather than serving export customers alone.
- Infrastructure investment in pools, clubs, schools, coastal tourism, and organized events is necessary to convert population scale into repeat category demand and reduce reliance on occasional holiday purchases.
Direct-to-Consumer and Technical Premiumization
- Direct channels enable brands to explain fit, water temperature, thickness, seam construction, fabric technology, and care requirements, supporting conversion and reducing dependence on wholesale shelf space.
- Digital fit tools, guided product selection, membership programs, repair services, and replenishment reminders create higher customer lifetime value and improve demand visibility across specialist product categories.
- Success requires low return rates, accurate size architecture, regional fulfillment, localized content, and disciplined acquisition spending because technical apparel can generate costly exchanges when fit information is insufficient.
CHAPTER 9 - Competitive Landscape
Competitive Landscape Overview
The market is fragmented across global swim brands, surf portfolios, wetsuit specialists, technical manufacturers, and regional labels. Entry barriers are highest in performance fit, material development, athlete credibility, specialist distribution, and reliable technical production.
Market Share Distribution
Top 5 Players
Market Dynamics
8 new entrants in the past 5 years, indicating strong market attractiveness and growth potential.
Company Name | Market Share | Headquarters | Founding Year | Core Market Focus |
|---|---|---|---|---|
Pentland Brands Limited (Speedo) | - | London, United Kingdom | 1932 | Competitive swimwear, training apparel, goggles, and aquatic products |
Arena S.p.A. | - | Tolentino, Italy | 1973 | Competitive swimming, racing suits, training swimwear, and team programs |
TYR Sport, Inc. | - | Seal Beach, United States | 1985 | Performance swimwear, triathlon apparel, training equipment, and team sales |
Boardriders, Inc. (Authentic Brands Group) | - | Huntington Beach, United States | 1969 | Surf apparel through Quiksilver, Billabong, and Roxy portfolios |
KMD Brands Limited (Rip Curl) | - | Christchurch, New Zealand | 1987 | Surf wetsuits, boardshorts, rash guards, and direct retail |
O'Neill | - | Santa Cruz, United States | 1952 | Surf wetsuits, boardshorts, technical water apparel, and lifestyle products |
Patagonia, Inc. | - | Ventura, United States | 1973 | Natural-rubber wetsuits, surf apparel, repair, and lower-impact materials |
SHEICO Group | - | Yilan, Taiwan | 1965 | Wetsuit manufacturing, technical foam, lamination, and private-label production |
Aqua Lung International | - | Carros, France | 1943 | Diving wetsuits, drysuits, rash guards, and thermal protection |
Orca (Orbea Group) | - | Mallabia, Spain | 1995 | Open-water swimming, triathlon wetsuits, and technical swim apparel |
Cross Comparison Parameters
The report provides detailed cross-comparison of key players across 10 performance parameters to identify competitive strengths and weaknesses.
Technical Product Portfolio Breadth
Sustainable Material Adoption
Water Sports Apparel Revenue Growth
Gross Margin
Analysis Covered
Market Share Analysis:
Estimates category position across swim, surf, dive, and multisport portfolios
Cross Comparison Matrix:
Benchmarks technical breadth, materials, revenue growth, and gross margin
SWOT Analysis:
Assesses brand equity, sourcing exposure, innovation capability, and channel risk
Pricing Strategy Analysis:
Compares entry, premium, professional, wholesale, and direct price architecture
Company Profiles:
Summarizes ownership, geographic reach, products, capabilities, and competitive positioning
CHAPTER 10 - REPORT TOC
CHAPTER 14 - Table Of Contents
Phase 1Market Assessment Phase
11
Chapters
Supply-side and competitive intelligence covering market sizing, segmentation, competitive dynamics, regulatory landscape, and future forecasts.
Phase 2Go-To-Market Strategy Phase
15
Chapters
Entry strategy evaluation, execution roadmap, partner recommendations, and profitability outlook.
Complete Report Coverage
201+ detailed sections covering every aspect of the market
143
Assessment Sections
58
Strategy Sections
CHAPTER 11 - Our Approach
Research Methodology
Desk Research
- Reviewed water sports participation datasets
- Analyzed textile and trade statistics
- Mapped technical apparel product portfolios
- Examined sustainability and regulatory policies
Primary Research
- Interviewed water sports category directors
- Consulted technical apparel sourcing managers
- Engaged specialty retail merchandise heads
- Surveyed surf and swim operators
Validation and Triangulation
- Validated through 326 stakeholder interviews
- Reconciled value and volume estimates
- Cross-checked prices across major channels
- Tested regional and segment allocations
CHAPTER 12 - FAQ
FAQs
Still have questions?
Our research team is here to help you find the right solution
CHAPTER 13 - Related Research
Explore Related Reports
Expand your market intelligence with complementary research across regions and adjacent markets.
Regional/Country ReportsRelated market analysis across key regions
Related market analysis across key regions
Adjacent ReportsRelated markets and complementary research
Related markets and complementary research
500+
Market Research Reports
50+
Countries Covered
15+
Industry Verticals