CHAPTER 1 - MARKET SUMMARY
Market Overview
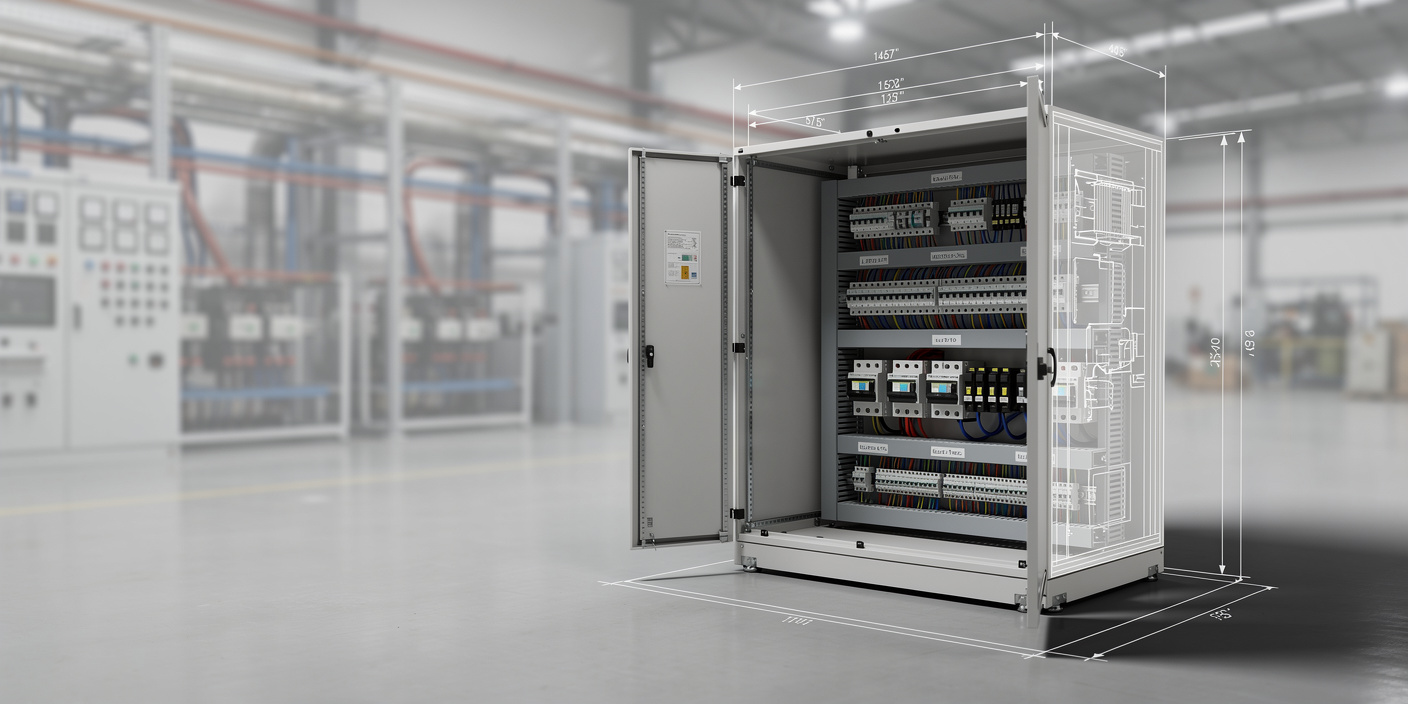
The India Electric Control Panel Market operates through engineered assemblies combining switchgear, protection, motor control, automation and power-management components into project-specific enclosures. Demand is anchored in India's industrial base, where manufacturing value added reached approximately USD 493 billion in 2024. This scale creates recurring requirements for factory expansion, machinery electrification, process control, brownfield modernization and replacement of aging distribution systems.
West India is the principal demand and fabrication cluster because Maharashtra and Gujarat jointly accounted for approximately 30.2% of registered-factory gross value added in 2023-24. Dense automotive, chemicals, pharmaceuticals, engineering and process-industry corridors improve utilization for panel builders, shorten project logistics and support regional engineering ecosystems. The concentration favors suppliers combining local assembly, testing, commissioning and rapid service response.
Market Value
USD 486 million
2025
Dominant Region
West India
2025
Dominant Segment
Motor Control Centers
dominant product type, 2025
Total Number of Players
1,850
2025
Future Outlook
The India Electric Control Panel Market is projected to expand from USD 486 million in 2025 to USD 855 million by 2032, representing an 8.40% CAGR during 2025-2032, compared with 7.3% historical CAGR during 2020-2025. Standardized panel-equivalent shipments are modeled to rise from 216 thousand units in 2025 to 335 thousand units by 2032. Average selling value is projected to increase from USD 2,250 to USD 2,552 per standardized equivalent as intelligent protection, communications, metering, PLC-HMI functionality and engineering content increase within new installations and brownfield modernization programs.
By 2031, the modeled market reaches approximately USD 790 million before advancing to the 2032 terminal projection. Connected and digitally managed panels are expected to increase from approximately 32% of modeled installations in 2025 to around 60% by 2032, shifting profit pools toward communications, software-enabled monitoring, engineering, commissioning and lifecycle support. Renewable generation, storage, data centers, smart metering and automated manufacturing create structurally higher requirements for reliable switching, remote diagnostics and power-quality management, supporting value growth above physical shipment growth across the forecast period.
8.40%
Forecast CAGR
$855 Mn
2030 Projection
Base Year
2025
Historical Period
2020-2025
Forecast Period
2025-2032
Historical CAGR
7.3%
CHAPTER 2 - SCOPE OF REPORT
Scope of the Market
CHAPTER 3 - Key Stakeholders
Key Target Audience
Key stakeholders who can leverage from this market analysis for investment, strategy, and operational planning.
Investors
forecast CAGR, margin mix, capex intensity, consolidation, digital upside
Corporates
procurement cost, automation ROI, uptime, lead times, localization
Government
electrical safety, localization, grid reliability, standards, infrastructure resilience
Operators
capacity, testing, engineering productivity, commissioning, lifecycle service, quality
Financial institutions
project finance, working capital, order visibility, margins, counterparty risk
CHAPTER 4 - Market Size & Growth
Market Size, Growth Forecast and Trends
This section evaluates the historical market size, analyzes year-over-year growth dynamics, and presents forecast projections supported by market performance indicators and demand-side drivers.
Historical & Projected Market Size ($ Million)
Year-over-Year Growth Rate (%)
Market Value vs Volume Growth (%)
Historical Market Performance (2020-2025)
Historical performance shows a temporary growth trough of 3.5% in 2021 followed by normalization as deferred industrial investment, factory automation and infrastructure projects resumed. Annual value growth accelerated to a historical-period peak of 8.7% in 2024. Standardized panel-equivalent volume increased at approximately 5.0% CAGR across 2020-2025, while modeled average selling value increased from USD 2,018 to USD 2,250 per equivalent. Base-year triangulation supports a confidence range of approximately USD 448-526 million, with uncertainty concentrated in fragmented regional panel-builder revenue, project customization and the treatment of small engineered assemblies.
Forecast Market Outlook (2025-2032)
Forecast value growth is projected at 8.40% CAGR during 2025-2032, taking the market to USD 855 million by 2032. Standardized panel-equivalent shipments are projected to grow at approximately 6.47% CAGR to 335 thousand units, while average selling value rises at approximately 1.82% CAGR to USD 2,552 per equivalent. The combination implies that physical installations remain the primary growth engine, while higher digital content, protection density, communications capability and engineering complexity provide an additional value uplift. Expansion is expected to remain broad-based across manufacturing, renewable power, storage, data centers, transport infrastructure and utility modernization.
CHAPTER 5 - Market Data
Market Breakdown
Market growth reflects both higher physical deployment of engineered panels and rising electrical, automation and communications content per installation. For CEOs and investors, the interaction among shipment volume, average selling value and smart-panel penetration is central to margin mix, engineering capacity and lifecycle-service positioning.
Year | Market Size (USD Mn) | YoY Growth (%) | Standardized Panel Shipments (000 Units) | Average Selling Value (USD/Equivalent) | Smart/Connected Panel Share, Modeled (%) | Period |
|---|---|---|---|---|---|---|
| 2020 | $341 Mn | +- | 169 | 2,018 | Forecast | |
| 2021 | $353 Mn | +3.5% | 172 | 2,052 | Forecast | |
| 2022 | $382 Mn | +8.2% | 183 | 2,087 | Forecast | |
| 2023 | $415 Mn | +8.6% | 196 | 2,117 | Forecast | |
| 2024 | $451 Mn | +8.7% | 207 | 2,179 | Forecast | |
| 2025 | $486 Mn | +7.8% | 216 | 2,250 | Forecast | |
| 2026 | $528 Mn | +8.6% | 230 | 2,296 | Forecast | |
| 2027 | $573 Mn | +8.5% | 245 | 2,339 | Forecast | |
| 2028 | $622 Mn | +8.6% | 261 | 2,383 | Forecast | |
| 2029 | $675 Mn | +8.5% | 278 | 2,428 | Forecast | |
| 2030 | $731 Mn | +8.3% | 296 | 2,470 | Forecast | |
| 2031 | $790 Mn | +8.1% | 315 | 2,508 | Forecast | |
| 2032 | $855 Mn | +8.2% | 335 | 2,552 | Forecast |
Standardized Panel Shipments
216 thousand equivalents, 2025, India. Shipment growth provides the operating scale lever for panel manufacturers, testing facilities and channel partners. India's installed electricity-generation capacity reached 500.89 GW in September 2025, expanding the electrical asset base requiring distribution and control systems.
Average Selling Value
USD 2,250 per equivalent, 2025, India. Higher automation, protection and communication content supports value growth beyond physical shipments. Low-voltage switchgear output increased 14.8% in FY2024-25, indicating strong upstream electrical-equipment activity and procurement momentum.
Smart/Connected Panel Share
32%, 2025, India. Connected controls support higher engineering and lifecycle-service revenues. India's operational data-center stock reached approximately 1,530 MW during January-September 2025, a high-reliability load category requiring monitoring-rich distribution and control architectures.
CHAPTER 6 - Segmentation
Market Segmentation Framework
Comprehensive analysis across key dimensions providing insights into market structure, consumer preferences, and distribution patterns.
No of Segments
7
Dominant Segment
Product Type
Fastest Growing Segment
Technology
Product Type
End-Use Industry
Application
Customer Type
Sales Channel
Technology
Geography
Key Segmentation Takeaways
Comprehensive analysis across all extracted segmentation dimensions providing insights into market structure, consumer preferences, and distribution patterns.
Product Type
Product architecture remains the principal revenue-allocation lens because enclosure scale, breaker density, busbar rating, motor feeders, engineering hours and testing requirements materially alter project economics. Motor Control Centers form the most commercially significant Level-2 category, supported by manufacturing, processing, utilities, pumping, HVAC and material-handling applications where coordinated motor protection and operating reliability are procurement-critical.
Technology
Technology is the fastest-changing segmentation dimension as procurement shifts from conventional relay logic toward PLC-HMI architectures, SCADA connectivity, Ethernet communications, digital protection and power analytics. SCADA and IoT Connected configurations offer the strongest mix-upside as users prioritize remote monitoring, diagnostics, data integration and reduced downtime, increasing the addressable value of engineering, software integration and lifecycle support.
CHAPTER 7 - Regional Analysis
Regional Analysis
India ranks second by modeled 2025 market size among the selected Asian manufacturing and electrification peers, behind China and ahead of Indonesia, Vietnam and Thailand. Its relative position combines a large manufacturing base, rapid power-system expansion and comparatively high forecast growth, while Vietnam remains the fastest-growing peer from a smaller base. kenresearch.com
Focus Country Ranking
2nd among selected peers
India Market Size (2025)
USD 486 Mn
India CAGR (2025-2032)
8.40%
Focus Country Ranking
2nd among selected peers
India Market Size (2025)
USD 486 Mn
India CAGR (2025-2032)
8.40%
Regional Analysis (Current Year)
Market Position
India ranks 2nd among the five selected peers with a modeled USD 486 Mn market in 2025, supported by its diversified industrial base and expanding electrical infrastructure. kenresearch.com
Growth Advantage
India's 8.40% CAGR during 2025-2032 exceeds China at 6.2%, Indonesia at 7.9% and Thailand at 6.5%, while trailing Vietnam's 8.8% growth from a smaller base. kenresearch.com
Competitive Strengths
India combines approximately USD 493 Bn of manufacturing value added in 2024 with 500.89 GW installed generation capacity in September 2025, supporting broad, diversified panel demand.
CHAPTER 8 - INDUSTRY ANALYSIS
Growth Drivers, Challenges & Opportunities
Comprehensive analysis of key factors shaping the India Electric Control Panel Market, including growth catalysts, operational challenges, and emerging opportunities across production, distribution, and consumer segments.
Growth Drivers
Industrial Automation and Factory Modernization
- Manufacturing value added reached approximately USD 493 Bn (2024, India), providing a large installed base for production-line automation, motor control, electrical protection and brownfield panel replacement, benefiting OEMs, system integrators and panel manufacturers.
- Maharashtra and Gujarat generated approximately 30.2% of registered-factory GVA (2023-24, India), creating concentrated industrial clusters where panel builders can improve engineering utilization, service density and project-response times.
- Overall electrical-equipment production recorded approximately 14.1% growth (FY2024-25, India), indicating strong upstream demand conditions and supporting suppliers with standardized assemblies, fast configuration capability and reliable component sourcing.
Power-System Expansion and Renewable Integration
- Non-fossil generation capacity reached 256.09 GW and 51.13% of total capacity (September 2025, India), increasing requirements for grid-interfacing, auxiliary distribution, protection coordination and renewable-project control packages.
- Solar and wind installations reached 127.33 GW and 53.12 GW respectively (September 2025, India), creating monetizable demand for AC distribution, plant auxiliaries, SCADA interfaces, reactive-power management and remote-monitoring architectures.
- India met peak electricity demand of 241 GW (June 2025, India) with zero peak shortage, increasing the commercial importance of dependable distribution and control systems as network loading and asset utilization rise.
Data Centers and Digitally Managed Electrical Loads
- Approximately 260 MW of new data-center supply (January-September 2025, India) was added, benefiting suppliers capable of redundant power architectures, intelligent metering, high-density feeder management and commissioning support.
- Under smart-metering programs, 20.33 crore meters were sanctioned and 2.41 crore installed (15 July 2025, India), creating adjacent demand for feeder, transformer, communications and supervisory-control equipment.
- National AI infrastructure had onboarded 38,231 GPUs (March 2026, India), reinforcing high-density digital infrastructure requirements and creating downstream opportunities for power quality, thermal-auxiliary control and intelligent distribution panels.
Market Challenges
Imported Assembly and Component Exposure
- Imports under broad HS 853720 totaled USD 78.8 Mn (2024, India), showing continued dependence on selected higher-voltage control and distribution equipment that can expose local projects to foreign-exchange, freight and lead-time risk.
- China supplied approximately USD 196.0 Mn, or 25.5% of HS 853710 imports (2024, India), concentrating sourcing exposure and strengthening the business case for qualified local substitutes and multi-country procurement.
- Exports under HS 853710 reached USD 538.4 Mn (2024, India), confirming two-way supply chains. Because this customs category is broader than complete control panels, firms must distinguish component trade from actual addressable panel revenue when planning capacity.
Testing, Safety and Compliance Complexity
- Motor-control equipment is addressed through IS/IEC 60947 Part 4/Sec 1:2018 (2026 regulatory framework, India), making component selection, testing records and supplier traceability commercially important for MCC and automation-panel producers.
- Electrical-plant and line construction is governed by a dedicated 2022 technical-standards framework (2022, India), increasing the need for engineering teams to align project design, safety and commissioning documentation with regulated infrastructure requirements.
- The construction standards received a further 2025 amendment (2025, India), illustrating continuing regulatory evolution and creating recurring compliance-management costs for EPCs, manufacturers and suppliers serving power-sector projects.
Raw-Material and Contract Price Volatility
- Separate price-variation treatment extends to medium-voltage air-insulated switchgear through 36 kV (2019 framework, India), showing that commodity and component-cost movements affect multiple engineered-panel voltage classes.
- A specific medium-voltage APFC panel price-variation formula was revised in March 2025 (2025, India), reinforcing the need for contract structures that pass through copper, steel, component and equipment-cost movements.
- Switchgear and controlgear is maintained as a dedicated Group 06 price-variation category (2026 reference structure, India), indicating persistent input-cost sensitivity and making procurement timing, inventory turns and escalation clauses important EBITDA levers.
Market Opportunities
Connected-Panel Retrofit and Digital Services
- Nationwide smart-meter installations reached approximately 4.93 crore units (December 2025, India), supporting monetizable opportunities in feeder monitoring, communications gateways, retrofit engineering, commissioning and recurring maintenance services.
- Approximately 1.60 crore prepaid smart meters were operating (December 2025, India), benefiting suppliers that integrate metering data, remote isolation, distribution automation and energy-management functionality within connected electrical systems.
- Programs included approximately 52.53 lakh distribution-transformer meters and 2.11 lakh feeder meters sanctioned (December 2025, India), creating a broader control-and-monitoring layer for utilities, system integrators and intelligent-panel providers.
Renewable and Storage Control Packages
- Installed solar capacity reached approximately 132.85 GW (November 2025, India), increasing the addressable requirement for inverter-side distribution, plant control, auxiliary loads, metering and power-quality systems.
- Installed wind capacity reached approximately 53.99 GW (November 2025, India), supporting suppliers of turbine auxiliaries, substation controls, reactive-power systems and remote monitoring architectures.
- Renewable capacity under implementation reached approximately 184.24 GW (November 2025, India), providing forward order visibility for EPCs and panel builders positioned in utility-scale renewable, storage and grid-interconnection projects.
Modular Panel Platforms for Infrastructure
- Approximately 100 railway projects were sanctioned (FY2025-26, India), offering panel manufacturers an opportunity to standardize proven designs across stations, depots, traction auxiliaries and infrastructure packages.
- Plans included 200 Vande Bharat, 100 Amrit Bharat and 50 Namo Bharat trains (2025, India), creating demand across manufacturing facilities, depots, maintenance infrastructure and auxiliary electrical systems.
- Generation additions reached approximately 34 GW, including 29.5 GW renewable capacity (FY2024-25, India), creating additional standardized applications in station service, auxiliary power, protection and equipment control.
CHAPTER 9 - Competitive Landscape
Competitive Landscape Overview
The market combines multinational electrification leaders, large domestic electrical manufacturers and specialist panel builders, with competition centered on engineering capability, certification, delivery reliability, installed-base relationships, service coverage and sector-specific project references.
Market Share Distribution
Top 5 Players
Market Dynamics
8 new entrants in the past 5 years, indicating strong market attractiveness and growth potential.
Company Name | Market Share | Headquarters | Founding Year | Core Market Focus |
|---|---|---|---|---|
Schneider Electric India Pvt Ltd | - | Gurugram, India | - | Low-voltage switchboards, motor control, automation, energy management and intelligent panel systems |
Siemens Limited | - | Mumbai, India | 1957 | Industrial controls, low-voltage distribution, automation, motor management and digital electrical systems |
ABB India Limited | - | Bengaluru, India | 1949 | Electrification, motor control, process automation, digital switchgear and energy-management systems |
Eaton Power Quality Pvt Ltd | - | Pune, India | - | Power distribution, controlgear, power quality, protection and industrial electrical assemblies |
Legrand India Pvt Ltd | - | Mumbai, India | 1996 | Low-voltage electrical systems, power distribution, energy management and commercial electrical solutions |
C&S Electric Limited | - | New Delhi, India | - | Siemens-owned low-voltage switchgear components and panels, busbars, protection and metering |
BCH Electric Limited | - | New Delhi, India | 1965 | Motor starters, industrial controlgear, power distribution, PCC and MCC panels |
Tricolite Electrical Industries Limited | - | Noida, India | - | LV and MV switchboards, control panels, data-center electrical systems and engineered distribution |
Sudhir Power Limited | - | Gurugram, India | 1973 | Electrical EPC, HT/LT panels, distribution and mission-critical infrastructure |
Pyrotech Electronics Pvt Ltd | - | Udaipur, India | 1976 | Process-control panels, automation panels, control desks and industrial electronics |
Cross Comparison Parameters
The report provides detailed cross-comparison of key players across 10 performance parameters to identify competitive strengths and weaknesses.
Annual Panel Manufacturing Capacity
Engineering and Delivery Lead Time
Sector-Specific Revenue Growth
Operating EBITDA Margin
Analysis Covered
Market Share Analysis:
Benchmarks supplier scale across national, regional and specialist panel competitors
Cross Comparison Matrix:
Compares engineering, delivery, financial and manufacturing performance across major players
SWOT Analysis:
Assesses technology strengths, channel gaps, risks and strategic growth options
Pricing Strategy Analysis:
Evaluates specification premiums, tender pricing, standardization and lifecycle service economics
Company Profiles:
Maps capabilities, portfolios, locations, positioning and priority customer sectors clearly
CHAPTER 10 - REPORT TOC
Table of Contents
Market Assessment Phase
Supply-side and competitive intelligence covering market sizing, segmentation, competitive dynamics, regulatory landscape, and future forecasts.
Go-To-Market Strategy Phase
15 chapters
Entry strategy evaluation, execution roadmap, partner recommendations, and profitability outlook.
Survey Phase
8 chapters
Demand-side primary research conducted through structured interviews and online surveys with end users across priority metros and Tier 2/3 cities to capture consumption behavior, unmet needs, and purchase drivers.
Complete Report Coverage
201+ detailed sections covering every aspect of the market
143
Assessment Sections
58
Strategy Sections
CHAPTER 11 - Our Approach
Research Methodology
Desk Research
- Electrical equipment production trend assessment
- Control-board import export flow analysis
- Panel standards and compliance mapping
- End-industry capital expenditure pipeline benchmarking
Primary Research
- Panel plant manager engineer interviews
- Electrical EPC procurement head interviews
- Automation integrator director interview program
- Industrial maintenance manager demand interviews
Validation and Triangulation
- 250 respondent evidence-base consistency checks
- Structured supplier shipment volume cross-checks
- Panel ASP benchmark reconciliation checks
- Demand-intensity model validation across sectors
CHAPTER 12 - FAQ
FAQs
Still have questions?
Our research team is here to help you find the right solution
CHAPTER 13 - Related Research
Explore Related Reports
Expand your market intelligence with complementary research across regions and adjacent markets.
Regional/Country ReportsRelated market analysis across key regions
Related market analysis across key regions
- Indonesia Electric Control Panel Market
- Vietnam Electric Control Panel Market
- Thailand Electric Control Panel Market
- Malaysia Electric Control Panel Market
- Philippines Electric Control Panel Market
Adjacent ReportsRelated markets and complementary research
Related markets and complementary research
- Oman Industrial Automation Equipment Market
- UAE Power Quality Management Systems Market
- Bahrain Smart Grid Technology Market
- Indonesia Renewable Energy Infrastructure Market
- KSA Data Center Infrastructure Market
500+
Market Research Reports
50+
Countries Covered
15+
Industry Verticals