
Indonesia Green Ammonia Market Outlook to 2030
Region:Indonesia
Author(s):Mukul Soni
Product Code:KROD575
Region:Indonesia
Author(s):Mukul Soni
Product Code:KROD575
July 2024
90
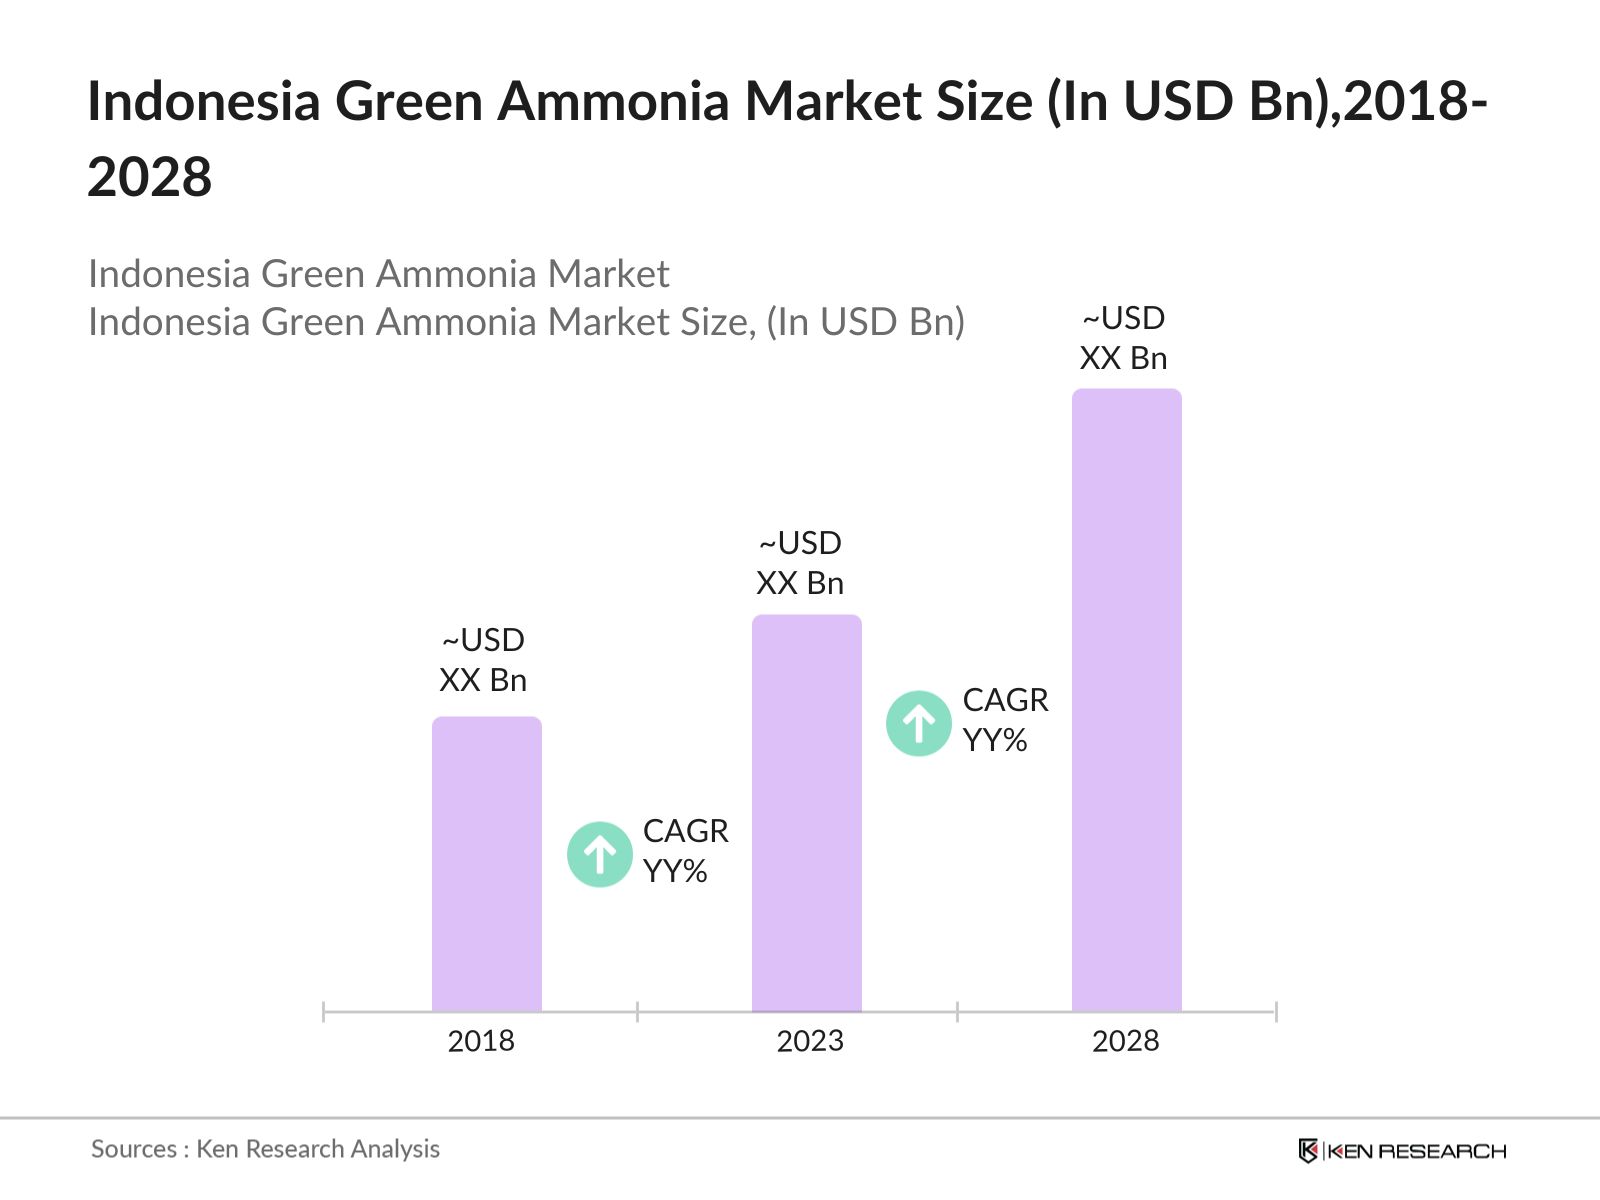
The Indonesia Green Ammonia Market can be segmented based on several factors:
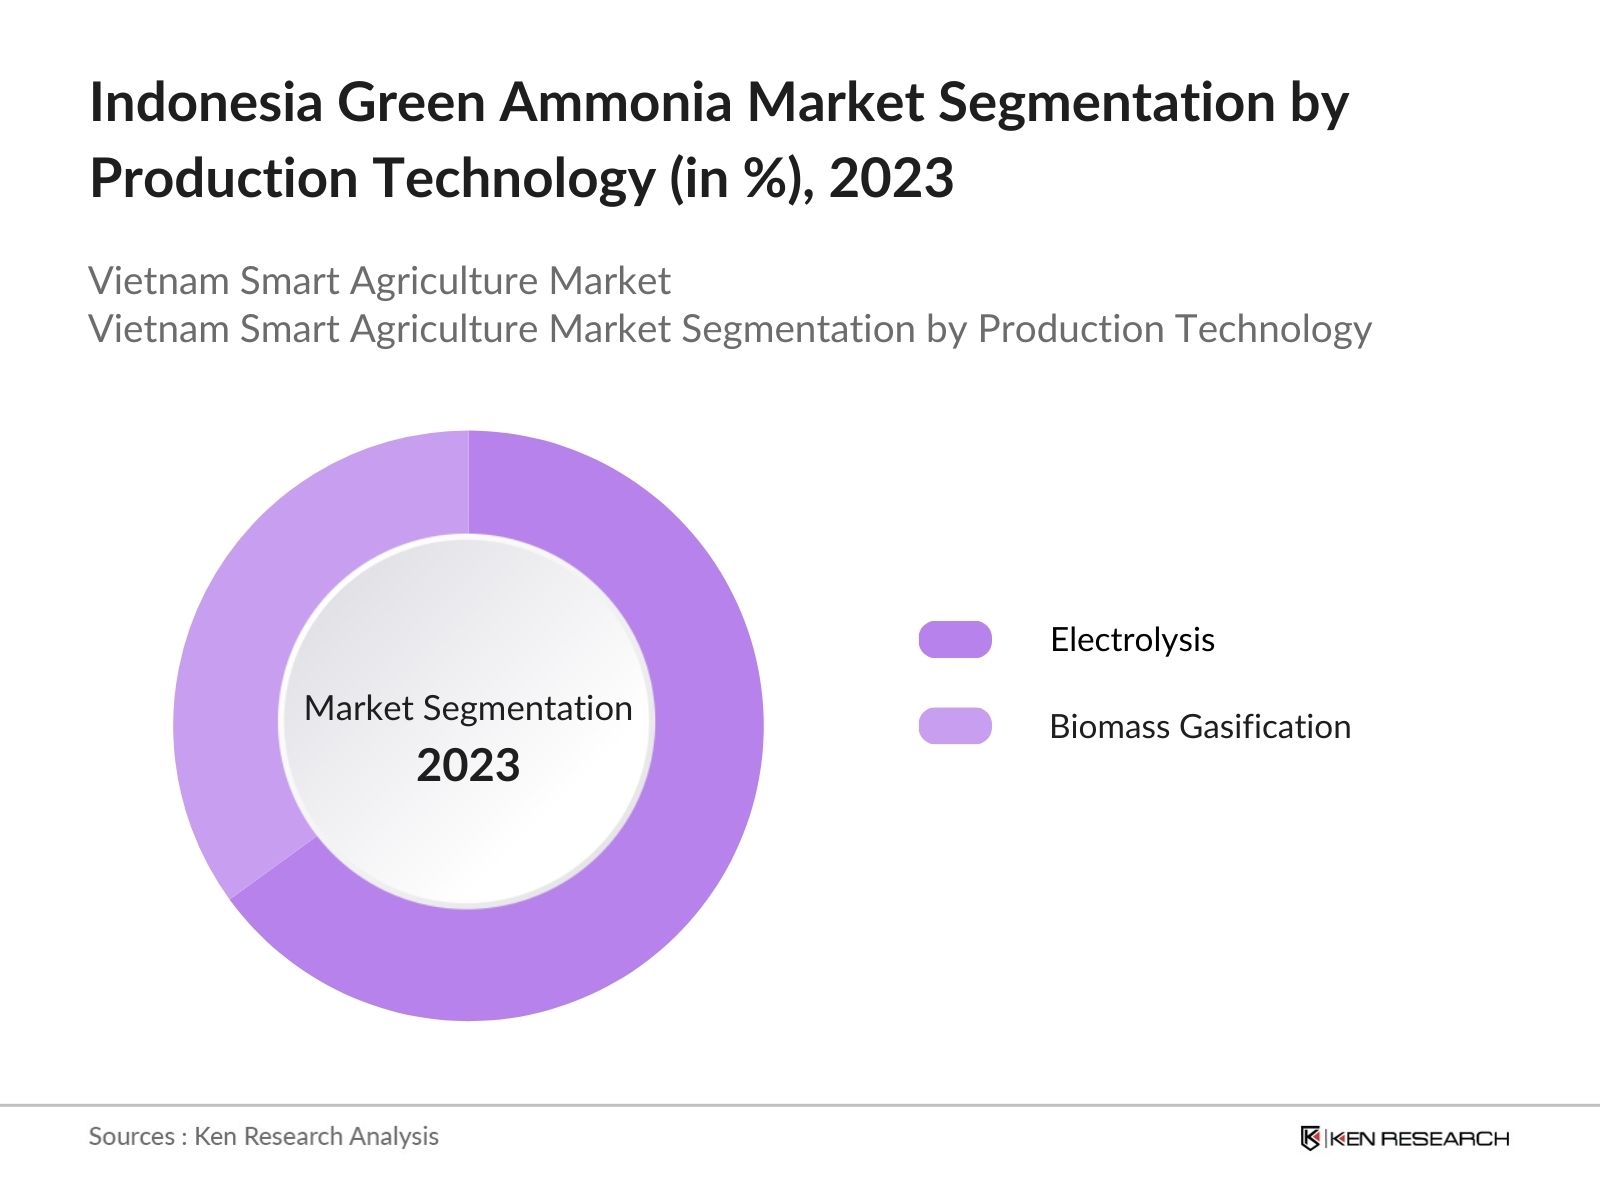
By Production Technology: The Indonesia green ammonia market is segmented by production technology into Electrolysis and Biomass Gasification. In 2023, Electrolysis dominated the market. The dominance of electrolysis is due to its efficiency and the availability of abundant renewable energy sources such as solar and wind power in Indonesia. Electrolysis is also favored for its potential to integrate with existing hydrogen production facilities, further reducing costs and enhancing scalability.
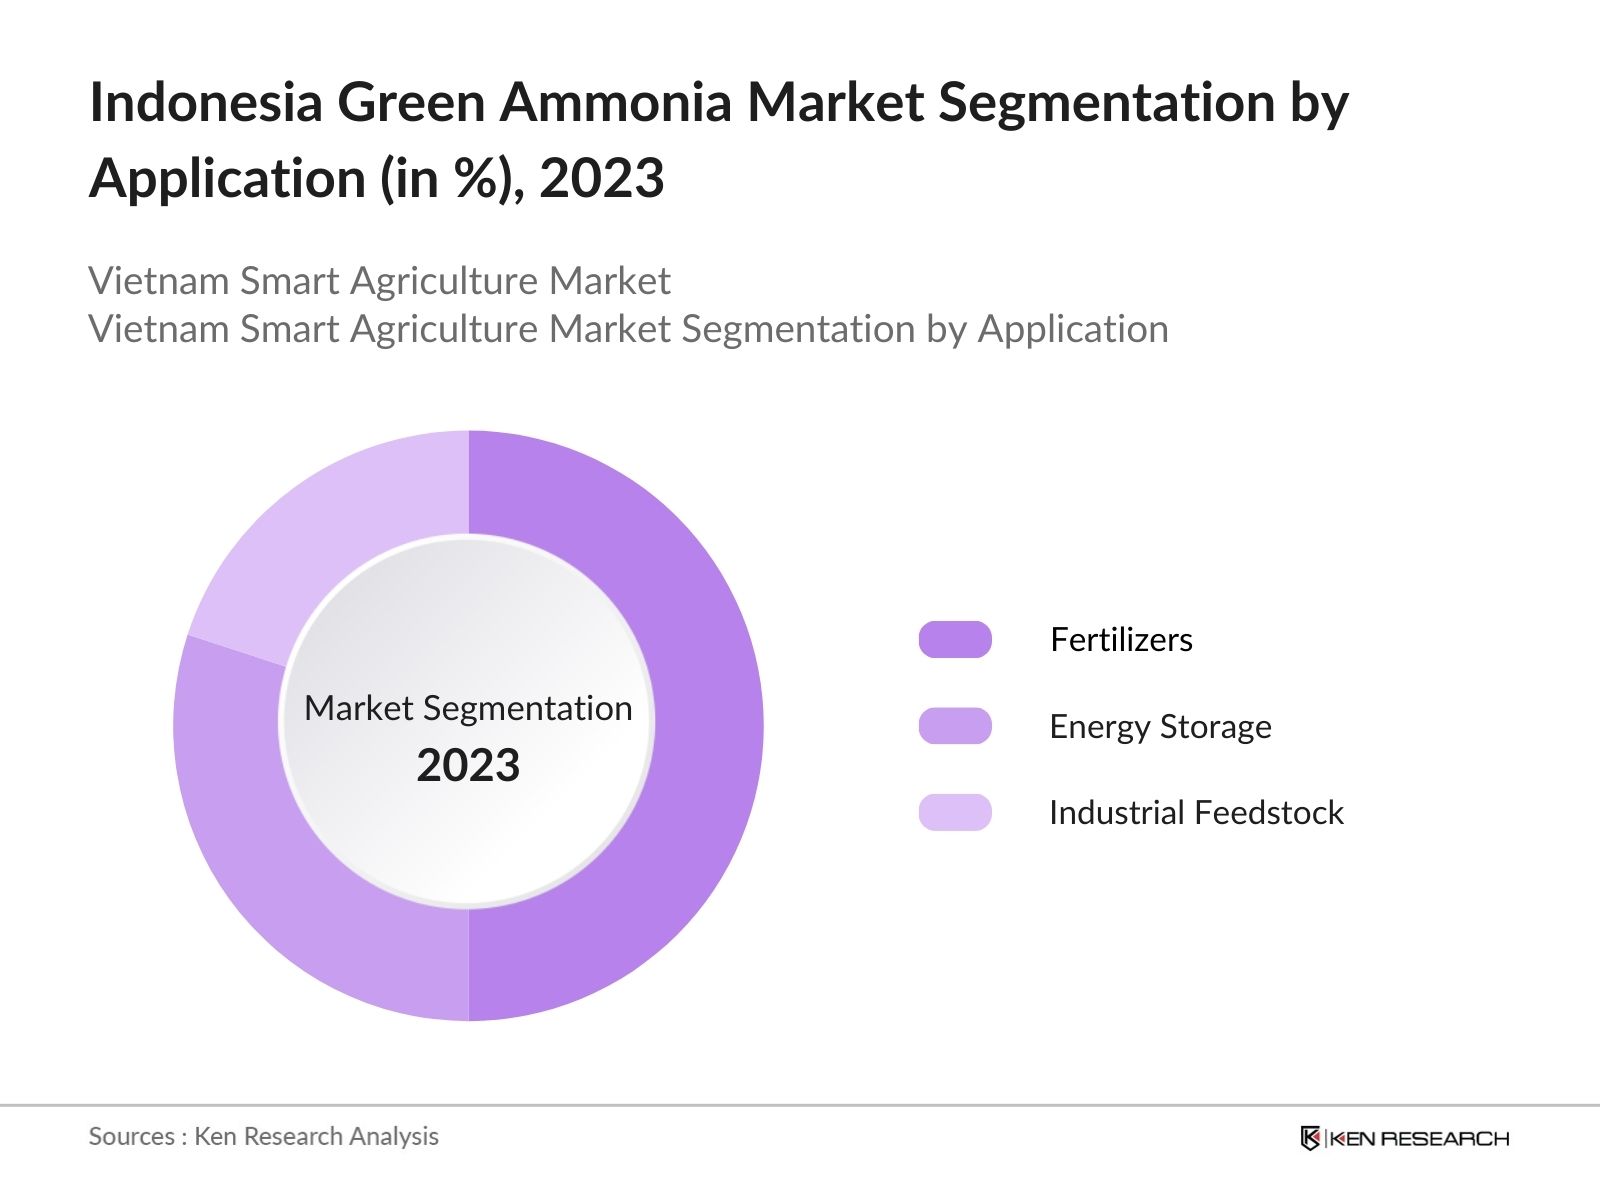
By Application: The Indonesia green ammonia market is further segmented by application into Fertilizers, Energy Storage, and Industrial Feedstock. In 2023, fertilizers dominated the market accounting for 50%. This is driven by the agricultural sector's need for sustainable and eco-friendly fertilizers to enhance crop yields and soil health. The energy storage segment is also gaining traction due to the increasing demand for renewable energy solutions.
By Region: The Indonesia green ammonia market is segmented by region into North, South, East, and West Indonesia. In 2023, East dominated the market. This is due to the region's significant investments in renewable energy projects and the establishment of new green ammonia production facilities. The favorable government policies and incentives in East Indonesia have also contributed to its market dominance.
The Indonesia Green Ammonia Market is expected to grow significantly by 2028, with a respectable CAGR during the period of 2023-2028, driven by technological advancements and the expansion of green energy solutions.
|
By Production Technology |
Electrolysis Biomass Gasification |
|
By Application |
Fertilizers Energy Storage Industrial Feedstock |
|
By Region |
North South East West |
1.1 Indonesia Green Ammonia Market Taxonomy
3.1 Indonesia Green Ammonia Market Growth Drivers
3.2 Indonesia Green Ammonia Market Challenges and Issues
3.3 Indonesia Green Ammonia Market Trends and Development
3.4 Indonesia Green Ammonia Market Government Initiatives
3.5 Indonesia Green Ammonia Market SWOT Analysis
3.6 Indonesia Green Ammonia Market Stakeholder Ecosystem
3.7 Indonesia Green Ammonia Market Competitive Landscape
4.1 Indonesia Green Ammonia Market Segmentation by Production Technology (in value %), 2023
4.2 Indonesia Green Ammonia Market Segmentation by Application (in value %), 2023
4.3 Indonesia Green Ammonia Market Segmentation by Region (in value %), 2023
5.1 Indonesia Green Ammonia Market Cross-Comparison (no. of employees, company overview, business strategy, USP, recent development, operational parameters,
financial parameters, and advanced analytics)
7.1 Indonesia Green Ammonia Market Segmentation by Production Technology (in value %), 2028
7.2 Indonesia Green Ammonia Market Segmentation by Application (in value %), 2028
7.3 Indonesia Green Ammonia Market Segmentation by Region (in value %), 2028
8.1 Indonesia Green Ammonia Market TAM/SAM/SOM Analysis
8.2 Indonesia Green Ammonia Market Customer Cohort Analysis
8.3 Indonesia Green Ammonia Market Marketing Initiatives
8.4 Indonesia Green Ammonia Market White Space Opportunity Analysis
Disclaimer Contact UsEcosystem creation for all the major entities and referring to multiple secondary and proprietary databases to perform desk research around the market to collate industry-level information.
Collating statistics on the Indonesia Green Ammonia Market over the years, penetration of marketplaces, and service providers ratio to compute revenue generated for the Indonesia Green Ammonia Market. We will also review service quality statistics to understand revenue generated, ensuring accuracy behind the data points shared.
Building market hypotheses and conducting CATIs with industry experts belonging to different companies to validate statistics and seek operational and financial information from company representatives.
Our team will approach multiple green ammonia suppliers and distributors to understand the nature of product segments and sales, consumer preference, and other parameters, supporting us to validate statistics derived through a bottom-up approach from green ammonia suppliers and distributors companies.
01 How big is the Indonesia Green Ammonia Market?
In recent years, the Indonesia green ammonia market has experienced substantial growth, this is reflected by the global green ammonia market reached a valuation of USD 132.75 million.
02 What are the growth drivers of the Indonesia Green Ammonia Market?
The Indonesia green ammonia market is propelled by government initiatives, technological advancements, and increasing demand for clean energy solutions.
03 What are the challenges faced by the Indonesia Green Ammonia Market?
Challenges in Indonesia green ammonia market include high production costs, infrastructure development needs, and market competition.
04 Who are the major players in the Indonesia Green Ammonia Market?
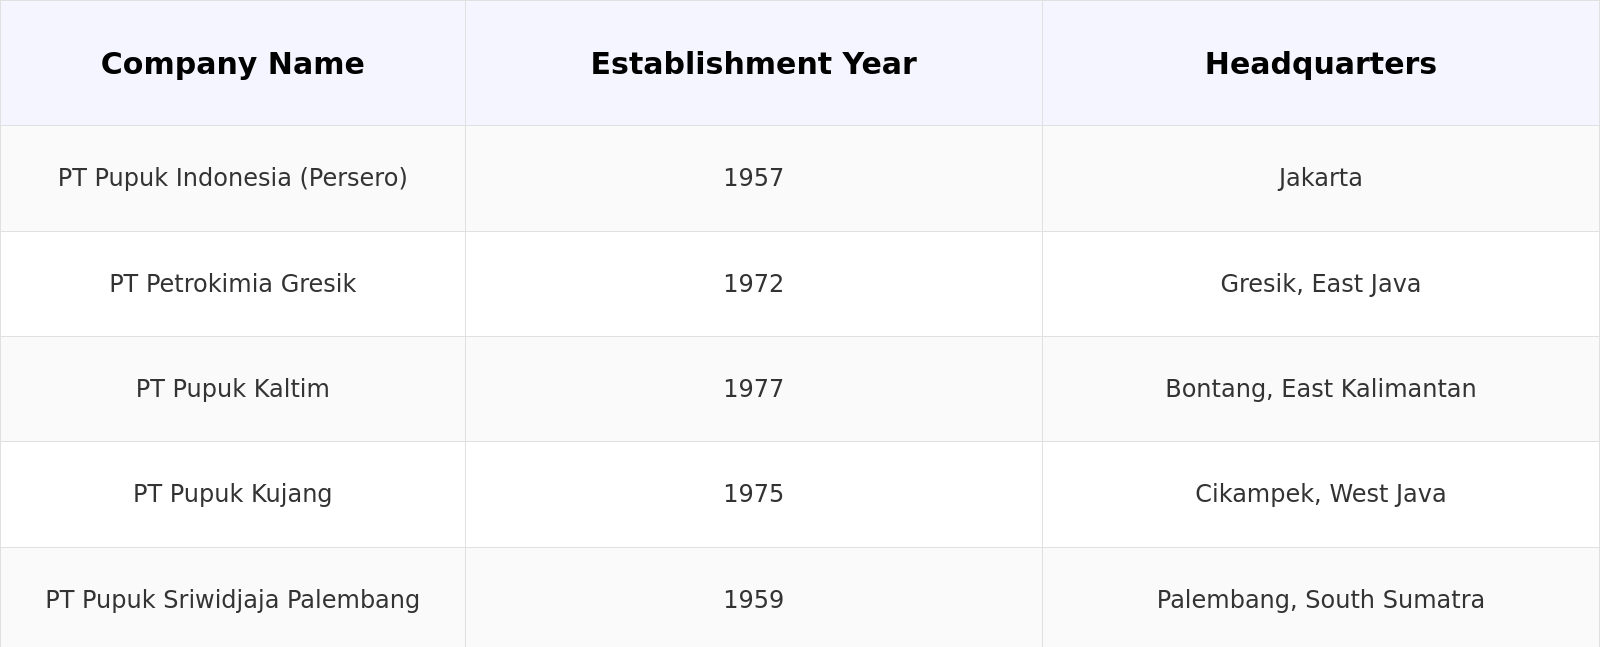
Key players in the Indonesia green ammonia market include PT Pupuk Indonesia (Persero), PT Pertamina (Persero), PT Panca Amara Utama, and PT Pupuk Kaltim, among others.

What makes us stand out is that our consultants follows Robust, Refine and Result (RRR) methodology. i.e. Robust for clear definitions, approaches and sanity checking, Refine for differentiating respondents facts and opinions and Result for presenting data with story

We have set a benchmark in the industry by offering our clients with syndicated and customized market research reports featuring coverage of entire market as well as meticulous research and analyst insights.

While we don't replace traditional research, we flip the method upside down. Our dual approach of Top Bottom & Bottom Top ensures quality deliverable by not just verifying company fundamentals but also looking at the sector and macroeconomic factors.

With one step in the future, our research team constantly tries to show you the bigger picture. We help with some of the tough questions you may encounter along the way: How is the industry positioned? Best marketing channel? KPI's of competitors? By aligning every element, we help maximize success.

Our report gives you instant access to the answers and sources that other companies might choose to hide. We elaborate each steps of research methodology we have used and showcase you the sample size to earn your trust.

If you need any support, we are here! We pride ourselves on universe strength, data quality, and quick, friendly, and professional service.