CHAPTER 1 - MARKET SUMMARY
Market Overview
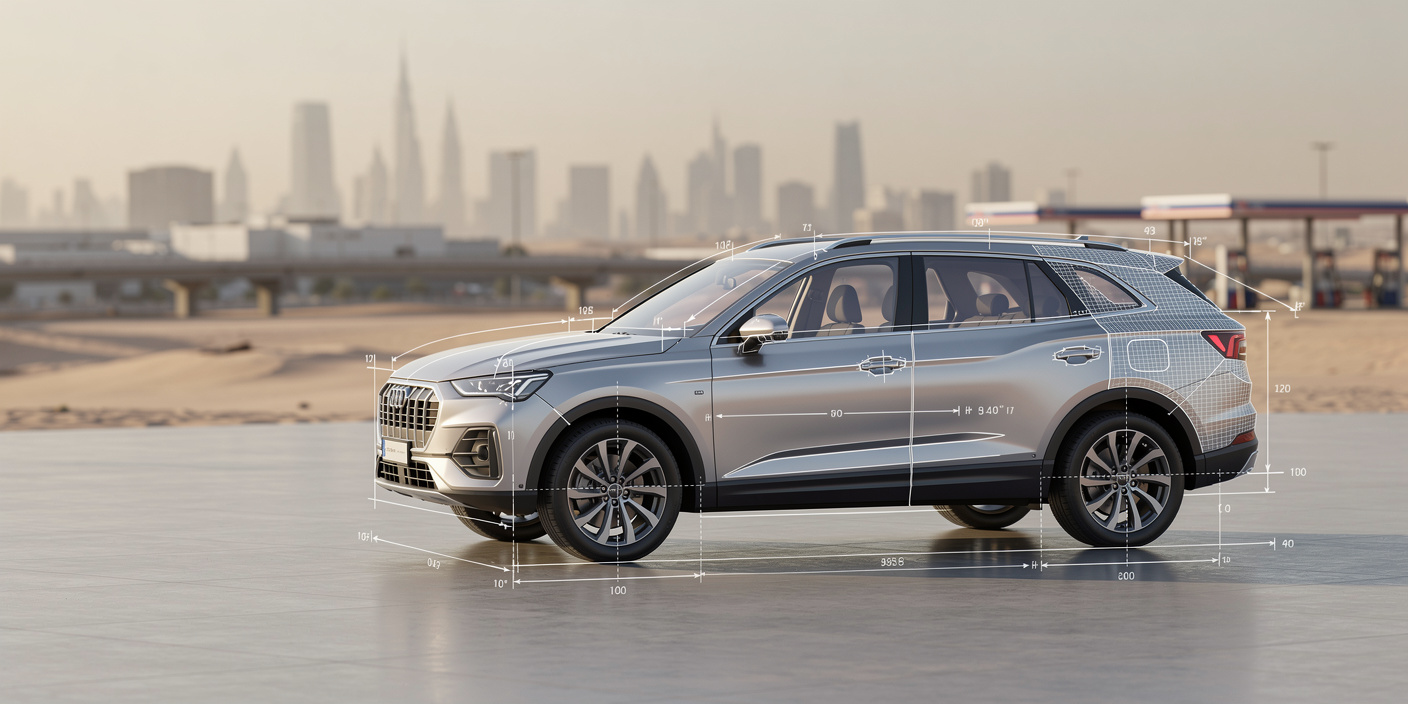
The KSA Automotive Industry Market operates through global vehicle manufacturers, exclusive national distributors, dealer networks, fleet procurement channels, financing providers, and aftersales ecosystems. Approximately 834,820 new vehicles were sold in 2025, with private purchases accounting for an estimated 76% of demand. Population growth, intercity mobility, family vehicle ownership, and fleet renewal sustain recurring transaction volumes across passenger and commercial categories.
Demand and distribution are concentrated around Riyadh, Makkah, Jeddah, Dammam, and the Eastern Province. Riyadh represented an estimated 39% of 2025 new-vehicle transaction value, reflecting its population concentration, corporate fleet base, government procurement activity, and expanding road network. The Makkah Region followed with 28%, supported by tourism, pilgrimage transportation, rental fleets, and logistics requirements.
Market Value
USD 29,219 million
2025
Dominant Region
Riyadh Region
2025
Dominant Segment
SUVs and Crossovers
fastest growing vehicle category, 2025
Total Number of Players
68
Future Outlook
The KSA Automotive Industry Market is projected to increase from USD 29,219 Mn in 2025 to USD 41,960 Mn by 2031, representing a forecast CAGR of 6.2%. Growth follows a 15.2% historical CAGR during 2020-2025, when the market recovered from pandemic-related disruption and benefited from stronger household mobility, female driver participation, fleet procurement, construction activity, tourism expansion, and improved product availability. New vehicle sales are forecast to exceed 1.05 million units by 2031, while transaction-value growth will also reflect higher safety specifications, connected features, larger vehicle formats, and electrified powertrain content.
Passenger vehicles will remain the largest revenue pool, but commercial vehicles, hybrids, battery electric vehicles, charging solutions, and locally assembled models will capture incremental investment. Announced projects include Lucid capacity of up to 155,000 vehicles annually, Hyundai capacity of 50,000 vehicles, a 3.5 million-unit tire plant, and Ceer's developing manufacturing ecosystem. Market growth is expected to moderate after 2028 as penetration rises, while average selling prices increase from approximately USD 35,000 in 2025 to USD 39,800 by 2031. Profit pools will progressively shift from import distribution toward localization, financing, software, batteries, and aftersales services.
6.2%
Forecast CAGR
$41,960 Mn
2030 Projection
Base Year
2025
Historical Period
2020-2025
Forecast Period
2026-2031
Historical CAGR
15.2%
CHAPTER 2 - SCOPE OF REPORT
Scope of the Market
CHAPTER 3 - Key Stakeholders
Key Target Audience
Key stakeholders who can leverage from this market analysis for investment, strategy, and operational planning.
Investors
CAGR, localization returns, capex intensity, technology risk
Corporates
fleet economics, procurement pricing, uptime, residual value
Government
localization, employment, emissions, compliance, industrial exports
Operators
inventory turns, service throughput, finance conversion, retention
Financial institutions
credit risk, leasing yields, residual values, demand stability
CHAPTER 4 - Market Size & Growth
Market Size, Growth Forecast and Trends
This section evaluates the historical market size, analyzes year-over-year growth dynamics, and presents forecast projections supported by market performance indicators and demand-side drivers.
Historical & Projected Market Size ($ Million)
Year-over-Year Growth Rate (%)
Market Value vs Volume Growth (%)
Historical Market Performance (2020-2025)
The 2020 pandemic period represented the historical trough at USD 14,391 Mn and approximately 452,544 vehicle sales. The strongest annual value increases occurred in 2021 and 2023, at 24.5% and 23.9%, respectively, as delayed purchases, dealership inventories, and fleet procurement recovered. Sales exceeded 805,000 units in 2024, while the average selling price increased to approximately USD 34,200. Market growth moderated to 6.1% in 2025 as supply constraints eased and demand normalized.
Forecast Market Outlook (2026-2031)
Market value is forecast to expand at a 6.2% CAGR, reaching USD 41,960 Mn in 2031. Annual vehicle sales are projected to exceed 1.05 million units, while average selling prices rise to approximately USD 39,800. The strongest forecast acceleration is expected during 2027-2028 as hybrid availability, localization, corporate fleet replacement, tourism transportation, and manufacturing investments scale. Growth moderates after 2029 as vehicle ownership penetration increases and replacement demand becomes a larger share of transactions.
CHAPTER 5 - Market Data
Market Breakdown
The market is progressing from post-pandemic volume recovery toward a more balanced growth model based on replacement cycles, commercial mobility, higher vehicle specifications, localization, and electrification. The following operating KPIs identify the volume, pricing, and supply-side variables most relevant to automotive executives and investors.
Year | Market Size (USD Mn) | YoY Growth (%) | New Vehicle Sales (000 Units) | Average Selling Price (USD) | Local Assembly Share (%) | Period |
|---|---|---|---|---|---|---|
| 2020 | $14,391 Mn | +- | 452.5 | 31,800 | Forecast | |
| 2021 | $17,921 Mn | +24.5% | 556.6 | 32,200 | Forecast | |
| 2022 | $20,463 Mn | +14.2% | 625.8 | 32,700 | Forecast | |
| 2023 | $25,344 Mn | +23.9% | 758.8 | 33,400 | Forecast | |
| 2024 | $27,532 Mn | +8.6% | 805.0 | 34,200 | Forecast | |
| 2025 | $29,219 Mn | +6.1% | 834.8 | 35,000 | Forecast | |
| 2026 | $31,082 Mn | +6.4% | 868.2 | 35,800 | Forecast | |
| 2027 | $33,111 Mn | +6.5% | 904.7 | 36,600 | Forecast | |
| 2028 | $35,290 Mn | +6.6% | 943.6 | 37,400 | Forecast | |
| 2029 | $37,487 Mn | +6.2% | 981.3 | 38,200 | Forecast | |
| 2030 | $39,726 Mn | +6.0% | 1,018.6 | 39,000 | Forecast | |
| 2031 | $41,960 Mn | +5.6% | 1,054.3 | 39,800 | Forecast |
New Vehicle Sales
834,820 units, 2025, Saudi Arabia. Sales scale supports large national dealer networks and recurring aftersales revenue. Saudi Arabia recorded 805,034 motor vehicle sales in 2024, according to OICA-linked data.
Average Selling Price
USD 35,000, 2025, Saudi Arabia. Larger SUVs, premium specifications, safety technology, and connected features increase revenue faster than unit volumes. SUVs and crossovers represented an estimated 48% of light-vehicle transaction value.
Local Assembly Share
1.2%, 2025, Saudi Arabia. The low share indicates a substantial localization whitespace. Lucid's Saudi facility has initial capacity of 5,000 vehicles and planned incremental capacity of 150,000 units.
CHAPTER 6 - Segmentation
Market Segmentation Framework
Comprehensive analysis across key dimensions providing insights into market structure, consumer preferences, and distribution patterns.
No of Segments
7
Dominant Segment
Vehicle Type
Fastest Growing Segment
Powertrain
Vehicle Type
Customer Type
Sales Channel
Powertrain
Usage Type
Price Tier
Geography
Key Segmentation Takeaways
Comprehensive analysis across all extracted segmentation dimensions providing insights into market structure, consumer preferences, and distribution patterns.
Vehicle Type
SUVs and crossovers constitute the dominant transaction pool because Saudi households prioritize cabin capacity, ground clearance, long-distance comfort, cooling performance, and residual value. Full-size and mid-size SUVs support stronger dealer margins than economy sedans, while pickups and light commercial vehicles remain important for construction, logistics, utilities, and small-business operations.
Powertrain
Hybrid electric and battery electric vehicles are the fastest-growing sub-segments as fuel-economy standards, government procurement, charging investment, and domestic manufacturing broaden availability. Hybrid vehicles provide a lower-infrastructure transition pathway, while battery electric growth depends on charging density, heat-tested performance, financing, residual-value confidence, and competitive model pricing.
CHAPTER 7 - Regional Analysis
Regional Analysis
Saudi Arabia is the second-largest automotive transaction market among selected Middle Eastern peers, behind Turkey and ahead of the UAE, Egypt, Kuwait, and Qatar. Its scale is supported by more than 800,000 annual vehicle sales, high intercity mobility, extensive fleet demand, and public investment in domestic assembly.
Focus Country Ranking
2nd
Focus Country Market Size
USD 29.2 Bn (2025)
Saudi Arabia CAGR (2026-2031)
6.2%
Focus Country Ranking
2nd
Focus Country Market Size
USD 29.2 Bn (2025)
Saudi Arabia CAGR (2026-2031)
6.2%
Regional Analysis (Current Year)
Regional Analysis Comparison
| Metric | Turkey | Saudi Arabia | United Arab Emirates | Kuwait | Egypt | Qatar |
|---|---|---|---|---|---|---|
| Market Size (2025) | USD 36.1 Bn | USD 29.2 Bn | USD 13.1 Bn | USD 4.9 Bn | USD 4.0 Bn | USD 3.0 Bn |
| CAGR (2026-2031) | 4.6% | 6.2% | 5.5% | 3.8% | 8.1% | 4.1% |
Market Position
Saudi Arabia ranks second among selected peers, with an estimated USD 29.2 Bn market and 835,000 vehicle sales, supported by the GCC's largest addressable automotive demand base.
Growth Advantage
Saudi Arabia's 6.2% forecast CAGR exceeds Turkey's 4.6% and Kuwait's 3.8%, while remaining below Egypt's recovery-led 8.1% growth from a smaller base.
Competitive Strengths
Saudi Arabia combines 835,000 annual sales, planned vehicle capacity exceeding 200,000 units, and a 3.5 million-unit tire project, improving localization and supplier economics.
CHAPTER 8 - INDUSTRY ANALYSIS
Growth Drivers, Market Challenges & Market Opportunities
Comprehensive analysis of key factors shaping the KSA Automotive Industry Market, including growth catalysts, operational challenges, and emerging opportunities across production, distribution, and consumer segments.
Growth Drivers
Large and Expanding Vehicle Demand Base
- New vehicle registrations exceeded 1 million units (2024, GASTAT/Saudi Arabia), indicating substantial underlying demand beyond brand-reported retail sales and creating recurring distributor throughput.
- The active vehicle fleet increased by 6.9% (2024, GASTAT/Saudi Arabia), expanding the installed base for parts, service contracts, tires, lubricants, insurance, and digital maintenance platforms.
- Saudi Arabia recorded approximately 805,034 vehicle sales (2024, OICA/Saudi Arabia), providing OEMs with sufficient scale to support dedicated model strategies, regional inventories, and national dealer coverage.
Automotive Manufacturing Localization
- Lucid's Saudi facility targets 155,000 vehicles annually (planned capacity, Lucid/Saudi Arabia), creating demand for components, logistics, workforce training, testing, charging, and supplier quality systems.
- The Hyundai-PIF project targets 50,000 vehicles annually (planned capacity, PIF/Saudi Arabia), including combustion and battery-powered vehicles, supporting mixed-powertrain industrial development.
- Companies within the King Salman Automotive Cluster are expected to contribute approximately SAR 92 Bn cumulatively by 2035 (PIF/Saudi Arabia), strengthening the business case for local suppliers and service providers.
Infrastructure, Tourism and Fleet Expansion
- Construction, logistics, tourism, and municipal programs support projected light and heavy commercial vehicle sales of 177,000 units (2031, Saudi Arabia), improving fleet leasing and maintenance demand.
- Mobility and rental operators represented an estimated 9% of new vehicle demand (2025, Saudi Arabia), with tourism and pilgrimage transport creating high-utilization replacement cycles.
- Riyadh accounted for approximately 39% of transaction value (2025, Saudi Arabia), making metropolitan dealer density, workshop capacity, fleet sales, and charging infrastructure central to market access.
Market Challenges
High Import Dependence and Supply-Chain Exposure
- Local assembly represented only 1.2% of market volume (2025, Saudi Arabia), limiting domestic supply flexibility and increasing exposure to shipping schedules, foreign factories, and currency movements.
- Japanese, Korean, Chinese, American, and Indian production hubs supply most Saudi vehicles, meaning geopolitical or maritime disruption can affect more than 98% of current demand (2025 estimate, Saudi Arabia).
- Distributor inventory must cover long import lead times, tying up working capital across an estimated 834,820-unit annual market (2025, Saudi Arabia) and increasing discount risk during model-year transitions.
Electric Vehicle Infrastructure and Residual-Value Uncertainty
- The national ambition for electric vehicle penetration requires charging coverage beyond major cities, while approximately 61% of transaction value (2025, Saudi Arabia) remains outside Riyadh.
- Extreme temperatures can affect battery performance, cooling requirements, and charging speeds, increasing technology-validation costs for vehicles expected to operate within a 15.8 million-unit fleet (2024, Saudi Arabia).
- Limited used-EV transaction history constrains residual-value benchmarks, increasing finance risk for leases that typically depend on three-to-five-year disposal values (2025 industry practice, Saudi Arabia).
Price Affordability and Financing Sensitivity
- Vehicle specifications, safety technology, freight, insurance, and financing costs contributed to estimated ASP growth of 2.3% (2025, Saudi Arabia), requiring broader entry-level product portfolios.
- Approximately 68% of private retail purchases (2025 estimate, Saudi Arabia) involve financing or leasing, making approval rates and monthly installments critical to conversion.
- Economy vehicles represented an estimated 24% of transaction value but 39% of unit demand (2025, Saudi Arabia), creating thin-margin competition among distributors and Chinese entrants.
Market Opportunities
Localized Vehicle and Component Production
- Component manufacturers can target batteries, electronics, plastics, glass, seating, wiring, castings, and thermal systems for facilities planning up to 155,000 Lucid vehicles annually (planned, Saudi Arabia).
- Investors and local manufacturers benefit from supplier contracts and industrial incentives, while distributors gain shorter lead times and localized product configurations for an estimated USD 29.2 Bn market (2025, Saudi Arabia).
- Opportunity realization requires certified quality systems, local engineering talent, competitive utilities, tooling finance, and volume commitments sufficient to move local assembly share toward 15% by 2031 (base scenario, Saudi Arabia).
Electric Mobility and Charging Services
- Charging operators can monetize public fast charging, residential installation, fleet charging, energy management, and maintenance as annual battery electric sales approach 105,000 units by 2031 (base scenario, Saudi Arabia).
- OEMs, utilities, property developers, fleet operators, and financial institutions benefit from charging subscriptions, bundled energy contracts, battery warranties, and lower operating costs for high-mileage fleets.
- The opportunity requires interoperable payment systems, reliable grid connections, heat-rated chargers, standardized maintenance, and network expansion beyond the three largest metropolitan clusters serving 39% of market value outside Riyadh and Makkah (2025, Saudi Arabia).
Automotive Finance, Data and Lifecycle Platforms
- Banks and finance companies can monetize instant approvals, subscriptions, leasing, insurance bundles, service plans, and residual-value products across approximately 635,000 private vehicle transactions (2025, Saudi Arabia).
- Dealers, insurers, workshops, and fleet operators benefit from connected diagnostics, predictive maintenance, digital service booking, usage-based insurance, and structured remarketing.
- Scaled adoption requires consent-based vehicle data access, cybersecurity controls, standardized condition records, and integrated digital identities for a fleet exceeding 15.8 million vehicles (2024, Saudi Arabia).
CHAPTER 9 - Competitive Landscape
Competitive Landscape Overview
The KSA Automotive Industry Market is moderately concentrated, with the top ten manufacturers representing an estimated 80.2% of 2025 transaction value. Competition depends on product availability, distributor reach, resale value, fleet relationships, financing, service coverage, parts availability, and adaptation to Saudi operating conditions.
Market Share Distribution
Top 5 Players
Market Dynamics
8 new entrants in the past 5 years, indicating strong market attractiveness and growth potential.
Company Name | Market Share | Headquarters | Founding Year | Core Market Focus |
|---|---|---|---|---|
Toyota Motor Corporation | 28.6% | Toyota City, Japan | 1937 | Passenger cars, SUVs, pickups, hybrids and fleet vehicles |
Hyundai Motor Company | 14.0% | Seoul, South Korea | 1967 | Mass-market sedans, SUVs, fleets and electrified vehicles |
Kia Corporation | 8.7% | Seoul, South Korea | 1944 | Passenger cars, crossovers, SUVs and electric vehicles |
Ford Motor Company | 5.9% | Dearborn, United States | 1903 | SUVs, pickups, performance vehicles and commercial fleets |
Nissan Motor Co., Ltd. | 5.7% | Yokohama, Japan | 1933 | Sedans, SUVs, pickups and fleet vehicles |
Suzuki Motor Corporation | 3.9% | Hamamatsu, Japan | 1909 | Economy passenger cars and compact utility vehicles |
Mazda Motor Corporation | 4.1% | Fuchu, Hiroshima, Japan | 1920 | Passenger cars, crossovers and premium mass-market vehicles |
Geely Automobile Holdings | 3.3% | Hangzhou, China | 1986 | Technology-focused sedans, SUVs and electrified vehicles |
Changan Automobile | 3.1% | Chongqing, China | 1862 | Value-oriented sedans, SUVs and new-energy vehicles |
Isuzu Motors Limited | 2.9% | Yokohama, Japan | 1916 | Pickups, light trucks and medium commercial vehicles |
Cross Comparison Parameters
The report provides detailed cross-comparison of key players across 10 performance parameters to identify competitive strengths and weaknesses.
Saudi Vehicle Sales Volume
Dealer and Service Network Coverage
Saudi Automotive Revenue Growth
Estimated Gross Margin per Vehicle
Analysis Covered
Market Share Analysis:
Compares manufacturer transaction value and unit sales concentration levels.
Cross Comparison Matrix:
Benchmarks networks, volumes, financial growth, pricing and localization capabilities.
SWOT Analysis:
Assesses brand strength, supply exposure, product gaps and opportunities.
Pricing Strategy Analysis:
Evaluates model ladders, incentives, financing and lifecycle value propositions.
Company Profiles:
Reviews portfolios, distribution structures, positioning and Saudi market priorities.
CHAPTER 10 - REPORT TOC
CHAPTER 14 - Table Of Contents
Phase 1Market Assessment Phase
11
Chapters
Supply-side and competitive intelligence covering market sizing, segmentation, competitive dynamics, regulatory landscape, and future forecasts.
Phase 2Go-To-Market Strategy Phase
15
Chapters
Entry strategy evaluation, execution roadmap, partner recommendations, and profitability outlook.
Complete Report Coverage
201+ detailed sections covering every aspect of the market
143
Assessment Sections
58
Strategy Sections
CHAPTER 11 - Our Approach
Research Methodology
Desk Research
- Vehicle sales and registration analysis
- Automotive import value assessment
- OEM filing and capacity review
- Standards and policy evaluation
Primary Research
- Automotive distributor chief executives
- OEM regional sales directors
- Fleet procurement and leasing heads
- Dealer aftersales operations managers
Validation and Triangulation
- 276 automotive respondents interviewed
- Sales versus registrations reconciled
- Pricing and volume cross-checked
- Manufacturer shares independently validated
CHAPTER 12 - FAQ
FAQs
Still have questions?
Our research team is here to help you find the right solution
CHAPTER 13 - Related Research
Explore Related Reports
Expand your market intelligence with complementary research across regions and adjacent markets.
Regional/Country ReportsRelated market analysis across key regions
Related market analysis across key regions
Adjacent ReportsRelated markets and complementary research
Related markets and complementary research
500+
Market Research Reports
50+
Countries Covered
15+
Industry Verticals