CHAPTER 1 - MARKET SUMMARY
Market Overview
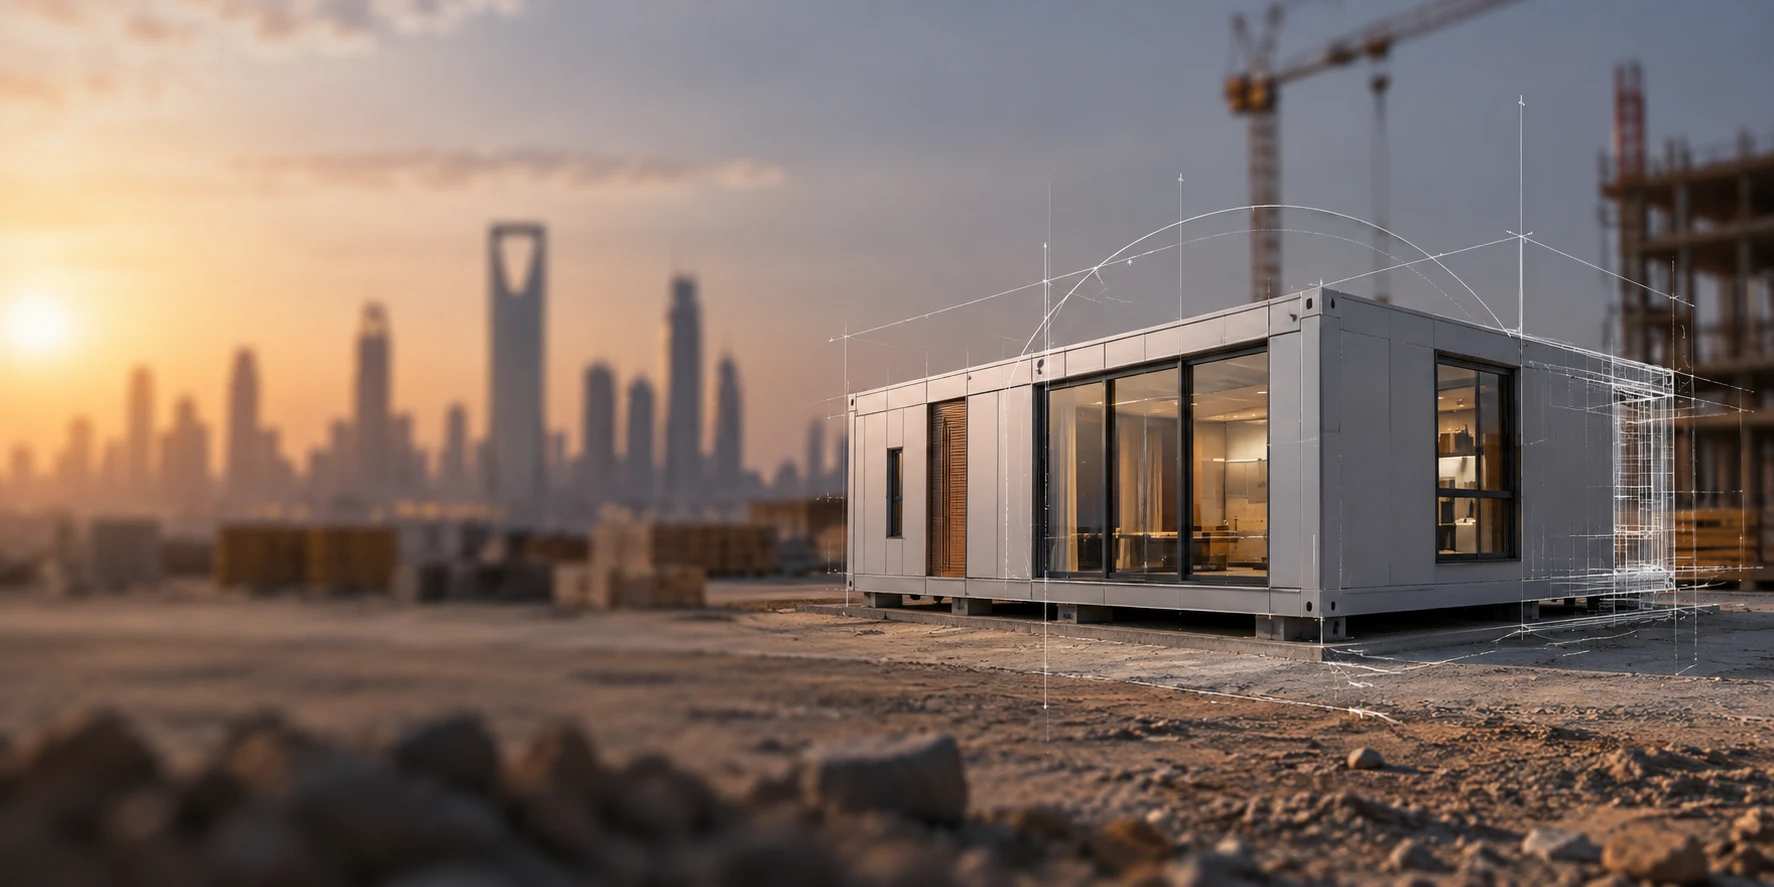
The KSA Modular Construction Market operates through design standardization, factory fabrication, logistics and rapid on-site assembly. Demand is anchored in a national population of 35.3 million in 2024 and a housing agenda targeting 70% homeownership by 2030. Commercial value concentrates where repeatable room layouts, compressed schedules and remote-site conditions justify upfront engineering and factory mobilization.
Riyadh is the primary commercial hub because it combines government procurement, residential masterplans and major event infrastructure. The city represented 34.6% of Saudi prefabricated-building activity in 2025, while the Central Region hosts dense contractor, consultant and logistics networks. This concentration improves factory utilization, shortens module transport distances and supports repeat orders across residential, hospitality and public-building programs.
Market Value
USD 880 million
2025
Dominant Region
Central Region
Dominant Segment
Permanent Modular Construction
fastest growing
Total Number of Players
42
Future Outlook
The KSA Modular Construction Market is projected to rise from USD 880 million in 2025 to USD 1,538 million by 2031. Historical growth of 8.70% during 2020-2025 reflected post-pandemic project normalization, accelerated residential delivery and expanded demand for workforce accommodation. Forecast growth of 9.75% during 2026-2031 is supported by repeatable building programs, hospitality capacity additions and public infrastructure deadlines. Volume is expected to increase faster than the broader construction market as developers adopt factory production to reduce schedule uncertainty, improve quality assurance and lower on-site labor intensity across geographically dispersed projects.
Permanent modular buildings will capture the strongest profit-pool expansion as specifications move from basic site units toward code-compliant residential, healthcare, education and hotel assets. Steel-framed volumetric systems should remain the principal platform, while precast and hybrid solutions gain share in multi-storey projects. The forecast assumes measured expansion of domestic factory capacity, wider BIM-led design standardization and improved financing for manufacturing-intensive delivery models. Downside risk arises from project rephasing, logistics constraints and low facility utilization; upside emerges if giga-project packages, World Expo preparation and homeownership programs aggregate demand into repeatable, multi-site procurement frameworks.
9.75%
Forecast CAGR
$1,538 Mn
2030 Projection
Base Year
2025
Historical Period
2020-2025
Forecast Period
2026-2031
Historical CAGR
8.70%
CHAPTER 2 - SCOPE OF REPORT
Scope of the Market
CHAPTER 3 - Key Stakeholders
Key Target Audience
Key stakeholders who can leverage from this market analysis for investment, strategy, and operational planning.
Investors
factory utilization, backlog, capex intensity, margin resilience
Corporates
delivery cycle, lifecycle cost, quality, procurement scale
Government
housing delivery, localization, compliance, industrial productivity
Operators
throughput, logistics, installation accuracy, asset reconfiguration
Financial institutions
project finance, offtake visibility, covenants, residual value
CHAPTER 4 - Market Size & Growth
Market Size, Growth Forecast and Trends
This section evaluates the historical market size, analyzes year-over-year growth dynamics, and presents forecast projections supported by market performance indicators and demand-side drivers.
Historical & Projected Market Size ($ Million)
Year-over-Year Growth Rate (%)
Market Value vs Volume Growth (%)
Historical Market Performance (2020-2025)
Historical performance strengthened after the 2020 trough, when delayed projects and supply disruption constrained factory utilization. The largest annual acceleration occurred in 2023, with value growth of 9.87%, followed by 9.73% in 2025 as housing, industrial and hospitality programs expanded. Delivered modular floor area increased from 550 thousand square meters in 2020 to 765 thousand square meters in 2025, indicating that volume growth, rather than price inflation, drove most of the market expansion.
Forecast Market Outlook (2026-2031)
Forecast growth remains near double digits as repeatable permanent modules gain acceptance and new factories improve local supply. The market is projected to reach USD 1,538 million in 2031, representing a 9.75% CAGR from 2025. Delivered volume rises to 1.224 million square meters, while the blended ASP increases more moderately to approximately USD 1,257 per square meter. This mix reflects greater scale efficiency alongside rising specifications for energy, fire, acoustic and digital-building performance.
CHAPTER 5 - Market Data
Market Breakdown
The KSA Modular Construction Market is moving from project-specific temporary units toward standardized, repeatable permanent assets. For CEOs and investors, the key issue is whether factory utilization, delivery-cycle control and specification premiums can convert market growth into sustainable margins.
Year | Market Size (USD Mn) | YoY Growth (%) | Delivered Modular Floor Area (000 sq m) | Blended ASP (USD/sq m) | Permanent Modular Share (%) | Period |
|---|---|---|---|---|---|---|
| 2020 | $580 Mn | +- | 550 | 1,055 | Forecast | |
| 2021 | $617 Mn | +6.38% | 575 | 1,073 | Forecast | |
| 2022 | $669 Mn | +8.43% | 610 | 1,097 | Forecast | |
| 2023 | $735 Mn | +9.87% | 655 | 1,122 | Forecast | |
| 2024 | $802 Mn | +9.12% | 705 | 1,138 | Forecast | |
| 2025 | $880 Mn | +9.73% | 765 | 1,150 | Forecast | |
| 2026 | $964 Mn | +9.55% | 827 | 1,166 | Forecast | |
| 2027 | $1,058 Mn | +9.75% | 891 | 1,187 | Forecast | |
| 2028 | $1,163 Mn | +9.92% | 970 | 1,199 | Forecast | |
| 2029 | $1,278 Mn | +9.89% | 1,048 | 1,219 | Forecast | |
| 2030 | $1,403 Mn | +9.78% | 1,132 | 1,239 | Forecast | |
| 2031 | $1,538 Mn | +9.62% | 1,224 | 1,257 | Forecast |
Delivered Modular Floor Area
765 thousand sq m, 2025, KSA. Rising throughput improves fixed-cost absorption and gives scaled factories a bidding advantage. Modular methods can compress project timelines by 20% to 50%, strengthening the value of reliable annual capacity.
Blended ASP
USD 1,150 per sq m, 2025, KSA. ASP resilience depends on higher-specification permanent assets rather than commodity site cabins. Saudi construction costs increased 1.0% year on year in October 2025, supporting selective price pass-through for compliant systems.
Permanent Modular Share
68%, 2025, KSA. A higher permanent mix improves backlog quality and lifecycle-service potential. Modular buildings accounted for 40.4% of Saudi prefabricated-building demand in 2025, demonstrating a structural shift toward complete building systems.
CHAPTER 6 - Segmentation
Market Segmentation Framework
Comprehensive analysis across key dimensions providing insights into market structure, consumer preferences, and distribution patterns.
No of Segments
7
Dominant Segment
End-Use Sector
Fastest Growing Segment
Technology
Project Type
Asset Type
End-Use Sector
Ownership Model
Contracting Model
Technology
Geography
Key Segmentation Takeaways
Comprehensive analysis across all extracted segmentation dimensions providing insights into market structure, consumer preferences, and distribution patterns.
End-Use Sector
End-use demand determines module specification, financing and repeatability. Residential is the largest addressable pool because master-planned communities can standardize unit layouts across multiple phases, while industrial and public-infrastructure buyers sustain relocatable demand. Hospitality and Tourism provides the strongest specification premium through repeatable guestrooms, staff housing and remote destination facilities.
Technology
Technology is the fastest-growing dimension as automated steel framing, BIM-to-factory workflows and integrated mechanical, electrical and plumbing assemblies reduce rework. Steel-Framed Volumetric remains the principal system, but Light-Gauge Steel and Panelized solutions are expanding where logistics, lower structural weight and localized assembly are more important than fully finished room modules.
CHAPTER 7 - Regional Analysis
Regional Analysis
Saudi Arabia ranks first among selected GCC peers under a narrow modular-building scope, supported by the region's largest construction pipeline and multiple national delivery deadlines. Its scale advantage is reinforced by housing, tourism and industrial programs, although the UAE retains higher modular penetration within total construction spend.
Focus Country Ranking
1st
Focus Country Market Size
USD 880 Mn
KSA CAGR (2026-2031)
9.75%
Focus Country Ranking
1st
Focus Country Market Size
USD 880 Mn
KSA CAGR (2026-2031)
9.75%
Regional Analysis (Current Year)
Market Position
Saudi Arabia ranks first at USD 880 million, ahead of the UAE, because its USD 133.8 billion construction market provides the largest addressable base for repeatable modular packages.
Growth Advantage
KSA's 9.75% forecast CAGR exceeds the UAE's 8.40% and Qatar's 6.80%, positioning the Kingdom as the GCC growth leader as event, tourism and housing deadlines converge.
Competitive Strengths
A 70% homeownership target, 150 million annual tourism visits by 2030 and more than 4,000 MODON factories create diversified demand and a deeper domestic industrial ecosystem.
CHAPTER 8 - INDUSTRY ANALYSIS
Growth Drivers, Challenges & Opportunities
Comprehensive analysis of key factors shaping the KSA Modular Construction Market, including growth catalysts, operational challenges, and emerging opportunities across production, distribution, and consumer segments.
Growth Drivers
Housing Delivery and Homeownership Programs
- Homeownership reached 66.24% (2025, KSA), keeping residential supply expansion central to national policy and favoring suppliers able to replicate designs across multi-phase communities.
- A population of 35.3 million (2024, KSA) expands the long-term housing and public-service asset base, supporting factory investment where annual order visibility can be secured.
- Modular construction can shorten delivery schedules by 20% to 50% (2019, global benchmark), allowing developers to recognize revenue and hand over units earlier.
Tourism, Events and Hospitality Capacity
- Saudi Arabia recorded 116 million tourism visits (2024, KSA), strengthening the case for repeatable guestrooms, resort villas and back-of-house modules in high-growth destinations.
- Commercial buildings are forecast to expand at 9.07% CAGR (2026-2031, KSA prefabricated market), opening higher-specification opportunities beyond temporary camps.
- World Expo and major sporting-event programs concentrate completion risk, making 30% to 50% faster completion (2025, modular benchmark) commercially valuable for venue-adjacent accommodation and services.
Industrial Expansion and Remote-Site Requirements
- Industrial cities manage approximately 8,000 industrial and investment contracts (2025, KSA), creating a broad customer pool for standardized support buildings and lease fleets.
- MODON's industrial-city area exceeds 979.7 million sq m (2025, KSA), increasing the economic value of off-site production for dispersed and remote project locations.
- Relocatable modules reduce stranded-asset risk where industrial projects move through construction and operating phases, enabling recurring lease revenue over multi-year project cycles (2026-2031, KSA).
Market Challenges
Factory Utilization and Upfront Capital Exposure
- Factory investment precedes order conversion, so low utilization increases unit costs and working-capital pressure; operators need 12 to 24 months backlog visibility (2025, industry benchmark) before adding lines.
- Initial modular project costs can be 20% to 30% above conventional methods (2025, KSA benchmark) when engineering, transport and factory setup are not amortized across repeat orders. kenresearch.com
- Volatile award timing creates capacity mismatch; Saudi building permits fell 33.3% year on year (May 2026, KSA), illustrating the risk of short-cycle project rephasing.
Logistics, Transport and Site Interface Complexity
- Long factory-to-site distances can offset labor savings, particularly for northern and southern projects; transport planning must account for 45 degrees Celsius summer temperatures (2026, central KSA).
- Module dimensions are constrained by road clearances, crane access and urban delivery windows, requiring earlier design freeze than conventional projects and increasing change-order exposure after factory release milestones (2025, industry practice).
- Site foundations, utilities and modules must converge precisely; schedule benefits can erode when interface errors delay assembly beyond the intended 20% to 50% acceleration range (2019, global benchmark).
Design Standardization and Regulatory Coordination
- Late architectural customization undermines factory repetition; value engineering must occur before production because design changes after release can affect 100% of repeated modules (2025, project benchmark).
- Research on construction digitalization identified 74 BIM adoption obstacles (2013-2023, global review), including training, standards and business-value clarity, which remain relevant to factory-integrated delivery.
- Mostadam and green-code requirements raise documentation needs but reward traceability; suppliers without integrated design, quality and compliance teams face longer approvals across multiple regional authorities (2026, KSA).
Market Opportunities
Permanent Modular Hospitality and Residential Platforms
- standardized room modules support design reuse and procurement leverage, with potential construction-cost savings of up to 20% (2023, global benchmark) at scale.
- developers, hotel owners and lenders gain earlier asset operation because modular methods can accelerate timelines by 20% to 50% (2023, global benchmark).
- owners need repeatable specifications and multi-project procurement commitments that raise factory utilization above 70% operating levels (2026-2031, modeled threshold).
Localized Automated Manufacturing
- automated framing, welding and finishing reduce labor variability and support premium pricing for predictable tolerances across 4,000 units per month planned capacity (2026, KSA).
- local manufacturers, component suppliers and technology integrators capture value as procurement shifts from imported modules toward domestic value addition across more than 4,000 factories (2025, KSA).
- order aggregation, long-term offtake and workforce training are required to avoid underutilized automation and achieve the targeted Industry 4.0 production model (2026, KSA).
Lifecycle Leasing and Reconfiguration Services
- lease, maintenance, relocation and refurbishment contracts create recurring revenue beyond initial fabrication across three to five asset deployments (2026-2031, modeled lifecycle).
- industrial operators reduce upfront capital while modular providers improve lifetime revenue per unit through multi-year service agreements (2026-2031, KSA).
- standardized interfaces, digital asset tracking and refurbishment hubs are necessary to maintain code compliance over repeated relocations (2026-2031, KSA).
CHAPTER 9 - Competitive Landscape
Competitive Landscape Overview
Competition is moderately fragmented, with one listed specialist, diversified steel-system manufacturers and emerging automated entrants. Entry barriers center on factory scale, code compliance, logistics capability and backlog continuity.
Market Share Distribution
Top 5 Players
Market Dynamics
8 new entrants in the past 5 years, indicating strong market attractiveness and growth potential.
Company Name | Market Share | Headquarters | Founding Year | Core Market Focus |
|---|---|---|---|---|
Red Sea International Company | - | Riyadh, Saudi Arabia | 1967 | Specialized prefabricated modular buildings and workforce accommodation |
Zamil Steel | - | Dammam, Saudi Arabia | 1977 | Pre-engineered steel buildings and modular structural systems |
Saudi Building Systems Manufacturing Company | - | Riyadh, Saudi Arabia | 1976 | Steel building systems, panels and modular industrial facilities |
Al Kifah Precast Company | - | Dammam, Saudi Arabia | 2010 | Precast structural systems and industrialized building solutions |
Modular Arabia | - | Riyadh, Saudi Arabia | 2025 | Automated volumetric modular manufacturing and residential systems |
Gulf Modular Industries | - | NEOM, Saudi Arabia | 2021 | Large-scale modular assembly for giga-project accommodation |
Kirby Building Systems Saudi Arabia | - | Al Jubail, Saudi Arabia | - | Pre-engineered building packages and industrial modules |
Speed House Group Saudi Operations | - | - | - | Permanent and relocatable modular buildings |
United Modular Industries Company | - | - | - | Modular units, camps and site facilities |
Gulf Modular Factory | - | - | - | Factory-built rooms, offices and accommodation modules |
Cross Comparison Parameters
The report provides detailed cross-comparison of key players across 10 performance parameters to identify competitive strengths and weaknesses.
Annual Modular Production Capacity
Average Project Delivery Cycle
Saudi Modular Revenue Growth
EBITDA Margin on Modular Projects
Analysis Covered
Market Share Analysis:
Maps revenue concentration across scaled and specialist modular construction providers.
Cross Comparison Matrix:
Benchmarks capacity, delivery, growth and margin performance across competitors.
SWOT Analysis:
Assesses capabilities, exposure, execution gaps and expansion pathways by player.
Pricing Strategy Analysis:
Compares specification premiums, logistics charges and contracting model economics.
Company Profiles:
Reviews ownership, capabilities, project focus and geographic operating footprint.
CHAPTER 10 - REPORT TOC
Table of Contents
Market Assessment Phase
Supply-side and competitive intelligence covering market sizing, segmentation, competitive dynamics, regulatory landscape, and future forecasts.
Go-To-Market Strategy Phase
15 chapters
Entry strategy evaluation, execution roadmap, partner recommendations, and profitability outlook.
Survey Phase
8 chapters
Demand-side primary research conducted through structured interviews and online surveys with end users across priority metros and Tier 2/3 cities to capture consumption behavior, unmet needs, and purchase drivers.
Complete Report Coverage
201+ detailed sections covering every aspect of the market
143
Assessment Sections
58
Strategy Sections
CHAPTER 11 - Our Approach
Research Methodology
Desk Research
- Saudi construction pipeline and permits
- Modular factory capacity and projects
- Building code and Mostadam requirements
- Housing, tourism and industrial programs
Primary Research
- Modular factory general manager interviews
- Developer project director consultations
- EPC procurement head discussions
- Building code consultant interviews
Validation and Triangulation
- 320 respondents across value chain
- Company revenue and capacity reconciliation
- Floor-area and ASP cross-checks
- Peer-market penetration sanity testing
CHAPTER 12 - FAQ
FAQs
Still have questions?
Our research team is here to help you find the right solution
CHAPTER 13 - Related Research
Explore Related Reports
Expand your market intelligence with complementary research across regions and adjacent markets.
Regional/Country ReportsRelated market analysis across key regions
Related market analysis across key regions
- Indonesia Modular Construction Market Outlook to 2030
- Vietnam Modular Construction Market Outlook to 2030
- Thailand Modular Construction Market Outlook to 2030
- Malaysia Modular Construction Market Outlook to 2030
- Philippines Modular Construction Market Outlook to 2030
Adjacent ReportsRelated markets and complementary research
Related markets and complementary research
- Egypt Prefabricated Building Materials Market
- GCC Construction Project Management Software Market Size, Share & Forecast 2025–2030
- Japan Building Information Modeling Market
- Bahrain Temporary Structures Market
- Indonesia Site Preparation Services Market
500+
Market Research Reports
50+
Countries Covered
15+
Industry Verticals