CHAPTER 1 - MARKET SUMMARY
Market Overview
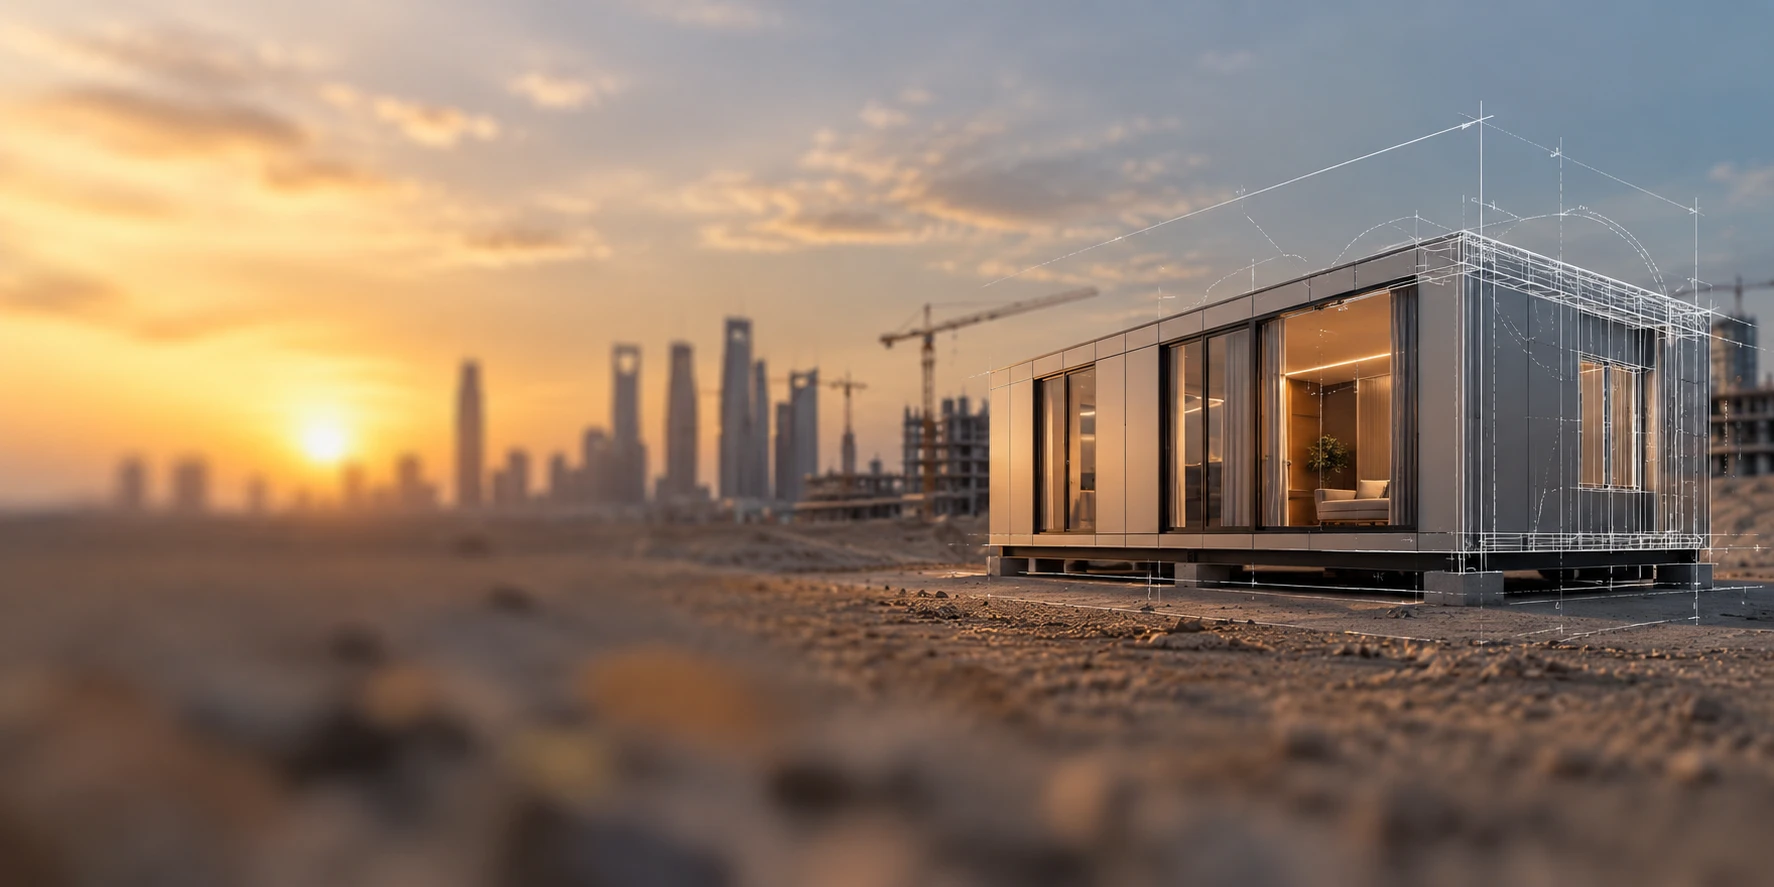
The KSA Prefabricated Housing Market operates through factory production of volumetric modules, panels, structural frames and precast components that are transported for rapid site assembly. Demand is tied to housing delivery targets, developer construction pipelines and workforce accommodation. Saudi family homeownership reached 66.24% in 2025, maintaining pressure on developers to expand supply while controlling delivery schedules and construction costs.
Riyadh Region represents the dominant commercial hub, followed by Makkah Region and the Eastern Province, because these areas combine major residential communities, industrial activity and large developer procurement programs. Saudi Arabia's population reached 35.3 million in mid-2024, increasing 4.7% year on year and reinforcing housing requirements in the largest metropolitan and employment clusters.
Market Value
USD 1,358 million
2025
Dominant Region
Riyadh Region
2025
Dominant Segment
Volumetric Modular Homes
fastest growing, 2026-2031
Total Number of Players
28
Future Outlook
The KSA Prefabricated Housing Market is projected to expand from USD 1,358 million in 2025 to USD 2,204 million by 2031. The market recorded a historical CAGR of 7.29% during 2020-2025 and is forecast to grow at 8.41% during 2026-2031. Expansion will be supported by housing ownership programs, residential master developments, industrial workforce accommodation and increasing acceptance of permanent modular construction. Factory production will also help developers reduce exposure to on-site labor constraints and improve delivery certainty across standardized villas, townhouses, apartment components and community facilities.
Forecast growth will increasingly depend on localization of structural components, automated fabrication, BIM-enabled design standardization and manufacturer-developer framework agreements. Equivalent prefabricated housing volume is projected to rise from approximately 12,350 units in 2025 to 18,500 units in 2031, while the modeled average realized value per equivalent unit increases from USD 109,960 to USD 119,135. Permanent modular and panelized systems should capture a larger share of the profit pool as customers prioritize code compliance, thermal performance, customization and warranty-backed delivery instead of selecting suppliers solely on initial unit price.
8.41%
Forecast CAGR
$2,204 Mn
2030 Projection
Base Year
2025
Historical Period
2020-2025
Forecast Period
2026-2031
Historical CAGR
7.29%
CHAPTER 2 - SCOPE OF REPORT
Scope of the Market
CHAPTER 3 - Key Stakeholders
Key Target Audience
Key stakeholders who can leverage from this market analysis for investment, strategy, and operational planning.
Investors
CAGR, factory utilization, backlog quality, margin resilience, returns
Corporates
delivery speed, unit cost, quality, customization, warranties
Government
housing supply, localization, compliance, affordability, delivery capacity
Operators
throughput, lead times, logistics, installation, lifecycle services
Financial institutions
project finance, receivables, utilization, covenants, residual values
CHAPTER 4 - Market Size & Growth
Market Size, Growth Forecast and Trends
This section evaluates the historical market size, analyzes year-over-year growth dynamics, and presents forecast projections supported by market performance indicators and demand-side drivers.
Historical & Projected Market Size ($ Million)
Year-over-Year Growth Rate (%)
Market Value vs Volume Growth (%)
Historical Market Performance (2020-2025)
Historical market performance accelerated from 6.28% growth in 2021 to a peak of 8.16% in 2024 as residential developers restarted projects, workforce accommodation requirements expanded and permanent modular systems gained wider acceptance. Equivalent unit demand increased from approximately 9,250 units in 2020 to 12,350 units in 2025. The key inflection occurred during 2023-2024, when volume growth rose above 5.5% and framework procurement enabled manufacturers to spread engineering and factory setup costs across larger project phases.
Forecast Market Outlook (2026-2031)
The market is forecast to grow at 8.41% during 2026-2031, reaching USD 2,204 million by 2031. Equivalent completed-unit volume is projected to approach 18,500 units, representing a 6.97% volume CAGR, while modeled average realized value rises to approximately USD 119,135 per unit. Growth is expected to be strongest in permanent volumetric homes, standardized villa packages and developer-led affordable communities. Value growth should remain above volume growth as thermal systems, integrated MEP modules, digital design and warranty-backed turnkey installation increase project content per unit.
CHAPTER 5 - Market Data
Market Breakdown
The market breakdown demonstrates how higher unit throughput, controlled ASP expansion and deeper factory completion are supporting an 8.41% forecast growth trajectory. These indicators help CEOs and investors distinguish scalable manufacturing platforms from project-based suppliers with limited capacity utilization.
Year | Market Size (USD Mn) | YoY Growth (%) | Equivalent Prefab Housing Units | Average Realized ASP (USD/unit) | Factory Completion Share (%) | Period |
|---|---|---|---|---|---|---|
| 2020 | $955 Mn | +- | 9,250 | 103,243 | Forecast | |
| 2021 | $1,015 Mn | +6.28% | 9,630 | 105,400 | Forecast | |
| 2022 | $1,082 Mn | +6.60% | 10,050 | 107,662 | Forecast | |
| 2023 | $1,164 Mn | +7.58% | 10,620 | 109,605 | Forecast | |
| 2024 | $1,259 Mn | +8.16% | 11,460 | 109,860 | Forecast | |
| 2025 | $1,358 Mn | +7.86% | 12,350 | 109,960 | Forecast | |
| 2026F | $1,471 Mn | +8.32% | 13,200 | 111,439 | Forecast | |
| 2027F | $1,595 Mn | +8.43% | 14,100 | 113,121 | Forecast | |
| 2028F | $1,732 Mn | +8.59% | 15,100 | 114,702 | Forecast | |
| 2029F | $1,879 Mn | +8.49% | 16,150 | 116,347 | Forecast | |
| 2030F | $2,037 Mn | +8.41% | 17,300 | 117,746 | Forecast | |
| 2031F | $2,204 Mn | +8.20% | 18,500 | 119,135 | Forecast |
Equivalent Prefab Housing Units
12,350 units, 2025, KSA. Volume expansion improves factory utilization and procurement leverage. Saudi Arabia's population reached 35.3 million in mid-2024, increasing the addressable housing requirement across urban regions.
Average Realized ASP
USD 109,960 per unit, 2025, KSA. ASP resilience reflects greater system integration and customization. Residential construction costs increased 1.0% year on year in November 2025, requiring disciplined material sourcing and contract escalation clauses.
Factory Completion Share
52%, 2025, KSA. Higher off-site completion reduces site congestion and supports predictable handover. Established Saudi systems can be designed, engineered, manufactured and shipped in fewer than eight weeks.
CHAPTER 6 - Segmentation
Market Segmentation Framework
Comprehensive analysis across key dimensions providing insights into market structure, consumer preferences, and distribution patterns.
No of Segments
7
Dominant Segment
Construction Type
Fastest Growing Segment
Structural Material
Construction Type
Structural Material
Housing Format
Customer Type
Price Tier
Sales Channel
Geography
Key Segmentation Takeaways
Comprehensive analysis across all extracted segmentation dimensions providing insights into market structure, consumer preferences, and distribution patterns.
Construction Type
Construction type is the dominant segmentation dimension because it determines factory investment, site assembly requirements, transport economics, project duration and supplier qualification. Volumetric Modular Homes represent the most commercially significant sub-segment for workforce accommodation and standardized permanent housing, while panelized and precast systems remain important for villas, townhouses and larger residential developments requiring architectural flexibility.
Structural Material
Structural material is the fastest-growing segmentation dimension as developers optimize thermal performance, embodied carbon, transport weight and installation speed. Structural Steel and Composite Materials are expanding in modular and panelized applications, while Engineered Timber is emerging from a smaller base. Growth depends on climate adaptation, fire testing, certification availability and localized component production that reduces import lead times.
CHAPTER 7 - Regional Analysis
Regional Analysis
Saudi Arabia ranks first among selected GCC peer countries by prefabricated housing market size, reflecting its larger population, residential development pipeline and government housing objectives. Its manufacturing base and giga-project ecosystem also support greater supplier scale than smaller neighboring markets.
Focus Country Ranking
1st
Focus Country Market Size
USD 1,358 Mn
Focus Country CAGR (2026-2031)
8.41%
Focus Country Ranking
1st
Focus Country Market Size
USD 1,358 Mn
Focus Country CAGR (2026-2031)
8.41%
Regional Analysis (Current Year)
Market Position
Saudi Arabia ranks first among the selected GCC peers with a 2025 modeled value of USD 1,358 million, supported by its large housing pipeline and domestic manufacturing base.
Growth Advantage
Saudi Arabia's 8.41% forecast CAGR exceeds the UAE's 7.60% and Qatar's 6.90%, positioning the Kingdom as the peer group's principal scale and growth market.
Competitive Strengths
A 66.24% homeownership rate, national building codes and expanding developer communities create demand visibility, while established steel and modular factories support localized engineering and faster residential delivery.
CHAPTER 8 - INDUSTRY ANALYSIS
Growth Drivers, Challenges & Opportunities
Comprehensive analysis of key factors shaping the KSA Prefabricated Housing Market, including growth catalysts, operational challenges, and emerging opportunities across production, distribution, and consumer segments.
Growth Drivers
Housing Ownership and Urban Household Formation
- The population reached 35.3 million people (2024, Saudi Arabia), creating sustained demand for housing supply in Riyadh, Jeddah, Makkah and the Eastern Province. Prefabricated suppliers capture value when developers standardize high-volume villa and townhouse designs.
- Homeownership increased from 47% in 2016 to above 65.4% in 2024 (Saudi Arabia), demonstrating the scale of policy-backed housing delivery. Manufacturers benefit from recurring developer frameworks rather than one-off portable building orders.
- NHC's Jana destination includes 1,662 residential units across 920,000 square meters (2026, Jeddah), illustrating the size of master-planned communities that can support standardized off-site construction packages.
Giga-Project and Workforce Accommodation Requirements
- Saudi nationals and resident expatriates indicated USD 1.22 billion of planned residential spending (2025, Saudi Arabia). Modular suppliers can serve permanent communities, temporary workforce villages and hospitality-linked residences through differentiated products.
- A Red Sea development contract valued at SAR 61 million (2022, Saudi Arabia) covered the manufacture, supply and installation of modular buildings, demonstrating the addressable contract size for qualified turnkey suppliers.
- Residential applications represented 37.40% of prefabricated building demand (2025, Saudi Arabia). Suppliers able to convert temporary-project experience into permanent residential systems can access a larger and more recurring revenue pool.
Factory-Based Schedule and Productivity Economics
- Pre-engineered buildings can require less than half the construction time (2026, Saudi Arabia) of comparable concrete buildings. Faster handover improves developer cash conversion and lowers temporary site overhead.
- Zamil's global factories have reported approximately 360,000 tonnes of annual steel-building capacity (2012, company network), demonstrating how factory scale can improve procurement leverage, standardization and project throughput.
- Standalone prefabricated units represented 65% of modular construction demand (2025, Saudi Arabia), indicating that repeatable factory products already have a substantial commercial base from which permanent housing systems can expand.
Market Challenges
Building-Code Certification and Design Approval
- The code applies across 13 administrative regions (2024, Saudi Arabia), requiring manufacturers to manage regional permitting, engineering documentation and inspection coordination. Weak approval capability can delay deployment despite rapid factory production.
- Saudi residential systems must comply with structural and occupancy provisions contained within SBC 201 requirements (2024, Saudi Arabia). Suppliers need tested connections, traceable materials and qualified engineering teams, increasing fixed compliance costs for new entrants.
- Residential modules require project-specific integration of insulation, plumbing, electrical and fire systems under national code compliance (2025, Saudi Arabia). Incomplete documentation can transfer rework, warranty and schedule risk back to manufacturers.
Material, Energy and Logistics Cost Volatility
- Diesel prices contributed to a 27.3% energy-cost increase (June 2025, Saudi Arabia). Transport-intensive volumetric modules are particularly exposed, making factory location and route planning critical to project margins.
- Equipment and machinery rental prices increased 2.5% year on year (June 2025, Saudi Arabia). Higher crane, lifting and site-equipment costs can erode the schedule savings created by off-site fabrication.
- Labor costs increased 2.4% year on year (June 2025, Saudi Arabia). Factory automation can mitigate labor inflation, but capital investment and technician availability become barriers for smaller manufacturers.
Project Concentration and Procurement Cyclicality
- Large modular contracts can exceed USD 16 million per award (2022, Saudi Arabia), creating attractive revenue concentration but increasing exposure to milestone certification, retention payments and project rescheduling.
- Building permits recorded significant monthly and annual variation during 2025-2026 (Saudi Arabia), demonstrating the cyclicality of project starts. Manufacturers need diversified customer portfolios to protect factory utilization.
- The broader prefabricated market's residential share was 37.40% in 2025 (Saudi Arabia), leaving suppliers exposed to competition for capacity from commercial and industrial contracts when those segments offer better margins or payment terms.
Market Opportunities
Industrialized Affordable Housing Partnerships
- Manufacturers can monetize repeatable villa, townhouse and apartment designs through multi-phase developer frameworks, converting 66.24% homeownership in 2025 (Saudi Arabia) into long-duration order books and improved factory utilization.
- Government housing authorities, residential developers and mortgage-supported buyers benefit from standardized units that reduce schedule uncertainty while maintaining code compliance across 13 administrative regions (Saudi Arabia).
- Opportunity realization requires approved standard designs, supplier prequalification and localized factory capacity. NHC projects such as Jana, with 1,662 units (Jeddah), illustrate the potential scale of community-based procurement.
Climate-Adapted Steel, Timber and Composite Systems
- Producers can capture higher margins through insulated panels, light-gauge steel and engineered timber assemblies that improve thermal performance while reducing transport weight. Concrete currently represents 45.60% of material demand (2025, Saudi Arabia).
- Developers benefit from lower structural weight, repeatable quality and faster dry construction, particularly where volumetric modular systems are forecast to grow at 7.8% CAGR (Saudi Arabia).
- Adoption requires local fire testing, moisture protection, thermal certification and supplier education under the 2024 Saudi Building Code. Partnerships with material manufacturers can shorten qualification cycles and improve bankability.
Rental Fleets and Lifecycle Housing Services
- Manufacturers can develop recurring rental, refurbishment and relocation revenue instead of relying exclusively on unit sales. Workforce and project accommodation creates utilization-linked cash flows across multi-year construction programs with USD 733 million of indicated giga-project residential spending (2025).
- Industrial operators and project developers benefit from faster capacity deployment and redeployment. Red Sea International's multi-level steel modular system can support buildings of up to 10 storeys (company capability).
- Scaling the opportunity requires standardized asset specifications, digital fleet tracking, residual-value models and refurbishment hubs. Systems manufactured and shipped in fewer than eight weeks (Saudi capability) strengthen the commercial case for managed housing fleets.
CHAPTER 9 - Competitive Landscape
Competitive Landscape Overview
The market combines established Saudi modular and steel-building manufacturers with precast specialists and international design-build suppliers. Competition centers on approved factory capacity, delivery lead time, localized engineering, turnkey installation and access to developer or government procurement frameworks.
Market Share Distribution
Top 5 Players
Market Dynamics
8 new entrants in the past 5 years, indicating strong market attractiveness and growth potential.
Company Name | Market Share | Headquarters | Founding Year | Core Market Focus |
|---|---|---|---|---|
Red Sea International Company | - | Riyadh, Saudi Arabia | 1967 | Turnkey modular housing, workforce accommodation and permanent steel-frame buildings |
Zamil Steel Pre-Engineered Buildings | - | Dammam, Saudi Arabia | 1977 | Pre-engineered steel buildings, structural systems and insulated building envelopes |
Saudi Building Systems Manufacturing Company | - | Jeddah, Saudi Arabia | - | Prefabricated buildings, modular accommodation and steel building systems |
Nesma & Partners | - | Al Khobar, Saudi Arabia | 1981 | Off-site construction, EPC delivery and large residential project integration |
Al Jazirah Prefab House | - | Riyadh, Saudi Arabia | - | Portable houses, prefabricated villas, site offices and accommodation units |
Kirby Building Systems | - | Kuwait City, Kuwait | 1976 | Pre-engineered steel systems and project-specific building packages |
AMANA Contracting and Steel Buildings | - | Dubai, United Arab Emirates | 1993 | Modular residential construction, design-build delivery and steel buildings |
United Precast Concrete Saudi Arabia | - | Riyadh, Saudi Arabia | - | Precast structural components, wall systems and residential building elements |
AlKifah Precast | - | Al Ahsa, Saudi Arabia | 1977 | Precast concrete systems for residential communities and infrastructure projects |
Dorce Prefabricated Building and Construction | - | Ankara, Turkey | 1982 | Modular housing, workforce camps and international turnkey prefabricated projects |
Cross Comparison Parameters
The report provides detailed cross-comparison of key players across 10 performance parameters to identify competitive strengths and weaknesses.
Annual Factory Capacity
Average Delivery Lead Time
KSA Prefabricated Housing Revenue Growth
EBITDA Margin
Analysis Covered
Market Share Analysis:
Quantifies player positions using KSA housing revenue and capacity proxies.
Cross Comparison Matrix:
Benchmarks capacity, lead times, revenue growth and profitability across players.
SWOT Analysis:
Assesses strategic advantages, operating gaps, market risks and expansion options.
Pricing Strategy Analysis:
Compares unit pricing, customization premiums, logistics costs and contract structures.
Company Profiles:
Summarizes ownership, capabilities, Saudi footprint, target customers and delivery models.
CHAPTER 10 - REPORT TOC
Table of Contents
Market Assessment Phase
Supply-side and competitive intelligence covering market sizing, segmentation, competitive dynamics, regulatory landscape, and future forecasts.
Go-To-Market Strategy Phase
15 chapters
Entry strategy evaluation, execution roadmap, partner recommendations, and profitability outlook.
Survey Phase
8 chapters
Demand-side primary research conducted through structured interviews and online surveys with end users across priority metros and Tier 2/3 cities to capture consumption behavior, unmet needs, and purchase drivers.
Complete Report Coverage
201+ detailed sections covering every aspect of the market
143
Assessment Sections
58
Strategy Sections
CHAPTER 11 - Our Approach
Research Methodology
Desk Research
- Reviewed Saudi residential construction statistics
- Mapped modular manufacturing capacity disclosures
- Analyzed housing policy delivery indicators
- Assessed building-code compliance requirements
Primary Research
- Interviewed modular factory general managers
- Consulted residential development directors
- Engaged precast production operations managers
- Surveyed developer procurement category managers
Validation and Triangulation
- Validated assumptions across 320 respondents
- Reconciled factory and project volumes
- Cross-checked unit pricing benchmarks
- Tested historical and forecast closure
CHAPTER 12 - FAQ
FAQs
Still have questions?
Our research team is here to help you find the right solution
CHAPTER 13 - Related Research
Explore Related Reports
Expand your market intelligence with complementary research across regions and adjacent markets.
Regional/Country ReportsRelated market analysis across key regions
Related market analysis across key regions
- Indonesia Prefabricated Housing Market Size, Share & Forecast, By Construction Type, Housing Format & Customer Type, 2026-2031
- Vietnam Prefabricated Housing Market Size, Share & Forecast, By Construction Type, Housing Format & Customer Type, 2026-2031
- Thailand Prefabricated Housing Market Size, Share & Forecast, By Construction Type, Housing Format & Customer Type, 2026-2031
- Malaysia Prefabricated Housing Market Size, Share & Forecast, By Construction Type, Housing Format & Customer Type, 2026-2031
- Philippines Prefabricated Housing Market Size, Share & Forecast, By Construction Type, Housing Format & Customer Type, 2026-2031
Adjacent ReportsRelated markets and complementary research
Related markets and complementary research
- Egypt Building Information Modeling Market
- Vietnam Structural Safety Solutions Market
- Oman Thermal Performance Technology Market
- Egypt Automated Fabrication Systems Market
- Philippines Prefabricated Steel Systems Market
500+
Market Research Reports
50+
Countries Covered
15+
Industry Verticals