CHAPTER 1 - MARKET SUMMARY
Market Overview
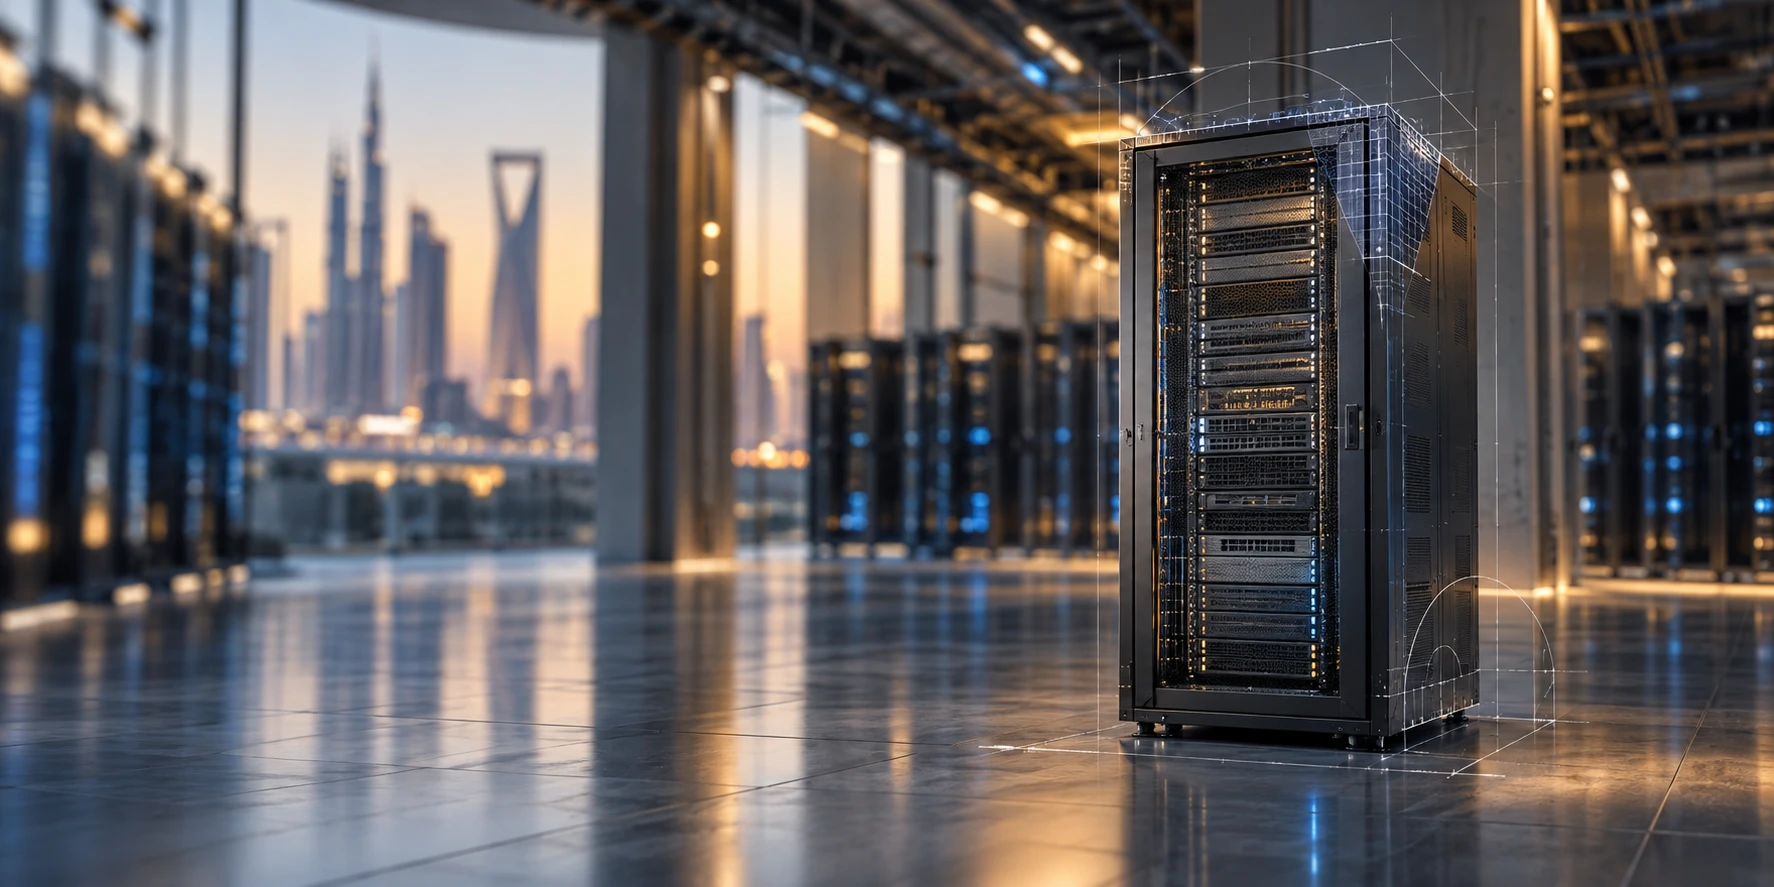
The Middle East Data Center Equipment Market operates through coordinated procurement of compute, storage, networking, electrical and thermal systems by hyperscalers, colocation operators, telecom companies and regulated enterprises. Approximately 1,600 MW of equipped IT load was operational or commercially committed in 2025, establishing a sizeable recurring demand pool for server refreshes, capacity additions and infrastructure lifecycle services.
Supply is concentrated around the United Arab Emirates and Saudi Arabia, which accounted for approximately 37.66% and 27.60% of regional data center power capacity respectively in 2025. Their combined 65.26% concentration gives Dubai, Abu Dhabi, Riyadh, Jeddah and Dammam disproportionate influence over vendor qualification, equipment stocking, system-integration capacity and regional maintenance economics.
Market Value
USD 5,600 million
2025
Dominant Region
Gulf Cooperation Council, led by the United Arab Emirates and Saudi Arabia
2025
Dominant Segment
IT Compute and Servers
2025
Total Number of Players
120
2025
Future Outlook
The Middle East Data Center Equipment Market is projected to expand from USD 5,600 million in 2025 to USD 11,660 million by 2031. This represents a forecast CAGR of 13.0%, compared with 10.6% during 2020-2025. Expansion will be led by hyperscale cloud regions, sovereign artificial intelligence campuses, regulated-industry migration and higher equipment intensity per megawatt. Revenue growth should exceed physical capacity growth during the early forecast period as GPU clusters, high-speed interconnects, lithium-ion backup systems and advanced thermal architectures increase equipment expenditure per commissioned rack.
Equipped IT load is projected to rise from approximately 1,600 MW in 2025 to 3,390 MW by 2031. Liquid-cooled capacity and racks operating above 20 kW are expected to capture a larger portion of new deployments as accelerated computing moves beyond traditional air-cooling limits. The strongest profit pools should therefore migrate toward modular power systems, direct-to-chip cooling, high-speed switching, all-flash storage and lifecycle services. Vendor competitiveness will increasingly depend on regional inventory, engineering response times, sovereign-cloud certifications and the ability to deliver integrated systems rather than isolated hardware components.
13.0%
Forecast CAGR
$11,660 Mn
2030 Projection
Base Year
2025
Historical Period
2020-2025
Forecast Period
2026-2031
Historical CAGR
10.6%
CHAPTER 2 - SCOPE OF REPORT
Scope of the Market
CHAPTER 3 - Key Stakeholders
Key Target Audience
Key stakeholders who can leverage from this market analysis for investment, strategy, and operational planning.
Investors
CAGR, capex pipeline, margins, concentration, execution risk
Corporates
equipment procurement, resilience, scalability, efficiency, lifecycle cost
Government
localization, data sovereignty, grid capacity, water efficiency
Operators
rack density, power usage, cooling, uptime, commissioning
Financial institutions
project finance, covenants, utilization, tenant quality, returns
CHAPTER 4 - Market Size & Growth
Market Size, Growth Forecast and Trends
This section evaluates the historical market size, analyzes year-over-year growth dynamics, and presents forecast projections supported by market performance indicators and demand-side drivers.
Historical & Projected Market Size ($ Million)
Year-over-Year Growth Rate (%)
Market Value vs Volume Growth (%)
Historical Market Performance
Historical growth accelerated from 8.3% in 2021 to 14.5% in 2025. The principal inflection occurred after 2023 as public-cloud regions, sovereign data initiatives and artificial intelligence infrastructure entered procurement cycles. Equipped IT load expanded from approximately 860 MW in 2020 to 1,600 MW in 2025, outpacing value growth for much of the period. Procurement remained concentrated in large campuses, but demand broadened from conventional enterprise servers toward GPU systems, high-speed switches, lithium-ion UPS platforms and more thermally efficient rack architectures.
Forecast Market Outlook
Forecast revenue is expected to grow at 13.0% annually during 2026-2031, with annual additions rising from USD 728 million in 2026 to USD 1,342 million in 2031. Equipped IT load is projected to exceed 3,000 MW during 2030 and reach approximately 3,390 MW in 2031. Value growth should remain resilient as declining unit prices for standard compute are offset by higher spending per artificial intelligence rack, increased redundancy, liquid cooling, optical interconnects and integrated lifecycle services. The forecast therefore reflects both capacity expansion and a structurally richer equipment mix.
CHAPTER 5 - Market Data
Market Breakdown
The market combines double-digit revenue growth with rising equipment intensity per commissioned megawatt. For CEOs and investors, the decisive variables are capacity deployment, high-density rack penetration and the conversion from air-based to liquid-assisted thermal architectures.
Year | Market Size (USD Mn) | YoY Growth (%) | Equipped IT Load (MW) | High-Density Rack Share (%) | Liquid-Cooling Adoption (%) | Period |
|---|---|---|---|---|---|---|
| 2020 | $3,380 Mn | +- | 860 | 6% | Forecast | |
| 2021 | $3,660 Mn | +8.3% | 945 | 8% | Forecast | |
| 2022 | $4,000 Mn | +9.3% | 1,050 | 11% | Forecast | |
| 2023 | $4,410 Mn | +10.3% | 1,190 | 15% | Forecast | |
| 2024 | $4,890 Mn | +10.9% | 1,365 | 21% | Forecast | |
| 2025 | $5,600 Mn | +14.5% | 1,600 | 28% | Forecast | |
| 2026 | $6,328 Mn | +13.0% | 1,810 | 36% | Forecast | |
| 2027 | $7,151 Mn | +13.0% | 2,055 | 44% | Forecast | |
| 2028 | $8,081 Mn | +13.0% | 2,335 | 52% | Forecast | |
| 2029 | $9,131 Mn | +13.0% | 2,650 | 60% | Forecast | |
| 2030 | $10,318 Mn | +13.0% | 3,000 | 67% | Forecast | |
| 2031 | $11,660 Mn | +13.0% | 3,390 | 73% | Forecast |
Equipped IT Load
1,600 MW, 2025, Middle East. Capacity concentration supports regional inventory hubs and specialized field engineering. Saudi Arabia exceeded 440 MW of capacity while the UAE reached approximately 508 MW.
High-Density Rack Share
28%, 2025, Middle East. Higher rack density transfers spending toward busways, advanced PDUs, optical networking and thermal management. A fully configured NVIDIA GB200 NVL72 rack can require approximately 120 kW.
Liquid-Cooling Adoption
19%, 2025, Middle East. Adoption improves addressable revenue for coolant distribution units, cold plates and heat-rejection systems. Schneider Electric has published a modular artificial intelligence design supporting 1 MW across 12 racks.
CHAPTER 6 - Segmentation
Market Segmentation Framework
Comprehensive analysis across key dimensions providing insights into market structure, buyer requirements and infrastructure deployment patterns.
No of Segments
7
Dominant Segment
Equipment Type
Fastest Growing Segment
Cooling Technology
Equipment Type
End-Use Industry
Data Center Type
Tier Standard
Country
Power Density
Cooling Technology
CHAPTER 7 - Regional Analysis
Regional Analysis
The United Arab Emirates is the largest selected country market for data center equipment, supported by the region's deepest operating capacity and a dense concentration of colocation and cloud facilities. Saudi Arabia follows closely, while Israel, Turkey and Qatar provide faster-growth opportunities linked to cloud localization, artificial intelligence infrastructure and new campus investment.
Focus Country Ranking
1st - United Arab Emirates
Focus Country Market Size
USD 2,110 Mn (2025)
Focus Country CAGR
17.3% (2026-2031)
Focus Country Ranking
1st - United Arab Emirates
Focus Country Market Size
USD 2,110 Mn (2025)
Focus Country CAGR
17.3% (2026-2031)
Regional Analysis (Current Year)
Market Position
The UAE ranks first among selected markets with USD 2,110 million of equipment spending and approximately 508 MW of installed IT load in 2025.
Growth Advantage
The UAE's 17.3% forecast CAGR exceeds Saudi Arabia's 12.8%, although Israel at 22.4% and Qatar at 23.0% provide faster smaller-base expansion.
Competitive Strengths
The UAE combines 37 operating facilities, 508 MW of IT load and a planned 100 MW solar-powered campus, strengthening procurement scale and sustainability positioning.
CHAPTER 8 - INDUSTRY ANALYSIS
Growth Drivers, Challenges & Opportunities
Comprehensive analysis of key factors shaping the Middle East Data Center Equipment Market, including growth catalysts, operational challenges, and emerging opportunities across production, distribution, and enterprise infrastructure segments.
Growth Drivers
Hyperscale Cloud and Artificial Intelligence Capital Deployment
- AWS and HUMAIN announced an AI Zone exceeding USD 5 billion (2025, Saudi Arabia), creating procurement demand for GPU servers, high-speed fabrics, storage, UPS systems and liquid cooling.
- Microsoft and G42 outlined an additional 200 MW before end-2026 (2025, UAE), benefiting integrated equipment vendors capable of delivering high-density systems at campus scale.
- Accelerated-server electricity demand is projected to rise by approximately 30% annually during 2024-2030 (2025, global), increasing equipment intensity per megawatt and widening premium hardware profit pools.
Sovereign Cloud and Data-Residency Requirements
- Saudi Arabia's personal-data framework establishes national processing and transfer obligations (2025, Saudi Arabia), encouraging regulated workloads to use auditable domestic equipment and certified operating environments.
- Google Cloud operates regional locations in Doha, Dammam and Tel Aviv (2026, Middle East), validating multi-country demand for networking, storage, security and resilient power infrastructure.
- Saudi Arabia's government cloud platform has supported public-sector digital infrastructure since 2018 (2018, Saudi Arabia), expanding standardized procurement for secure compute, backup and disaster-recovery equipment.
Rapid Expansion of Installed Data Center Capacity
- Saudi Arabia reported more than 60 data centers and 20 operating companies (2025, Saudi Arabia), creating recurring demand for maintenance, replacement equipment and standardized spare-parts inventories.
- The UAE had approximately 507.7 MW of installed capacity (2025, UAE), providing a concentrated customer base for high-value servers, switching, power distribution and cooling solutions.
- Moro Hub's solar-powered campus is designed for 100 MW across ten phases (2025, UAE), linking capacity growth with renewable-energy procurement and premium efficiency equipment.
Market Challenges
Grid Connection and Electrical Equipment Bottlenecks
- Data center electricity demand was approximately 485 TWh in 2025 (2025, global), requiring utilities to accelerate substations, transmission capacity and long-lead switchgear procurement.
- Five major technology companies invested more than USD 400 billion in 2025 (2025, global), increasing competition for transformers, turbines, chips and specialized construction capacity.
- Saudi Arabia's new data center strategy targets up to 1.5 GW by 2030 (2025, Saudi Arabia), creating execution risk unless utility connections and power-equipment supply scale concurrently.
Thermal Management and Water Constraints
- Saudi data centers were estimated to consume approximately 15 billion liters of water in 2024 (2024, Saudi Arabia), increasing scrutiny of water-intensive thermal designs in an arid market.
- Cooling represented approximately 20% of net electricity-demand growth from data centers (2024-2030, global), making power-usage effectiveness a direct determinant of operating margins.
- Regional cooling equipment revenue was approximately USD 440 million in 2025 (2025, Middle East), but retrofitting legacy halls requires downtime planning, hydraulic infrastructure and specialized engineering.
Imported Technology and Specialized Skills Dependence
- GPU servers, optical interconnects and high-capacity UPS components are primarily imported, while hyperscale AI installations can exceed 100 MW per campus (2025, global), magnifying delivery-delay costs.
- Saudi Arabia's market includes more than 60 facilities managed by over 20 companies (2025, Saudi Arabia), increasing competition for certified commissioning, electrical and thermal engineers.
- Vertiv employs approximately 34,000 people across more than 130 countries (FY2025, global), illustrating the scale of engineering networks required to support mission-critical infrastructure consistently.
Market Opportunities
Liquid-Cooling Retrofits and High-Density Thermal Systems
- Direct-to-chip systems can support artificial intelligence deployments through modular designs of 1 MW across 12 racks (2025, global), enabling premium equipment and commissioning revenue.
- Data center operators benefit because liquid cooling can accommodate densities above 20 kW per rack (2025, global) while reducing pressure on room-level airflow systems.
- Opportunity realization requires coolant distribution, leak detection, water-quality management and technician certification across more than 60 Saudi facilities (2025, Saudi Arabia).
Modular Power and Prefabricated Infrastructure
- Manufacturers can monetize pre-engineered UPS, switchgear, busway and cooling blocks where deployments must scale from 68 MW to more than 440 MW within four years (2021-2025, Saudi Arabia).
- Operators benefit from repeatable designs because a single artificial intelligence campus may exceed 100 MW (2025, global), making schedule certainty and factory testing financially valuable.
- Scaling requires local assembly, bonded inventories and utility-approved designs as hyperscaler commitments exceed USD 10.3 billion across two Saudi initiatives (2024-2025, Saudi Arabia).
Green Power Integration and Sovereign Artificial Intelligence Campuses
- Moro Hub's planned 100 MW solar-powered campus (2025, UAE) creates demand for energy-management systems, high-efficiency UPS platforms and renewable-aware workload orchestration.
- Investors benefit from infrastructure aligned with the UAE's planned 200 MW expansion before end-2026 (2025, UAE), where efficiency and carbon performance can strengthen tenant economics.
- Opportunity realization requires bankable power-purchase structures, grid interconnection and equipment capable of supporting the first 200 MW Stargate phase in 2026 (2025, UAE).
CHAPTER 9 - Competitive Landscape
Competitive Landscape Overview
Competition is moderately concentrated across global infrastructure vendors, with high entry barriers created by certification requirements, mission-critical service obligations, complex channel structures and long equipment qualification cycles.
Market Share Distribution
Top 5 Players
Market Dynamics
8 new entrants in the past 5 years, indicating strong market attractiveness and growth potential.
Company Name | Market Share | Headquarters | Founding Year | Core Market Focus |
|---|---|---|---|---|
Schneider Electric | - | Rueil-Malmaison, France | 1871 | UPS systems, power distribution, cooling, racks, automation and DCIM |
Vertiv | - | Westerville, Ohio, United States | 2016 | Critical power, thermal management, racks, modular systems and lifecycle services |
Huawei Technologies | - | Shenzhen, China | 1987 | Servers, storage, networking, modular power and cooling infrastructure |
Dell Technologies | - | Round Rock, Texas, United States | 1984 | Enterprise servers, storage, hyperconverged systems and infrastructure management |
Hewlett Packard Enterprise | - | Spring, Texas, United States | 2015 | Servers, high-performance computing, storage, networking and private cloud systems |
Cisco Systems | - | San Jose, California, United States | 1984 | Data center switching, routing, security, observability and interconnect platforms |
Lenovo | - | Beijing, China | 1984 | Servers, high-performance computing, storage and artificial intelligence infrastructure |
NetApp | - | San Jose, California, United States | 1992 | Enterprise storage, hybrid cloud data management and cyber-resilient systems |
Arista Networks | - | Santa Clara, California, United States | 2004 | High-speed switching, cloud networking and artificial intelligence fabrics |
Pure Storage | - | Santa Clara, California, United States | 2009 | All-flash storage, data management and storage-as-a-service platforms |
Cross Comparison Parameters
The report provides detailed cross-comparison of key players across 10 performance parameters to identify competitive strengths and weaknesses.
Installed Base Supported (MW)
AI-Ready Rack Density Supported (kW per Rack)
Regional Data Center Equipment Revenue Growth
EBITDA Margin
Analysis Covered
Market Share Analysis:
Assesses regional revenue position across core data center equipment categories.
Cross Comparison Matrix:
Benchmarks operational scale, technical capability, growth and financial resilience.
SWOT Analysis:
Evaluates portfolio advantages, execution risks, opportunities and competitive exposure.
Pricing Strategy Analysis:
Compares equipment pricing, service bundles, warranties and lifecycle economics.
Company Profiles:
Reviews regional positioning, product coverage, capabilities and strategic priorities.
CHAPTER 10 - REPORT TOC
Table of Contents
Market Assessment Phase
Supply-side and competitive intelligence covering market sizing, segmentation, competitive dynamics, regulatory landscape, and future forecasts.
Go-To-Market Strategy Phase
15 chapters
Entry strategy evaluation, execution roadmap, partner recommendations, and profitability outlook.
Survey Phase
8 chapters
Demand-side primary research conducted through structured interviews and online surveys with end users across priority metros and secondary cities to capture procurement behavior, unmet needs, and purchase drivers.
Complete Report Coverage
201+ detailed sections covering every aspect of the market
143
Assessment Sections
58
Strategy Sections
CHAPTER 11 - Our Approach
Research Methodology
Desk Research
- Regional equipment shipment and import review
- Operator capacity pipeline and rack audit
- Vendor portfolio and pricing benchmark
- Power cooling and network policy review
Primary Research
- Data center technology officer interviews
- Facility engineering director interviews
- Infrastructure procurement manager interviews
- Utility capacity planning executive interviews
Validation and Triangulation
- 312 respondent observations cross-validated
- Country capacity and spend reconciliation
- Equipment price-volume consistency testing
- Forecast scenarios tested against pipelines
CHAPTER 12 - FAQ
FAQs
Still have questions?
Our research team is here to help you find the right solution
CHAPTER 13 - Related Research
Explore Related Reports
Expand your market intelligence with complementary research across regions and adjacent markets.
Regional/Country ReportsRelated market analysis across key regions
Related market analysis across key regions
- Indonesia Data Center Equipment Market
- Vietnam Data Center Equipment Market
- Thailand Data Center Equipment Market
- Malaysia Data Center Equipment Market
- Philippines Data Center Equipment Market
Adjacent ReportsRelated markets and complementary research
Related markets and complementary research
- KSA Cloud Infrastructure Market
- Germany AI Technology Market
- Bahrain Data Center Cooling Solutions Market
- KSA High-Speed Networking Equipment Market
- KSA Modular Power Systems Market
500+
Market Research Reports
50+
Countries Covered
15+
Industry Verticals