CHAPTER 1 - MARKET SUMMARY
Market Overview
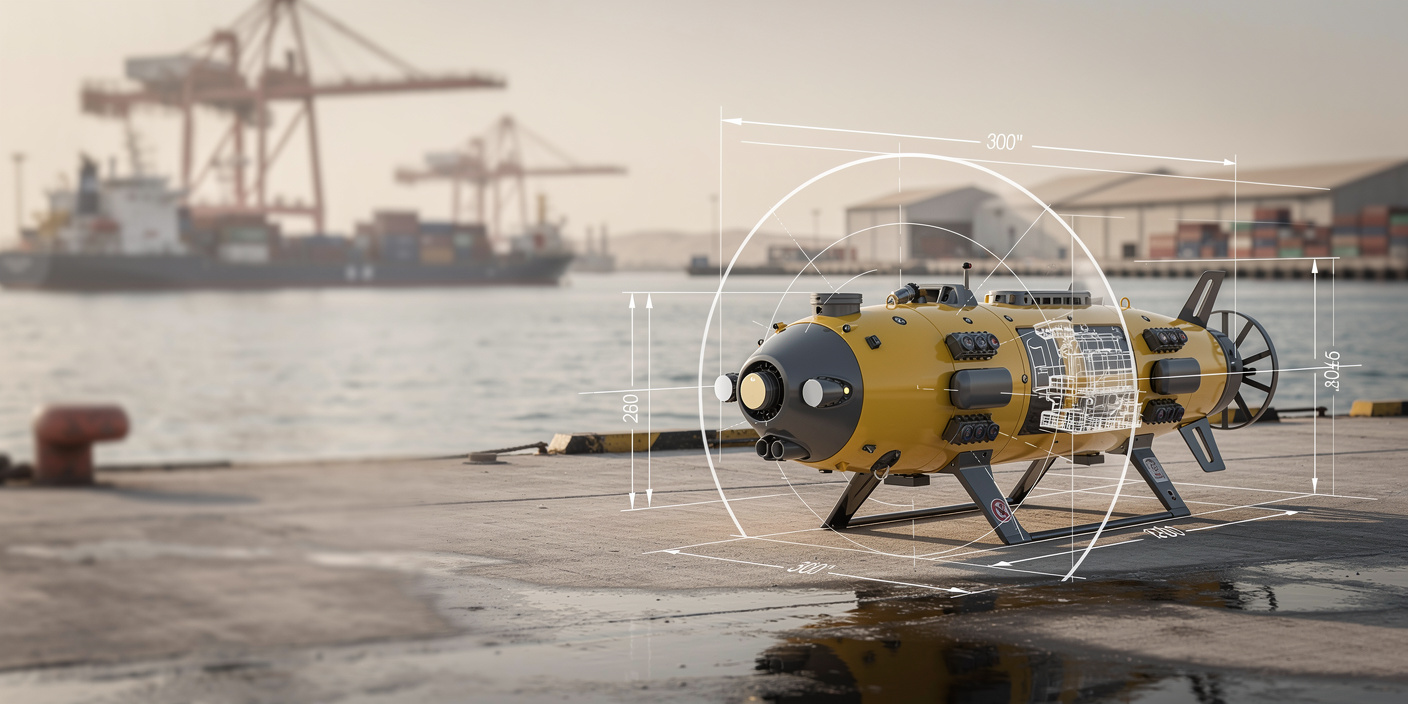
The Saudi Arabia Autonomous Underwater Vehicle Market operates through project-based sales of platforms, sonar payloads, command software, launch systems and lifecycle services. Offshore energy inspection and maritime defense collectively accounted for an estimated 74% of addressable expenditure in 2025. These applications favor high-specification systems because subsea pipeline integrity, mine detection and seabed surveillance require persistent coverage with lower vessel and diver exposure.
Demand is geographically concentrated in the Eastern Province and Arabian Gulf corridor, which represented an estimated 48% of 2025 market value. The concentration reflects offshore oil and gas fields, subsea pipelines, marine terminals and naval operating areas. Saudi Aramco has reported annual inspection requirements covering approximately 650 km of subsea pipelines and 72 offshore platforms, creating a recurring mission base for autonomous inspection technologies.
Market Value
USD 46.2 Mn
2025
Dominant Region
Eastern Province and Arabian Gulf
Dominant Segment
Multi-Sensor AI-Enabled Autonomy
fastest growing
Total Number of Players
18
Future Outlook
The Saudi Arabia Autonomous Underwater Vehicle Market is projected to increase from USD 46.2 Mn in 2025 to USD 101.4 Mn by 2031, representing a forecast CAGR of 14.0%. Growth will be supported by autonomous inspection of offshore pipelines, naval mine-countermeasure programs, Red Sea development, port-security requirements and higher expenditure on persistent maritime-domain awareness. The strongest revenue expansion is expected in medium and heavy AUVs equipped with synthetic-aperture sonar, multibeam bathymetry, optical inspection and edge-processing capabilities. Direct platform sales will remain important, although mission services, payload upgrades, maintenance and local systems integration will capture a rising proportion of contract value.
Volume is projected to increase from 24 normalized AUV-equivalent systems in 2025 to 42 in 2031, equivalent to a 9.8% CAGR. Value growth will outpace system growth because average configured-system value is modeled to rise from USD 1.925 Mn to USD 2.414 Mn as buyers procure longer endurance, greater depth rating, higher-resolution sensors and secure command links. The market's trajectory depends on tender timing, technology-transfer commitments and local maintenance capacity. Suppliers that establish Saudi integration partnerships, demonstrate harsh-environment performance and offer fleet-level data analytics will be better positioned than vendors relying on one-time imported equipment sales.
14.0%
Forecast CAGR
USD 101.4 Mn
2030 Projection
Base Year
2025
Historical Period
2020-2025
Forecast Period
2026-2031
Historical CAGR
9.5%
CHAPTER 2 - SCOPE OF REPORT
Scope of the Market
CHAPTER 3 - Key Stakeholders
Key Target Audience
Key stakeholders who can leverage from this market analysis for investment, strategy, and operational planning.
Investors
CAGR, procurement pipeline, capex intensity, technology risk, returns
Corporates
payload integration, lifecycle cost, localization, partnerships, export potential
Government
maritime security, sovereignty, localization, standards, R&D, resilience
Operators
endurance, depth rating, payload capacity, navigation, maintenance, uptime
Financial institutions
project finance, order visibility, counterparty risk, covenants, export credit
CHAPTER 4 - Market Size & Growth
Market Size, Growth Forecast and Trends
This section evaluates the historical market size, analyzes year-over-year growth dynamics and presents forecast projections supported by platform demand, procurement activity, mission intensity, average configured-system value and localization indicators.
Historical & Projected Market Size ($ Million)
Year-over-Year Growth Rate (%)
Market Value vs Volume Growth (%)
Historical Market Performance, 2020-2025
Market value increased by USD 16.9 Mn between 2020 and 2025. Growth was slowest in 2021 at 6.5%, reflecting project deferrals and restricted offshore field activity, before accelerating to 11.3% in 2025. The number of normalized AUV-equivalent systems rose from 19 to 24, while average configured-system value increased from USD 1.542 Mn to USD 1.925 Mn. This indicates that payload sophistication, endurance, navigation quality and lifecycle support contributed more incremental value than unit growth alone. Defense, maritime security and oil and gas accounted for an estimated 74% of the 2025 market.
Forecast Market Outlook, 2026-2031
Forecast growth strengthens from 13.4% in 2026 to approximately 14.2% by 2031 as autonomous systems transition from pilot deployments toward repeatable mission programs. Normalized system volume is projected to reach 42 units in 2031, while average configured-system value rises to USD 2.414 Mn. The mix shifts toward long-endurance vehicles, synthetic-aperture sonar, secure communications, automated target recognition and resident inspection systems. The base forecast reaches USD 101.4 Mn, while delayed localization and tender cycles produce a bear outcome of USD 79.6 Mn and accelerated naval and offshore procurement supports a bull outcome of USD 124.7 Mn.
CHAPTER 5 - Market Data
Market Breakdown
The Saudi Arabia Autonomous Underwater Vehicle Market combines increasing system volumes with higher sensor and autonomy content. For CEOs and investors, the most important operating indicators are normalized system demand, average configured-system value and the proportion of expenditure that can be localized through integration, software, maintenance and training.
Year | Market Size (USD Mn) | YoY Growth (%) | AUV-Equivalent Systems | Average System Value (USD Mn) | Addressable Local-Content Proxy (%) | Period |
|---|---|---|---|---|---|---|
| 2020 | $29.3 Mn | +- | 19 | 1.542 | Forecast | |
| 2021 | $31.2 Mn | +6.5% | 20 | 1.560 | Forecast | |
| 2022 | $34.0 Mn | +9.0% | 21 | 1.619 | Forecast | |
| 2023 | $37.4 Mn | +10.0% | 22 | 1.700 | Forecast | |
| 2024 | $41.5 Mn | +11.0% | 23 | 1.804 | Forecast | |
| 2025 | $46.2 Mn | +11.3% | 24 | 1.925 | Forecast | |
| 2026F | $52.4 Mn | +13.4% | 27 | 1.941 | Forecast | |
| 2027F | $59.7 Mn | +13.9% | 29 | 2.059 | Forecast | |
| 2028F | $68.1 Mn | +14.1% | 32 | 2.128 | Forecast | |
| 2029F | $77.8 Mn | +14.2% | 35 | 2.223 | Forecast | |
| 2030F | $88.8 Mn | +14.1% | 38 | 2.337 | Forecast | |
| 2031F | $101.4 Mn | +14.2% | 42 | 2.414 | Forecast |
AUV-Equivalent Systems
24 normalized systems in 2025. Volume includes complete platforms plus major payload or refit packages normalized to configured-system equivalents. Saudi Aramco has identified autonomous inspection as an alternative to vessel-intensive subsea work, supporting recurring platform utilization rather than isolated demonstration purchases.
Average System Value
USD 1.925 Mn in 2025. Rising value reflects synthetic-aperture sonar, multibeam systems, inertial navigation, high-density batteries and secure mission software. Teledyne's modular Gavia family supports depth ratings of 500 or 1,000 meters, illustrating how configuration choices materially affect platform economics.
Addressable Local-Content Proxy
24.89% in 2025. The indicator is aligned with Saudi Arabia's broader military-spending localization level and is not an audited AUV-specific ratio. It signals increasing commercial importance for domestic integration, sustainment, training and software as the national localization target exceeds 50% by 2030.
CHAPTER 6 - Segmentation
Market Segmentation Framework
Comprehensive analysis across key dimensions providing insights into market structure, customer requirements, procurement models and technology adoption patterns.
No of Segments
7
Dominant Segment
End-Use Industry
Fastest Growing Segment
Technology
Product Type
End-Use Industry
Application
Customer Type
Sales Channel
Technology
Geography
Key Segmentation Takeaways
Comprehensive analysis across all extracted segmentation dimensions provides insights into platform demand, mission economics, institutional procurement, technology requirements and regional deployment priorities.
End-Use Industry
Defense and maritime security represents the most influential demand pool, supported by requirements for mine countermeasures, naval intelligence, surveillance and underwater infrastructure protection. Oil and gas operators form the largest commercial customer base through pipeline inspection, seabed surveys and offshore asset-integrity programs. These two industries account for most high-value platform, sensor-integration and lifecycle-support contracts.
Technology
Multi-sensor AI-enabled autonomy is the fastest-growing technology category as customers seek longer missions, onboard object classification, adaptive navigation and reduced operator intervention. Synthetic-aperture sonar and multibeam systems remain core payload technologies, while autonomous data processing increasingly differentiates suppliers. Companies combining navigation software, sensor fusion and mission analytics are positioned to capture higher-margin integration and recurring support revenue.
CHAPTER 7 - Regional Analysis
Regional Analysis
Saudi Arabia ranks second among selected Gulf peers in the modeled 2025 autonomous underwater vehicle market, behind the UAE but ahead of Qatar, Oman, Kuwait and Bahrain. Saudi Arabia has the peer group's highest projected CAGR because it combines extensive offshore-energy assets, two strategic coastlines, military localization and a growing pipeline of Red Sea marine developments.
Peer-Country Ranking
2nd
Saudi Arabia Market Size, 2025
USD 46.2 Mn
Saudi Arabia CAGR, 2025-2031
14.0%
Peer-Country Ranking
2nd
Saudi Arabia Market Size, 2025
USD 46.2 Mn
Saudi Arabia CAGR, 2025-2031
14.0%
Regional Analysis (Current Year)
Market Position
Saudi Arabia's modeled USD 46.2 Mn market ranks second among the six Gulf peers, supported by extensive offshore-energy infrastructure and recurring naval requirements.
Growth Advantage
Saudi Arabia's 14.0% forecast CAGR exceeds the UAE's 12.5% and Qatar's 11.8%, positioning it as the peer group's fastest-expanding national AUV opportunity.
Competitive Strengths
Two strategic coastlines, a defense-localization target above 50% and recurring inspection of 650 km of subsea pipelines create differentiated demand and local-service potential.
CHAPTER 8 - INDUSTRY ANALYSIS
Growth Drivers, Challenges and Opportunities
Comprehensive analysis of key factors shaping the Saudi Arabia Autonomous Underwater Vehicle Market, including growth catalysts, operational challenges and emerging opportunities across manufacturing, systems integration, mission services and end-user segments.
Growth Drivers
Offshore Energy Inspection Requirements
- Pipeline integrity, leak detection and seabed-change monitoring create repeat inspection cycles across 650 km of subsea pipeline assets (2025, Saudi Arabia), favoring reusable AUV fleets over one-time survey mobilization.
- Saudi Aramco estimated that a USD 2.5 Mn AUV could substitute for a task requiring a USD 50 Mn survey vessel (2017, Saudi Arabia), creating a compelling capital-avoidance case for autonomous operations.
- Energy operators capture value through lower vessel days, reduced diver exposure and more frequent inspection, while OEMs monetize platforms, sensors, analytics and multi-year support across annual inspection programs (Saudi Arabia).
Defense Localization and Maritime Security
- The national objective to localize more than 50% of military spending by 2030 encourages AUV suppliers to establish Saudi integration, maintenance, training and software capabilities.
- The number of licensed and authorized military-industry establishments reached 296 by Q3 2024, expanding the potential partner base for sensors, command systems and lifecycle support.
- Autonomous mine countermeasures and surveillance reduce personnel exposure while increasing mission persistence, allowing naval buyers and local defense primes to capture value from fleet-level capability programs through 2030.
Red Sea Development and Marine Infrastructure
- Large coastal-development zones require baseline bathymetry, habitat mapping and construction monitoring across two major marine basins (Saudi Arabia), expanding demand beyond oil and defense.
- Ports, subsea cables, desalination intakes and tourism infrastructure create recurring inspection requirements throughout a 2,640 km national coastline, supporting medium AUV and service-contractor utilization.
- Marine developers, environmental consultants and hydrographic contractors gain from autonomous data collection because one vehicle can capture bathymetric, optical and water-column data during multi-sensor missions.
Market Challenges
High Platform and Payload Acquisition Cost
- Pressure hulls, inertial navigation, synthetic-aperture sonar and high-density batteries increase configured-system value to an estimated USD 1.925 Mn average in 2025, before specialized support infrastructure.
- Small research and port users face capital constraints because launch equipment, training, spares and mission software can add 10%-25% to platform acquisition cost, creating demand for leasing and shared fleets.
- Vendors must demonstrate vessel-day savings and higher inspection frequency to justify the capital requirement, particularly where traditional survey assets are already available under multi-year service contracts.
Navigation and Communications Constraints
- Acoustic communications have lower bandwidth and higher latency than terrestrial networks, making onboard processing necessary for real-time target classification and route adaptation.
- Navigation errors accumulate without direct satellite positioning, increasing the value of inertial systems, Doppler velocity logs and terrain-aided navigation across long-range subsea missions.
- Operators require robust abort, recovery and data-integrity procedures because communication loss can place a multi-million-dollar vehicle and sensitive mission data at risk.
Limited Local Subsea Autonomy Supply Chain
- The gap between 24.89% localization in 2024 and the above-50% target for 2030 creates execution pressure for technology transfer, workforce development and qualified maintenance capacity.
- Low initial fleet volumes make local manufacture of specialized pressure hulls and sonar arrays difficult because fixed qualification cost must be recovered across tens rather than thousands of systems.
- Local partners can capture integration and sustainment revenue sooner than component manufacturing, but they require test facilities, secure software environments and trained personnel for 500-1,000 meter class systems.
Market Opportunities
Autonomous Inspection-as-a-Service
- Contractors can offer per-kilometer, per-asset or annual-availability pricing across 650 km of subsea pipeline inspection demand, converting capital equipment into recurring mission revenue.
- Energy operators reduce vessel and diver exposure, while OEMs, local integrators and analytics providers capture a share of multi-year inspection expenditure.
- Buyers need standardized data acceptance, certified mission procedures and proven recovery reliability before autonomous systems can replace a material share of conventional inspection campaigns.
Localized Mission Integration and Sustainment
- Saudi partners can capture depot maintenance, battery management, calibration, mission-planning software and training revenue representing an estimated 15%-25% of lifecycle value.
- Defense primes, marine engineering firms, technical institutes and specialist software companies can participate without immediately manufacturing every high-complexity component.
- OEMs need controlled technology-transfer frameworks, local test ranges and secure data infrastructure capable of supporting classified and critical-infrastructure missions.
Resident AUV Networks for Critical Infrastructure
- Docking stations, remote mission control, battery service and analytics enable recurring platform-availability contracts instead of one-time sales across ports, pipelines and subsea cables.
- Energy operators, port authorities, utilities and security agencies gain faster anomaly detection, while integrators capture software and maintenance revenue over five-to-ten-year asset cycles.
- Reliable docking, subsea power, secure communications and automated data triage must be validated before resident fleets can operate with minimal vessel intervention.
CHAPTER 9 - Competitive Landscape
Competitive Landscape Overview
The Saudi market is moderately concentrated among global AUV OEMs, while local participation is fragmented across defense primes, marine contractors and technology integrators. Entry barriers include pressure-system engineering, sonar intellectual property, navigation performance, security accreditation, launch infrastructure and proven mission reliability.
Market Share Distribution
Top 5 Players
Market Dynamics
8 new entrants in the past 5 years, indicating strong market attractiveness and growth potential.
Company Name | Modeled 2025 Market Share | Headquarters | Founding Year | Core Market Focus |
|---|---|---|---|---|
Kongsberg Maritime | 15% | Norway | 1814 | HUGIN survey, defense and long-endurance AUVs |
HII | 12% | United States | 2011 | REMUS defense, mine-countermeasure and survey vehicles |
Teledyne Marine | 10% | United States | 1960 | Gavia AUVs, sonar, navigation and oceanographic sensors |
Saab | 9% | Sweden | 1937 | Sabertooth hybrid, resident and subsea intervention systems |
Exail | 8% | France | 2022 | Mine-countermeasure AUVs, navigation and maritime robotics |
General Dynamics Mission Systems | 7% | United States | 1952 | Bluefin defense and deepwater autonomous systems |
L3Harris Technologies | 6% | United States | 2019 | Iver portable AUVs and integrated mission systems |
ATLAS ELEKTRONIK | 5% | Germany | - | Naval sonar and mine-countermeasure autonomy |
RTsys | 3% | France | - | Light AUVs for research, hydrography and defense |
Cellula Robotics | 3% | Canada | - | Long-range, fuel-cell and specialized autonomous vehicles |
Cross Comparison Parameters
The report provides detailed cross-comparison of key players across 10 performance parameters to identify competitive strengths and weaknesses.
CHAPTER 10 - REPORT TOC
CHAPTER 14 - Table Of Contents
Phase 1Market Assessment Phase
11
Chapters
Supply-side and competitive intelligence covering market sizing, segmentation, competitive dynamics, regulatory landscape, and future forecasts.
Phase 2Go-To-Market Strategy Phase
15
Chapters
Entry strategy evaluation, execution roadmap, partner recommendations, and profitability outlook.
Complete Report Coverage
201+ detailed sections covering every aspect of the market
143
Assessment Sections
58
Strategy Sections
CHAPTER 11 - Our Approach
Research Methodology
Desk Research
- Reviewed Saudi maritime policy documents
- Mapped offshore inspection mission requirements
- Benchmarked global AUV product portfolios
- Assessed localization and procurement indicators
Primary Research
- Interviewed subsea operations engineering managers
- Interviewed naval systems procurement specialists
- Interviewed hydrographic survey project directors
- Interviewed marine robotics integration leads
Validation and Triangulation
- Validated findings across 286 respondents
- Reconciled supplier and buyer estimates
- Cross-checked platform configuration economics
- Tested forecast assumptions under scenarios
CHAPTER 12 - FAQ
FAQs
Still have questions?
Our research team is here to help you find the right solution
CHAPTER 13 - Related Research
Explore Related Reports
Expand your market intelligence with complementary research across regions and adjacent markets.
Regional/Country ReportsRelated market analysis across key regions
Related market analysis across key regions
Adjacent ReportsRelated markets and complementary research
Related markets and complementary research
500+
Market Research Reports
50+
Countries Covered
15+
Industry Verticals