CHAPTER 1 - MARKET SUMMARY
Market Overview
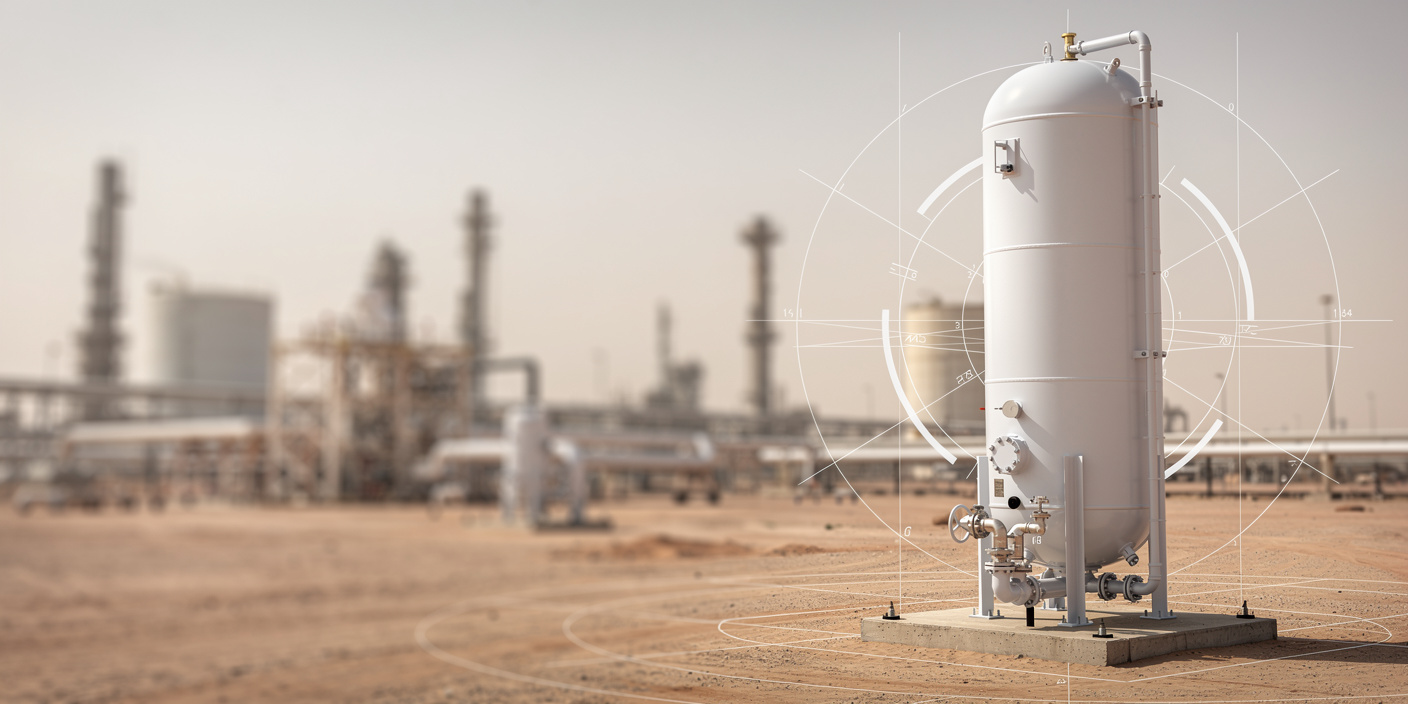
The Saudi Arabia Carbon Dioxide Market operates through recovered by-product gas, purification and liquefaction, bulk tanker distribution, cylinders, and dry-ice conversion. Demand is anchored by a population of 35.3 million in 2024 and household food and beverage expenditure representing 21.1% of domestic consumption. This scale supports recurring carbonation, modified-atmosphere packaging, cold-chain, and hospitality requirements.
Supply is concentrated around the Eastern Province industrial corridor, particularly Jubail, Dammam, and nearby refining and petrochemical assets. Saudi crude production averaged about 9.0 million barrels per day in 2024, creating dense sources of process gas and large industrial offtakers. Proximity reduces haulage distance, boil-off losses, and delivered cost for bulk liquid carbon dioxide.
Market Value
USD 1.15 billion
2025
Dominant Region
Eastern Province
2025
Dominant Segment
Oil & Gas
largest revenue pool, 2025
Total Number of Players
42
Future Outlook
The Saudi Arabia Carbon Dioxide Market is projected to increase from USD 1.15 billion in 2025 to USD 1.61 billion by 2031, representing a 5.80% forecast CAGR. The historical 2020-2025 CAGR was 6.11%, reflecting the post-pandemic rebound, higher food processing throughput, and continued hydrocarbon-sector utilization. Forecast growth remains durable because volume demand expands across carbonation, dry ice, welding, water treatment, and process applications, while average selling prices rise modestly with purification, energy, transport, and compliance costs. The base case assumes no structural supply interruption and gradual commissioning of new recovery and liquefaction capacity.
Volume is expected to rise from 6.39 million tonnes in 2025 to 8.21 million tonnes in 2031, a 4.27% CAGR, while average realized value increases from USD 180.0 to USD 196.5 per tonne. Food and beverage demand becomes a larger profit pool as stricter purity requirements and service reliability support better margins than commodity industrial supply. Oil and gas remains the largest application, but carbon capture infrastructure changes contracting models through long-duration pipeline access, tolling, and storage-linked agreements. Investors should prioritize source security, purification flexibility, and distribution density rather than undifferentiated cylinder capacity.
5.80%
Forecast CAGR
$1,613.3 Mn
2030 Projection
Base Year
2025
Historical Period
2020-2025
Forecast Period
2026-2031
Historical CAGR
6.11%
CHAPTER 2 - SCOPE OF REPORT
Scope of the Market
CHAPTER 3 - Key Stakeholders
Key Target Audience
Key stakeholders who can leverage from this market analysis for investment, strategy, and operational planning.
Investors
CAGR, contracted volumes, utilization, capex, margin, source risk
Corporates
purity, delivered cost, reliability, tank utilization, supplier concentration
Government
CCUS capacity, local content, compliance, resilience, emissions reduction
Operators
recovery yield, liquefaction uptime, routing, inventory, quality assurance
Financial institutions
project finance, offtake coverage, covenants, cash-flow stability
CHAPTER 4 - Market Size & Growth
Market Size, Growth Forecast and Trends
This section evaluates the historical market size, analyzes year-over-year growth dynamics, and presents forecast projections supported by market performance indicators and demand-side drivers.
Historical & Projected Market Size ($ Million)
Year-over-Year Growth Rate (%)
Market Value vs Volume Growth (%)
Historical Market Performance (2020-2025)
The trough occurred in 2020 as mobility restrictions and hospitality disruption reduced beverage, event, and dry-ice demand. Growth accelerated to 7.6% in 2024, the strongest historical year, as higher-purity product mix, manufacturing activity, and distribution utilization improved. Market volume expanded from 5.28 million tonnes in 2020 to 6.39 million tonnes in 2025, while average realized value rose from USD 161.9 to USD 180.0 per tonne. Demand remained concentrated in the Eastern Province, where refining, petrochemicals, and gas processing provide both feedstock and large-scale consumption.
Forecast Market Outlook (2026-2031)
Forecast revenue increases at a 5.80% CAGR to USD 1.61 billion in 2031, with annual growth remaining between 5.7% and 5.9%. Volume reaches 8.21 million tonnes as food-grade applications, dry-ice logistics, water treatment, and industrial fabrication broaden the addressable market. The forecast inflection begins in 2027-2028 as carbon capture infrastructure improves source availability and supports pipeline-linked contracting. Average selling value rises to USD 196.5 per tonne by 2031, reflecting tighter purity specifications, energy and transport costs, and a larger share of value-added liquid and dry-ice products.
CHAPTER 5 - Market Data
Market Breakdown
The market combines commodity bulk supply with higher-margin food-grade, medical, dry-ice, and specialty applications. Growth remains investable because volume expansion is supported by Saudi industrial output while compliance, purification, and logistics create defendable service differentiation.
Year | Market Size (USD Mn) | YoY Growth (%) | Market Volume (Mn Tonnes) | Average Selling Value (USD/Tonne) | Food & Beverage Share (%) | Period |
|---|---|---|---|---|---|---|
| 2020 | $854.8 Mn | +- | 5.28 | 161.9 | Forecast | |
| 2021 | $897.1 Mn | +4.9 | 5.45 | 164.6 | Forecast | |
| 2022 | $950.2 Mn | +5.9 | 5.69 | 167.0 | Forecast | |
| 2023 | $1,010.2 Mn | +6.3 | 5.96 | 169.5 | Forecast | |
| 2024 | $1,087.1 Mn | +7.6 | 6.18 | 175.9 | Forecast | |
| 2025 | $1,150.2 Mn | +5.8 | 6.39 | 180.0 | Forecast | |
| 2026 | $1,216.8 Mn | +5.8 | 6.66 | 182.7 | Forecast | |
| 2027 | $1,288.1 Mn | +5.9 | 6.94 | 185.6 | Forecast | |
| 2028 | $1,363.3 Mn | +5.8 | 7.24 | 188.3 | Forecast | |
| 2029 | $1,442.0 Mn | +5.8 | 7.55 | 191.0 | Forecast | |
| 2030 | $1,526.0 Mn | +5.8 | 7.87 | 193.9 | Forecast | |
| 2031 | $1,613.3 Mn | +5.7 | 8.21 | 196.5 | Forecast |
Market Volume
6.39 million tonnes, 2025, Saudi Arabia. Volume scale determines liquefaction utilization, storage requirements, and tanker fleet economics. The planned Jubail CCS hub will capture up to 9 million tonnes annually from 2028, materially expanding the country's carbon-handling infrastructure.
Average Selling Value
USD 180.0 per tonne, 2025, Saudi Arabia. Realized pricing reflects purity, delivery mode, contract duration, and distance from source. Saudi non-oil activities grew 4.9% in 2025, supporting customer mix expansion beyond hydrocarbons.
Food & Beverage Share
25.8%, 2025, Saudi Arabia. This segment offers recurring demand and premium specifications for carbonation, packaging, and chilling. Food and beverages represented 21.1% of household consumption expenditure in 2024.
CHAPTER 6 - Segmentation
Market Segmentation Framework
Comprehensive analysis across key dimensions providing insights into market structure, consumer preferences, and distribution patterns.
No of Segments
7
Dominant Segment
End-Use Industry
Fastest Growing Segment
Technology
Product Type
End-Use Industry
Application
Customer Type
Sales Channel
Technology
Geography
Key Segmentation Takeaways
Comprehensive analysis across all extracted segmentation dimensions providing insights into market structure, consumer preferences, and distribution patterns.
End-Use Industry
Oil and gas remains the anchor revenue pool because carbon dioxide is consumed in reservoir operations, gas processing, refining, inerting, and process control. Food and beverage is the most attractive adjacent profit pool because beverage bottlers and food processors require verified purity, reliable delivery, and traceable quality systems that support contract retention and pricing premiums.
Technology
Carbon Capture and Utilization is the fastest-growing technology pathway as Saudi Arabia builds shared capture, transport, and storage infrastructure in Jubail. Natural gas processing remains the dominant source technology, but post-combustion capture and direct-air-capture pilots expand the future feedstock base. Commercial growth depends on purification economics, offtake agreements, and the separation of merchant-grade molecules from storage volumes.
CHAPTER 7 - Regional Analysis
Regional Analysis
Saudi Arabia ranks first among selected Middle East peers by carbon dioxide market size, reflecting its unusually dense combination of refining, petrochemicals, gas processing, food manufacturing, and emerging carbon-capture infrastructure. The country's scale advantage is reinforced by the region's largest crude production base and one of its deepest refining systems.
Focus Country Ranking
1st
Focus Country Market Size (2025)
USD 1.15 Bn
Saudi Arabia CAGR (2026-2031)
5.8%
Focus Country Ranking
1st
Focus Country Market Size (2025)
USD 1.15 Bn
Saudi Arabia CAGR (2026-2031)
5.8%
Regional Analysis (Current Year)
Regional Analysis Comparison
Market Position
Saudi Arabia leads the peer set with USD 1.15 billion in 2025 market revenue and about 9.0 million barrels per day of crude production, supporting both feedstock availability and large industrial offtake.
Growth Advantage
Saudi Arabia's 5.8% forecast CAGR is ahead of Kuwait's 5.1% and Qatar's 5.4%, although below the UAE's 6.2%, positioning the Kingdom as the region's largest scaled growth market.
Competitive Strengths
A 9 million-tonne annual Jubail capture hub, 3.3 million barrels per day of refining capacity, and dense Eastern Province logistics give Saudi suppliers advantages in source security, utilization, and delivered cost.
CHAPTER 8 - INDUSTRY ANALYSIS
Growth Drivers, Challenges & Opportunities
Comprehensive analysis of key factors shaping the Saudi Arabia Carbon Dioxide Market, including growth catalysts, operational challenges, and emerging opportunities across production, distribution, and consumer segments.
Growth Drivers
Food Processing, Beverage and Hospitality Expansion
- Food and beverages accounted for 21.1% of household consumption expenditure (2024, Saudi Arabia), supporting high-frequency demand from bottlers, restaurants, processors, and cold-chain operators. Suppliers with verified food-grade systems capture longer contracts and better margins.
- Dairy self-sufficiency reached 131% (2024, Saudi Arabia), indicating a large domestic processing base that uses carbon dioxide for packaging, chilling, and process control. Gas suppliers benefit through plant-level bulk contracts and emergency backup services.
- Saudi airports handled 140.9 million passengers (2025, Saudi Arabia), expanding hospitality and catering throughput. Beverage carbonation and dry-ice logistics gain from higher tourism, events, and airline food-service volumes.
Hydrocarbon Processing and Industrial Demand
- Aramco plans to increase gas production by 60% by 2030 (Saudi Arabia), increasing gas-processing streams that can support carbon dioxide recovery while creating demand for inerting, maintenance, and process gases.
- Jafurah contains an estimated 229 trillion standard cubic feet of raw gas (2025, Saudi Arabia), strengthening the feedstock base for industrial gases and downstream chemicals. Recovery operators can monetize high-purity by-product streams through long-term offtake.
- Non-oil activities expanded 4.9% (2025, Saudi Arabia), broadening demand from metals, chemicals, water treatment, construction services, and manufacturing. Diversified suppliers reduce exposure to any single refinery or beverage customer.
Carbon Capture Infrastructure and Circular Carbon Policy
- Aramco's share of the hub is planned at 6 million tonnes per year (2028, Saudi Arabia), with 3 million tonnes from neighboring emitters. Shared infrastructure lowers entry barriers for industrial capture projects and enables hub-based service revenues.
- Saudi Arabia's first direct-air-capture unit removes 12 tonnes per year (2025, Saudi Arabia), providing an early test bed for sorbents, energy integration, and purification. Technology partners gain reference projects before larger commercial deployment.
- The national net-zero target is 2060 (Saudi Arabia), supporting long-duration investment in capture, utilization, storage, and low-carbon products. Operators that can verify carbon provenance and lifecycle intensity gain strategic relevance.
Market Challenges
Source Concentration and Distribution Reliability
- Liquid carbon dioxide requires insulated storage and scheduled tanker replenishment; route length raises delivered cost and service risk. Suppliers need depot redundancy, telemetry, and emergency inventory to protect high-value food and healthcare accounts.
- The market serves 35.3 million residents (2024, Saudi Arabia) across widely separated urban clusters, making western and southern coverage more expensive than the Eastern Province. Regional depots and swap-body logistics become decisive competitive assets.
- Supply interruptions can halt beverage filling, food packaging, welding, and dry-ice shipments within hours. Vendor-managed tanks and dual-source procurement reduce downtime but increase working capital and qualification costs for buyers.
Energy, Purification and Capital Cost Pressure
- Purification plants must remove sulfur compounds, hydrocarbons, moisture, and odorants to meet food and medical requirements. Higher-grade systems improve margins but require analyzers, validated processes, and more frequent quality testing.
- Saudi manufacturing waste reached 18.3 million tonnes (2024, Saudi Arabia), increasing pressure for cleaner industrial processes and by-product recovery. Producers face capital allocation trade-offs between compliance equipment and merchant capacity.
- CCUS projects require pipelines, compressors, wells, monitoring, and long-term liability frameworks. A 9 million-tonne annual hub (2028, Saudi Arabia) offers scale, but merchant utilization economics remain separate from storage economics.
Regulatory Qualification and End-Market Substitution
- Food-grade suppliers must maintain analytical controls across production, transport, and tank hygiene. Failure creates product recall and customer shutdown risk, so buyers favor incumbents with audited quality systems.
- Hospitals operate under medical-device and medicinal-product controls, and Saudi hospital-bed density was 23.7 per 10,000 people (2023, Saudi Arabia). Medical-grade growth is attractive but demands validated filling and batch traceability.
- Alternative refrigerants, nitrogen-rich packaging mixes, and process redesign can reduce carbon dioxide intensity in selected applications. Suppliers must defend value through technical service, reliability, and application optimization rather than molecule-only pricing.
Market Opportunities
Food-Grade Carbon Dioxide and Dry-Ice Networks
- dedicated food-grade liquefaction, microbulk tanks, telemetry, and dry-ice conversion support contract pricing above basic industrial gas. Integrated service bundles improve retention and route economics.
- beverage bottlers, dairy processors, protein exporters, pharmaceutical distributors, and logistics firms gain shelf-life, cooling, and continuity advantages. Domestic dairy self-sufficiency of 131% (2024, Saudi Arabia) enlarges the addressable processing base.
- suppliers need more depots outside the Eastern Province, certified tank-cleaning, digital inventory monitoring, and customer backup plans. These investments convert fragmented spot sales into multi-year service contracts.
CCUS Hub Services and Carbon Utilization Contracts
- operators can earn compression, transport, metering, purification, and storage fees through take-or-pay structures. Utilization projects add margins in chemicals, mineralization, and low-carbon fuels.
- emitters reduce standalone infrastructure requirements, investors access contracted utility-like cash flows, and industrial gas companies contribute separation and compression expertise. The hub allocates 3 million tonnes per year to neighboring emitters (2028, Saudi Arabia).
- standardized carbon accounting, custody transfer, storage liability, third-party access, and utilization specifications are needed. Clear commercial rules determine whether captured gas becomes merchant product, storage volume, or both.
On-Site Recovery and Digital Distribution Optimization
- build-own-operate recovery units at ammonia, hydrogen, fermentation, and gas-processing sites can secure low-cost feedstock under long-term offtake contracts. Recurring service and maintenance improve returns.
- source plants monetize waste streams, gas suppliers secure capacity, and customers receive more stable delivered pricing. Carbon recovery also reduces venting and supports corporate emissions targets.
- remote tank telemetry, dynamic routing, predictive maintenance, and electronic certificates of analysis must become standard. Digital operations can reduce emergency deliveries, inventory losses, and fleet kilometers.
CHAPTER 9 - Competitive Landscape
Competitive Landscape Overview
The market is moderately concentrated, with global gas majors, large Saudi industrial-gas producers, and specialized regional suppliers competing on source access, purity certification, depot coverage, customer reliability, and application engineering.
Market Share Distribution
Top 5 Players
Market Dynamics
8 new entrants in the past 5 years, indicating strong market attractiveness and growth potential.
Company Name | Market Share | Headquarters | Founding Year | Core Market Focus |
|---|---|---|---|---|
Linde Gas Saudi Arabia | - | Riyadh, Saudi Arabia | - | Bulk liquid, cylinders, food-grade carbon dioxide, specialty gases |
Air Products Qudra | - | Dhahran, Saudi Arabia | 2017 | Large industrial gas projects, on-site supply, hydrogen and nitrogen integration |
Gulf Cryo Saudi | - | Dammam, Saudi Arabia | 1953 | Merchant liquid gases, dry ice, specialty and food-grade gases |
National Industrial Gases Company | - | Jubail, Saudi Arabia | - | Large-scale industrial gases for petrochemicals and manufacturing |
Abdullah Hashim Industrial Gases & Equipment | - | Jeddah, Saudi Arabia | 1954 | Industrial, medical, food-grade gases and carbon recovery systems |
Air Liquide Arabia | - | Al Khobar, Saudi Arabia | - | Over-the-fence industrial gases for refining and petrochemicals |
Saudi Aramco | - | Dhahran, Saudi Arabia | 1933 | Carbon capture, gas processing, source development and industrial utilization |
Al Arabia Gas Company | - | Saudi Arabia | - | Industrial and medical gases, cylinders and distributed supply |
Barrak Industrial Gases | - | Eastern Province, Saudi Arabia | - | Carbon dioxide, dry ice, food-grade mixtures and cylinder gases |
OxyTech | - | Saudi Arabia | - | High-purity industrial gases and customer-site gas solutions |
Cross Comparison Parameters
The report provides detailed cross-comparison of key players across 10 performance parameters to identify competitive strengths and weaknesses.
Carbon Dioxide Production Capacity
Bulk Distribution Coverage
Saudi Carbon Dioxide Revenue Growth
EBITDA Margin
Analysis Covered
Market Share Analysis:
Compares supplier scale, source access, channels, and customer concentration.
Cross Comparison Matrix:
Benchmarks capacity, logistics reach, growth, and operating profitability.
SWOT Analysis:
Assesses source security, compliance strengths, gaps, and expansion risks.
Pricing Strategy Analysis:
Evaluates contract structures, purity premiums, freight, and service charges.
Company Profiles:
Reviews ownership, operating footprint, products, customers, and strategic priorities.
CHAPTER 10 - REPORT TOC
Market Report Structure
Comprehensive coverage across three strategic phases — Market Assessment, Go-To-Market Strategy, and Survey — delivering end-to-end insights from market analysis and execution roadmap to customer demand validation.
Market Assessment Phase
Supply-side and competitive intelligence covering market sizing, segmentation, competitive dynamics, regulatory landscape, and future forecasts.
Go-To-Market Strategy Phase
15 chapters
Entry strategy evaluation, execution roadmap, partner recommendations, and profitability outlook.
Survey Phase
8 chapters
Demand-side primary research conducted through structured interviews and online surveys with end users across priority metros and Tier 2/3 cities to capture consumption behavior, unmet needs, and purchase drivers.
Complete Report Coverage
201+ detailed sections covering every aspect of the market
143
Assessment Sections
58
Strategy Sections
CHAPTER 11 - Our Approach
Research Methodology
Desk Research
- Mapped Saudi carbon dioxide producers
- Reviewed gas-processing and refinery capacity
- Analyzed food-grade compliance requirements
- Tracked CCUS projects and policies
Primary Research
- Industrial gas commercial directors interviewed
- Carbon dioxide plant managers interviewed
- Beverage procurement heads interviewed
- CCUS project specialists interviewed
Validation and Triangulation
- Validated findings across 290 respondents
- Reconciled supplier and buyer estimates
- Cross-checked volume and pricing
- Tested regional logistics economics
CHAPTER 12 - FAQ
FAQs
Still have questions?
Our research team is here to help you find the right solution
CHAPTER 13 - Related Research
Explore Related Reports
Expand your market intelligence with complementary research across regions and adjacent markets.
Regional/Country ReportsRelated market analysis across key regions
Related market analysis across key regions
- Oman Carbon Dioxide Market Size, Share & Forecast, By Product Type, Application & End-Use Industry, 2025–2032
- Malaysia Carbon Dioxide Market Report Size, Share, Growth Drivers, Trends, Opportunities & Forecast 2025–2030
- Japan Carbon Dioxide Market Report Size, Share, Growth Drivers, Trends, Opportunities & Forecast 2025–2030
- Australia Carbon Dioxide Market Report Size, Share, Growth Drivers, Trends, Opportunities & Forecast 2025–2030
- Bahrain Carbon Dioxide Market Report Size, Share, Growth Drivers, Trends, Opportunities & Forecast 2025–2030
Adjacent ReportsRelated markets and complementary research
Related markets and complementary research
- UAE Industrial Gas Market
- Mexico Oil & Gas Industry Market
- Brazil Food and Beverage Packaging Market
- Kuwait Carbon Capture and Storage Market
- Bahrain Industrial Process Gas Market
500+
Market Research Reports
50+
Countries Covered
15+
Industry Verticals