CHAPTER 1 - MARKET SUMMARY
Market Overview
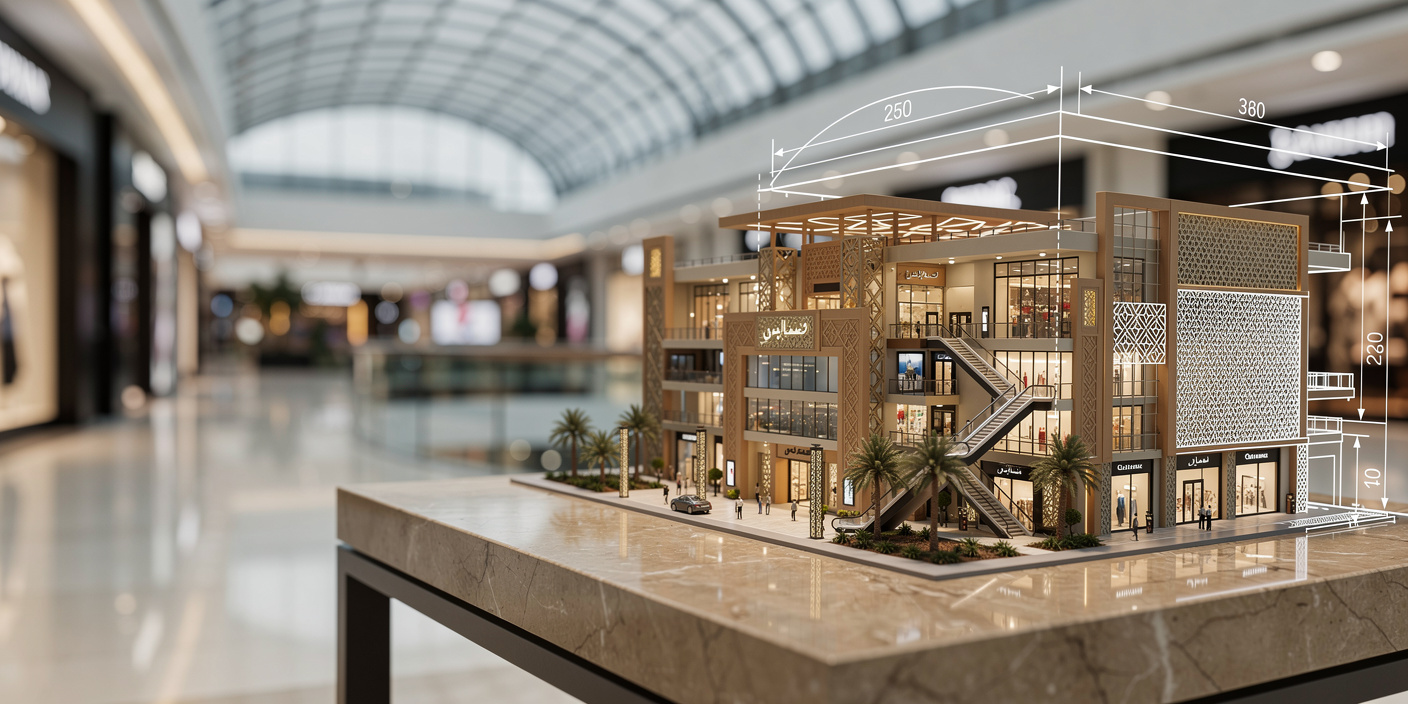
The Saudi Arabia Mall-Based Retail Market operates through tenant sales generated inside enclosed shopping malls, lifestyle centres, mixed-use destinations, and community malls. Household final consumption reached approximately USD 556.7 billion in 2024, providing a substantial demand pool for fashion, foodservice, beauty, electronics, and entertainment. Mall operators capture value through occupancy, footfall, tenant mix, and turnover-linked leasing, while retailers compete on assortment and conversion.
Riyadh is the dominant national hub because of its population concentration, corporate employment base, government spending, and accelerating premium retail pipeline. Announced Riyadh projects were expected to add approximately 1.83 million square metres of gross floor area before 2030. The concentration of super-regional developments supports flagship stores and luxury brands, although additional supply increases tenant negotiating leverage and raises the performance threshold for older malls.
Market Value
USD 44.8 billion
2025
Dominant Region
Riyadh Region
2025
Dominant Segment
Fashion and Accessories
largest revenue segment, 2025
Total Number of Players
4,800
2025 estimate
Future Outlook
The Saudi Arabia Mall-Based Retail Market is projected to advance from USD 44.8 billion in 2025 to USD 69.0 billion by 2031, representing a forecast CAGR of 7.46%. This follows a historical CAGR of 7.78% during 2020-2025. The forecast assumes continued population and consumption growth, additional high-quality mall capacity, stronger domestic tourism, rising entertainment expenditure, and greater localization of premium purchases. Growth will be moderated by supply competition, online retail substitution, a 15% VAT burden, and tenant resistance to high fixed rents. Superior centres should outperform through category curation, customer data, events, and mixed-use integration.
Annual mall visitation is forecast to rise from approximately 680 million visits in 2025 to 945 million visits in 2031, while average spend per visit increases from USD 65.9 to USD 73.0. This combination supports value growth without requiring aggressive price inflation. Mall gross leasable area is expected to reach approximately 12.9 million square metres by 2031, compared with 8.9 million square metres in 2025. Profit pools are expected to shift toward experiential foodservice, leisure, beauty, premium fashion, loyalty monetization, and digitally enabled store formats, while undifferentiated mid-market space faces greater vacancy and rent pressure.
7.46%
Forecast CAGR
$69,000 Mn
2030 Projection
Base Year
2025
Historical Period
2020-2025
Forecast Period
2026-2031
Historical CAGR
7.78%
CHAPTER 2 - SCOPE OF REPORT
Scope of the Market
CHAPTER 3 - Key Stakeholders
Key Target Audience
Key stakeholders who can leverage from this market analysis for investment, strategy, and operational planning.
Investors
CAGR, asset yield, capex intensity, occupancy, downside risk
Corporates
tenant productivity, category mix, procurement, conversion, expansion economics
Government
tourism spending, localization, compliance, employment, city competitiveness
Operators
footfall, occupancy, dwell time, rent collection, loyalty
Financial institutions
project finance, covenants, lease coverage, stabilization, refinancing
CHAPTER 4 - Market Size & Growth
Market Size, Growth Forecast and Trends
This section evaluates the historical market size, analyzes year-over-year growth dynamics, and presents forecast projections supported by market performance indicators and demand-side drivers.
Historical & Projected Market Size ($ Million)
Year-over-Year Growth Rate (%)
Market Value vs Volume Growth (%)
Historical Market Performance (2020-2025)
The strongest historical expansion occurred in 2023, when estimated mall-based sales increased by 8.68% and annual visits reached 620 million. Performance reflected normalized mobility, tourism recovery, improved entertainment availability, and store reopening programs. Average occupancy increased from 80% in 2020 to 86% in 2025, although sales productivity moderated as new space entered the market. Fashion, foodservice, and electronics remained the largest spending pools. Riyadh captured the largest incremental demand, while secondary assets depended more heavily on discounting, grocery anchors, and localized family entertainment to maintain repeat visits.
Forecast Market Outlook (2026-2031)
Forecast growth is expected to remain above 7% annually, with the strongest modeled increase of 7.72% occurring in 2030 as new destination assets mature ahead of major international events. Mall visits are projected to approach 945 million by 2031, while average spend per visit rises to USD 73.0. Growth will increasingly reflect premium tenant mix, food and beverage penetration, entertainment, loyalty ecosystems, and tourism-linked purchases. New supply should improve brand localization but may compress occupancy and rents at undifferentiated centres. Owners must therefore prioritize catchment analytics, tenant productivity, and mixed-use integration.
CHAPTER 5 - Market Data
Market Breakdown
The market is expected to expand through a combination of additional mall capacity, rising visitation, and gradual improvement in spend per visit. For CEOs and investors, returns will depend on the productivity of each square metre rather than portfolio expansion alone.
Year | Market Size (USD Mn) | YoY Growth (%) | Mall GLA (Mn Sqm) | Average Occupancy Rate (%) | Annual Mall Visits (Mn) | Period |
|---|---|---|---|---|---|---|
| 2020 | $30,800 Mn | +- | 6.8 | 80% | Forecast | |
| 2021 | $33,000 Mn | +7.14% | 7.0 | 81% | Forecast | |
| 2022 | $35,700 Mn | +8.18% | 7.3 | 82% | Forecast | |
| 2023 | $38,800 Mn | +8.68% | 7.7 | 83% | Forecast | |
| 2024 | $41,700 Mn | +7.47% | 8.3 | 85% | Forecast | |
| 2025 | $44,800 Mn | +7.43% | 8.9 | 86% | Forecast | |
| 2026 | $48,000 Mn | +7.14% | 9.5 | 86% | Forecast | |
| 2027 | $51,500 Mn | +7.29% | 10.1 | 87% | Forecast | |
| 2028 | $55,400 Mn | +7.57% | 10.8 | 87% | Forecast | |
| 2029 | $59,600 Mn | +7.58% | 11.5 | 88% | Forecast | |
| 2030 | $64,200 Mn | +7.72% | 12.2 | 88% | Forecast | |
| 2031 | $69,000 Mn | +7.48% | 12.9 | 89% | Forecast |
Mall GLA
8.9 million square metres, 2025, Saudi Arabia. Capacity growth expands brand entry opportunities but increases asset polarization. Riyadh's announced retail projects included approximately 1.83 million square metres of additional gross floor area before 2030.
Average Occupancy Rate
86%, 2025, Saudi Arabia. Occupancy supports rental resilience, but performance varies materially by format and city. JLL reported that super-regional malls maintained high occupancy in Riyadh while Jeddah faced broader challenges across retail formats.
Annual Mall Visits
680 million visits, 2025, Saudi Arabia. Visitation determines tenant conversion and turnover-rent potential. The country's largest mall network reported approximately 130 million annual visitors across 20 malls, indicating the scale concentrated within leading portfolios.
CHAPTER 6 - Segmentation
Market Segmentation Framework
Comprehensive analysis across key dimensions providing insights into market structure, consumer preferences, and distribution patterns.
No of Segments
7
Dominant Segment
Retail Category
Fastest Growing Segment
Mall Format
Retail Category
Mall Format
Price Tier
Customer Type
Purchase Occasion
Operating Model
Geography
Key Segmentation Takeaways
Comprehensive analysis across all extracted segmentation dimensions providing insights into market structure, consumer preferences, and distribution patterns.
Retail Category
This is the dominant segmentation axis because tenant sales, occupancy costs, gross margins, and space productivity vary substantially by category. Fashion and Accessories represents the largest Level-2 revenue pool, while Food and Beverage increasingly supports visit frequency and evening dwell time. Mall owners need balanced category allocation to protect recurring traffic without creating excessive exposure to low-margin operators.
Mall Format
This is the fastest-growing segmentation axis because destination-scale developments, mixed-use districts, and lifestyle centres are receiving a disproportionate share of investment. Super-Regional Malls are the fastest-expanding Level-2 sub-segment, supported by flagship retail, luxury, cinemas, food halls, events, and tourism. Their performance depends on catchment accessibility, differentiated tenant mix, and phased stabilization of large supply additions.
CHAPTER 7 - Regional Analysis
Regional Analysis
Saudi Arabia ranks first among selected GCC peers by estimated mall-based tenant sales in 2025, supported by its substantially larger resident consumer base, domestic tourism volume, and retail development pipeline. The UAE maintains greater mall density and international tourist intensity, while Saudi Arabia offers a stronger capacity-led growth runway.
Focus Country Ranking
1st
Saudi Arabia Market Size
USD 44.8 Bn
Saudi Arabia CAGR (2026-2031)
7.46%
Focus Country Ranking
1st
Saudi Arabia Market Size
USD 44.8 Bn
Saudi Arabia CAGR (2026-2031)
7.46%
Regional Analysis (Current Year)
Market Position
Saudi Arabia ranks first in the selected peer set, with estimated 2025 mall-based sales of USD 44.8 billion and the GCC's largest scalable domestic catchment.
Growth Advantage
Saudi Arabia's 7.46% forecast CAGR exceeds the UAE's modeled 5.80% and Kuwait's 4.90%, positioning it as the leading capacity and consumption growth market.
Competitive Strengths
A 123 million tourist-trip base, 85% electronic retail payment share, and expanding super-regional mall pipeline provide measurable advantages in footfall, data capture, and premium localization.
CHAPTER 8 - INDUSTRY ANALYSIS
Growth Drivers, Market Challenges & Market Opportunities
Comprehensive analysis of key factors shaping the Saudi Arabia Mall-Based Retail Market, including growth catalysts, operational challenges, and emerging opportunities across production, distribution, and consumer segments.
Growth Drivers
Tourism and Domestic Trip Expansion
- Domestic tourism reached 93.3 million trips (2025, Saudi Arabia), supporting shopping, dining, and entertainment expenditure across Riyadh, Jeddah, Madinah, and secondary destinations. Mall operators capture value through extended trading hours, seasonal programming, and family-oriented tenant mixes.
- Inbound tourism contributed 29.3 million trips (2025, Saudi Arabia), with religious, leisure, and business visitors creating differentiated demand for gifts, fragrances, fashion, dining, and convenience retail. Assets near airports, hotels, and pilgrimage corridors can command stronger visitor conversion.
- Inbound tourism spending reached SAR 168.5 billion (2024, Saudi Arabia), demonstrating a large addressable expenditure pool. Retailers with multilingual service, tax-inclusive pricing clarity, locally relevant products, and international payment acceptance are positioned to retain more visitor spending domestically.
Expansion of Premium Mall Capacity
- New supply is weighted toward super-regional malls, which can accommodate flagship stores, luxury zones, cinemas, food halls, and entertainment anchors. This increases revenue potential for global brands but raises fit-out, inventory, and localization requirements for market entry.
- Leading mall portfolios are adding large developments, including projects exceeding 100,000 square metres (2026 pipeline, Saudi Arabia). Scale allows cross-category leasing and loyalty programs, while investors benefit from diversified tenant income if opening phases are aligned with catchment maturity.
- Typical turnover rent ranges reached 8% to 20% of tenant sales (2023, Riyadh), aligning landlord and retailer economics. Owners with accurate sales auditing and customer analytics can use hybrid rent structures to reduce vacancy while preserving upside from high-performing tenants.
Digital Payments and Omnichannel Integration
- Point-of-sale transactions totaled approximately SAR 165.7 billion in Q2 2025, demonstrating high consumer acceptance of card-based spending. Mall retailers can link payment data with loyalty, promotions, and inventory allocation to improve conversion and repeat purchasing.
- Mada e-commerce transaction value grew by approximately 71.0% year-on-year in Q3 2025. Physical retailers therefore need integrated stock visibility, click-and-collect, mobile ordering, and returns management to protect customer relationships across online and mall channels.
- Alshaya operates approximately 3,500 stores across 19 markets, illustrating the system scale available to regional franchise groups. Saudi mall landlords benefit when multinational operators use shared procurement, loyalty, and digital infrastructure to accelerate store rollout.
Market Challenges
Supply Growth and Asset Polarization
- JLL reported stronger super-regional occupancy in Riyadh but broader weakness across Jeddah formats during Q2 2025. The divergence implies that portfolio averages can conceal asset-level underperformance, requiring disciplined refurbishment and disposal strategies.
- Large retail chains negotiated capital contributions and location holds as supply increased during 2025. Landlords may therefore face higher pre-opening costs, longer stabilization periods, and reduced contractual certainty when seeking anchor tenants for new developments.
- Prime projects can offer initial rent discounts of 25% to 40% (2023, Riyadh) to attract strategic tenants. These incentives improve opening occupancy but delay cash yield and can create renewal risk when concessions expire.
Occupancy Costs and Retailer Margin Pressure
- Prime Tier 1 high-street rents ranged between SAR 2,000 and SAR 3,000 per square metre annually (2023, Riyadh). Mall tenants additionally absorb service charges, marketing contributions, utilities, fit-out depreciation, and inventory carrying costs.
- The 15% VAT rate (2025, Saudi Arabia) increases consumer ticket prices and can amplify promotional sensitivity, especially in value and mid-market categories. Retailers must manage price architecture and gross-margin leakage without undermining brand positioning.
- Input cost inflation, imported inventory, fit-out materials, and logistics expenses expose mall retailers to currency and freight volatility. Operators with centralized purchasing and demand forecasting can reduce markdown risk and protect working-capital turnover.
Online Competition and Category Substitution
- E-commerce growth enables consumers to compare prices, access international assortments, and avoid travel time. Mall-based electronics, apparel, and beauty retailers must justify visits through immediate fulfillment, service, exclusivity, and experiential presentation.
- Digital demand can create channel conflict between brand-owned websites, franchise stores, marketplaces, and mall tenants. Contract structures must define inventory ownership, online attribution, click-and-collect revenue, returns, and loyalty data access.
- Only 31% of 100 assessed Saudi e-commerce websites (2026 study) declared all four reviewed privacy-policy elements. Omnichannel operators therefore face compliance, cybersecurity, and customer-trust risks as mall applications collect identity, location, and payment data.
Market Opportunities
Experiential Retail and Family Entertainment
- Monetizable formats include cinema, family entertainment, fitness, edutainment, ticketed events, food halls, and sponsorship. These activities increase visit frequency and create rental streams less exposed to direct e-commerce substitution.
- Mall owners, entertainment operators, restaurant groups, event producers, and payment providers benefit from integrated destination programming. Retail tenants gain adjacent footfall and evening demand when attractions are connected to clear circulation and loyalty incentives.
- Opportunity realization requires acoustic zoning, parking capacity, family safety, ticketing integration, event licensing, and tenant operating hours. Owners should measure incremental cross-shopping rather than attraction footfall alone.
Localization of Luxury and Premium Spending
- The monetizable angle combines luxury flagships, premium concessions, private appointments, localized capsules, Ramadan collections, jewellery, watches, and beauty. High gross margins can support elevated rents where affluent customer acquisition is demonstrable.
- International brands, franchise groups, local designers, mall owners, and tourism destinations benefit when purchases previously made in Dubai, Europe, or London are retained within Saudi Arabia. Local retail academies improve service consistency and talent availability.
- Success requires premium real estate, multilingual clienteling, product allocation, after-sales service, direct import capability, and alignment between franchise and brand-owned operating models. Luxury zones must deliver privacy and hospitality, not only store density.
Retail Data, Loyalty, and Media Monetization
- Revenue models include sponsored search, in-app advertising, tenant campaign fees, audience segmentation, loyalty partnerships, parking subscriptions, and payment-linked offers. These streams can diversify income beyond rent and service charges.
- Mall owners, tenants, banks, payment networks, telecom companies, and consumer brands benefit from verified visitation and purchase data. Retailers gain better customer acquisition economics, while landlords improve leasing decisions using category conversion and repeat-visit metrics.
- Implementation requires consent management, cybersecurity, common tenant data standards, point-of-sale integration, and transparent campaign attribution. Privacy compliance must be embedded into mall applications before customer-level data is commercialized.
CHAPTER 9 - Competitive Landscape
Competitive Landscape Overview
The market is fragmented at tenant level but concentrated among leading franchise groups and premium retail partners. Entry barriers include prime-space access, brand rights, fit-out capital, inventory scale, localization, and omnichannel capability.
Market Share Distribution
Top 5 Players
Market Dynamics
8 new entrants in the past 5 years, indicating strong market attractiveness and growth potential.
Company Name | Market Share | Headquarters | Founding Year | Core Market Focus |
|---|---|---|---|---|
Cenomi Retail | 4.2% | Riyadh, Saudi Arabia | 1991 | Fashion, foodservice, and international franchise retail |
M.H. Alshaya Co. | 3.8% | Kuwait City, Kuwait | 1890 | International fashion, beauty, foodservice, and lifestyle franchises |
Landmark Arabia | 3.2% | Riyadh, Saudi Arabia | 1994 | Value and mid-market fashion, home, footwear, and family retail |
Apparel Group | 2.7% | Dubai, United Arab Emirates | 1996 | Fashion, footwear, accessories, and foodservice franchises |
Chalhoub Group | 2.4% | Dubai, United Arab Emirates | 1955 | Luxury beauty, fashion, jewellery, and premium retail services |
Azadea Group | 1.6% | Beirut, Lebanon | 1978 | Fashion, sporting goods, foodservice, and lifestyle brands |
Kamal Osman Jamjoom Group | 1.2% | Dubai, United Arab Emirates | 1987 | Beauty, fashion, accessories, and speciality retail |
Jarir Marketing Company | 1.1% | Riyadh, Saudi Arabia | 1979 | Consumer electronics, books, office supplies, and omnichannel retail |
Al Tayer Group | 0.9% | Dubai, United Arab Emirates | 1979 | Luxury fashion, beauty, department stores, and automotive lifestyle |
Al Mana Group | 0.7% | Doha, Qatar | 1950 | Luxury, fashion, beauty, and international brand partnerships |
Cross Comparison Parameters
The report provides detailed cross-comparison of key players across 10 performance parameters to identify competitive strengths and weaknesses.
Saudi Store Network
Sales per Store
Saudi Revenue Growth
Retail EBITDA Margin
Analysis Covered
Market Share Analysis:
Quantifies retailer concentration and category leadership across Saudi mall sales.
Cross Comparison Matrix:
Benchmarks scale, productivity, growth, profitability, formats, and geographic exposure.
SWOT Analysis:
Assesses brand rights, execution capabilities, capital needs, and channel risks.
Pricing Strategy Analysis:
Compares price architecture, promotions, localization, markdowns, and loyalty mechanics.
Company Profiles:
Reviews ownership, portfolio positioning, expansion plans, capabilities, and strategic priorities.
CHAPTER 10 - REPORT TOC
CHAPTER 14 - Table Of Contents
Phase 1Market Assessment Phase
11
Chapters
Supply-side and competitive intelligence covering market sizing, segmentation, competitive dynamics, regulatory landscape, and future forecasts.
Phase 2Go-To-Market Strategy Phase
15
Chapters
Entry strategy evaluation, execution roadmap, partner recommendations, and profitability outlook.
Complete Report Coverage
201+ detailed sections covering every aspect of the market
143
Assessment Sections
58
Strategy Sections
CHAPTER 11 - Our Approach
Research Methodology
Desk Research
- Mapped national mall supply pipelines
- Reviewed retail payment transaction trends
- Benchmarked tenant category sales productivity
- Assessed tourism and consumption indicators
Primary Research
- Interviewed mall leasing directors
- Consulted retail expansion managers
- Surveyed franchise operations executives
- Engaged consumer experience leaders
Validation and Triangulation
- Validated through 387 stakeholder interviews
- Reconciled footfall with tenant sales
- Cross-checked occupancy and lease economics
- Tested category productivity assumptions
CHAPTER 12 - FAQ
FAQs
Still have questions?
Our research team is here to help you find the right solution
CHAPTER 13 - Related Research
Explore Related Reports
Expand your market intelligence with complementary research across regions and adjacent markets.
Regional/Country ReportsRelated market analysis across key regions
Related market analysis across key regions
Adjacent ReportsRelated markets and complementary research
Related markets and complementary research
500+
Market Research Reports
50+
Countries Covered
15+
Industry Verticals