CHAPTER 1 - MARKET SUMMARY
Market Overview
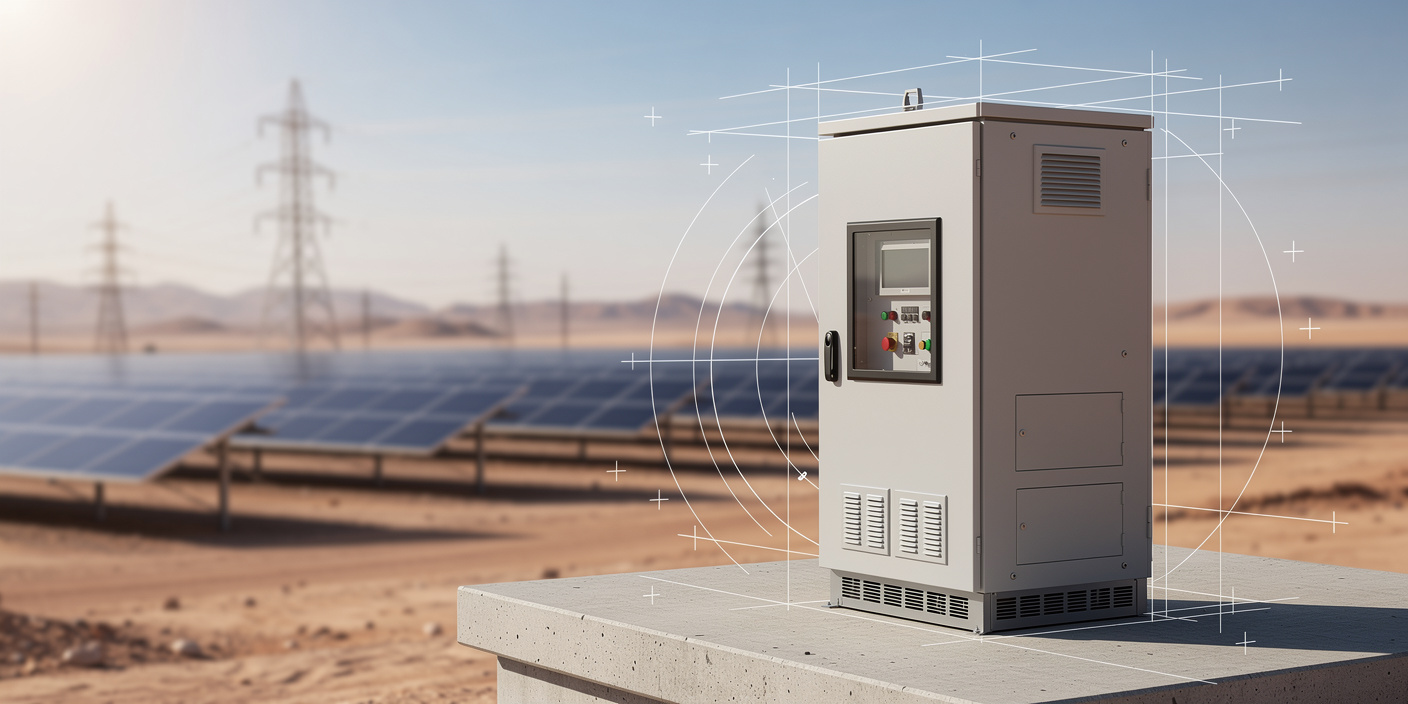
The Saudi Arabia Smart Grid & Distributed Energy Market combines regulated grid modernization with competitive distributed energy deployment. Demand is shaped by 349.2 TWh of electricity sold in 2025 across residential, commercial and industrial users. High cooling loads, expanding digital infrastructure and industrial diversification increase the value of automation, load forecasting, demand response and behind-the-meter resilience for utilities and large power consumers.
Riyadh and the Central Region form the principal decision and deployment hub because national utility procurement, ministry programs and major urban projects are concentrated there. Saudi Energy ended 2025 with 104,634 circuit-km of transmission lines and 534,014 MVA of transmission transformer capacity, making the central procurement ecosystem commercially decisive for grid OEMs, software vendors and EPC contractors.
Market Value
USD 8,500 Mn
2025
Dominant Region
Riyadh and Central Region
2025
Dominant Segment
Asset Type, AMI and grid automation assets
largest, 2025
Total Number of Players
105
Future Outlook
The Saudi Arabia Smart Grid & Distributed Energy Market is projected to increase from USD 8,500 Mn in 2025 to USD 15,200 Mn by 2031, representing a forecast CAGR of 10.17%. The forecast is supported by transmission and distribution expansion, higher automation density, renewable interconnection programs, storage deployment and commercial demand for resilient power. Growth moderates from the 2025 investment surge, then strengthens toward 2031 as DER aggregation, energy-as-a-service contracts and software-led optimization become larger components of market revenue.
Historical growth averaged 9.99% during 2020-2025, led initially by the smart-meter rollout and subsequently by renewable and storage integration. By 2031, value creation is expected to shift toward recurring software, cybersecurity, managed operations and performance-linked services. Hardware remains the largest revenue pool, but platforms that coordinate distributed generation, flexible loads, batteries and EV charging should capture faster growth as grid complexity rises and customers seek measurable reductions in peak demand, outage exposure and energy cost volatility.
10.17%
Forecast CAGR
USD 15,200 Mn
2030 Projection
Base Year
2025
Historical Period
2020-2025
Forecast Period
2026-2031
Historical CAGR
9.99%
CHAPTER 2 - SCOPE OF REPORT
Scope of the Market
CHAPTER 3 - Key Stakeholders
Key Target Audience
Key stakeholders who can leverage from this market analysis for investment, strategy, and operational planning.
Investors
CAGR, recurring revenue, capex intensity, contract bankability, risk
Corporates
energy cost, resilience, peak reduction, payback, emissions
Government
reliability, localization, renewable integration, cybersecurity, system efficiency
Operators
automation, DERMS, storage dispatch, outage restoration, interoperability
Financial institutions
project finance, covenants, contracted revenue, technology risk, returns
CHAPTER 4 - Market Size & Growth
Market Size, Growth Forecast and Trends
This section evaluates the historical market size, analyzes year-over-year growth dynamics, and presents forecast projections supported by market performance indicators and demand-side drivers.
Historical & Projected Market Size ($ Million)
Year-over-Year Growth Rate (%)
Market Value vs Volume Growth (%)
Historical Market Performance (2020-2025)
Historical revenue increased from USD 5,280 Mn in 2020 to USD 8,500 Mn in 2025. The trough occurred in 2021, when annual growth was 5.68% as procurement and project execution normalized after the initial smart-meter mobilization. Growth accelerated to 13.03% in 2025, the strongest year in the series, as grid-connected renewables reached 12.3 GW, distribution automation reached 40.8%, and commissioned battery storage created demand for integration, controls and power electronics.
Forecast Market Outlook (2026-2031)
Forecast revenue is projected to reach USD 15,200 Mn in 2031, with a 10.17% CAGR from 2025. Annual growth remains near 10% through 2028, then rises to 11.11% in 2031 as recurring software, cybersecurity, DER orchestration and lifecycle service revenues scale. The modeled deployment index increases from 169 in 2025 to 332 in 2031, indicating that physical deployment growth will remain slightly ahead of value growth as equipment costs decline and software content expands.
Reconciliation Summary
CHAPTER 5 - Market Data
Market Breakdown
The Saudi Arabia Smart Grid & Distributed Energy Market is moving from one-time metering and grid hardware programs toward integrated portfolios that combine renewable interconnection, storage, automated field equipment and recurring digital services. For CEOs and investors, the key issue is not only deployment scale but also the rising share of software, managed operations and performance-linked revenue.
Year | Market Size (USD Mn) | YoY Growth (%) | Grid-Connected Renewables (GW) | Distribution Automation (%) | Smart Equipment Installed (000 units) | Period |
|---|---|---|---|---|---|---|
| 2020 | $5,280 Mn | +- | 0.3 | 18.5% | Forecast | |
| 2021 | $5,580 Mn | +5.68% | 0.7 | 23.0% | Forecast | |
| 2022 | $6,080 Mn | +8.96% | 1.1 | 27.5% | Forecast | |
| 2023 | $6,710 Mn | +10.36% | 2.8 | 32.0% | Forecast | |
| 2024 | $7,520 Mn | +12.07% | 6.6 | 36.4% | Forecast | |
| 2025 | $8,500 Mn | +13.03% | 12.3 | 40.8% | Forecast | |
| 2026 | $9,340 Mn | +9.88% | 19.5 | 48.0% | Forecast | |
| 2027 | $10,240 Mn | +9.64% | 29.0 | 56.0% | Forecast | |
| 2028 | $11,240 Mn | +9.77% | 41.0 | 65.0% | Forecast | |
| 2029 | $12,380 Mn | +10.14% | 56.0 | 75.0% | Forecast | |
| 2030 | $13,680 Mn | +10.50% | 75.0 | 87.0% | Forecast | |
| 2031 | $15,200 Mn | +11.11% | 92.0 | 94.0% | Forecast |
Grid-Connected Renewables
12.3 GW, 2025, Saudi Arabia. Interconnection demand expands the addressable market for substations, protection, forecasting and grid controls. A further 14 GWh of battery storage was under development after 8 GWh entered service.
Distribution Automation
40.8%, 2025, Saudi Arabia. The automation gap leaves a multi-year pipeline for smart field equipment and ADMS integration. Saudi Energy reported approximately 126,000 smart equipment units installed by year-end 2025.
Smart Equipment Installed
126,000 units, 2025, Saudi Arabia. Installed field intelligence creates recurring software, maintenance and cybersecurity demand. The earlier national AMI program covered approximately 10 million smart meters, establishing a large data foundation for demand-side services.
CHAPTER 6 - Segmentation
Market Segmentation Framework
Comprehensive analysis across key dimensions providing insights into market structure, customer requirements, asset economics and procurement patterns.
No of Segments
7
Dominant Segment
Asset Type
Fastest Growing Segment
Technology
Project Type
Asset Type
End-Use Sector
Ownership Model
Contracting Model
Technology
Geography
Key Segmentation Takeaways
Comprehensive analysis across all extracted segmentation dimensions providing insights into market structure, customer requirements, asset economics and procurement patterns.
Asset Type
Advanced metering and distribution automation remain the largest commercial pool because they are embedded in regulated utility investment and require nationwide installation, communications, integration and maintenance. Distributed generation and storage assets are narrowing the gap as renewable capacity rises. Suppliers with interoperable hardware, local service capability and cybersecurity credentials hold the strongest position in complex utility procurements.
Technology
Distributed Energy Resource Management Systems are the fastest-growing technology because the grid must coordinate solar, batteries, EV charging, flexible industrial loads and customer-owned assets. Growth shifts value from standalone equipment toward software subscriptions, optimization engines, forecasting, API integration and managed control services. Vendors that prove performance across utility and behind-the-meter environments can build recurring, higher-margin revenue.
CHAPTER 7 - Regional Analysis
Regional Analysis
Saudi Arabia ranks second among selected Gulf peers by 2025 smart-grid and distributed-energy market value, behind the UAE but substantially ahead of Qatar, Oman and Kuwait. Its position reflects a uniquely large electricity system, rapid renewable interconnection and national utility investment in automation, storage and digital field assets.
Focus Country Ranking
2nd
Focus Country Market Size
USD 8,500 Mn (2025)
Saudi Arabia CAGR (2026-2031)
10.17%
Focus Country Ranking
2nd
Focus Country Market Size
USD 8,500 Mn (2025)
Saudi Arabia CAGR (2026-2031)
10.17%
Regional Analysis (Current Year)
Market Position
Saudi Arabia holds the 2nd position with USD 8,500 Mn in 2025, supported by 340.4 TWh of electricity consumption and national-scale grid procurement.
Growth Advantage
Saudi Arabia's 10.17% CAGR exceeds the UAE's modeled 7.00% and Kuwait's 8.40%, while remaining below Qatar's smaller-base growth rate of 13.00%.
Competitive Strengths
The Kingdom combines 12.3 GW of grid-connected renewables, 8 GWh of commissioned storage and 40.8% distribution automation, creating unmatched Gulf deployment breadth.
CHAPTER 8 - INDUSTRY ANALYSIS
Growth Drivers, Market Challenges & Market Opportunities
Comprehensive analysis of key factors shaping the Saudi Arabia Smart Grid & Distributed Energy Market, including growth catalysts, operational challenges, and emerging opportunities across grid infrastructure, distributed generation, storage and digital energy services.
Growth Drivers
National Grid Modernization and Automation
- Saudi Energy expanded the distribution network to 859,050 circuit-km (2025, Saudi Arabia), increasing requirements for remote monitoring, automated switching and asset analytics across a geographically dispersed system. OEMs and integrators capture value through smart RMUs, sensors, communications and lifecycle maintenance.
- The transmission fiber network reached 104,417 km (2025, Saudi Arabia), providing a digital backbone for SCADA, protection, synchrophasor and substation communications. Vendors that combine operational technology with secure networking can expand from hardware supply into recurring monitoring and cybersecurity contracts.
- Approximately 126,000 smart equipment units (2025, Saudi Arabia) were installed, demonstrating sustained procurement beyond the national meter rollout. Local manufacturing, fast field service and interoperability with utility control systems become decisive differentiators in framework agreements and multi-region deployments.
Renewable and Storage Integration
- Commissioned battery storage totaled 8 GWh (2025, Saudi Arabia) across four sites, creating immediate demand for energy management, grid-forming controls, protection coordination and long-term performance services. Battery OEMs, power electronics suppliers and controls specialists gain the largest direct opportunity.
- A further 14 GWh (2025 pipeline, Saudi Arabia) was under development, supporting a multi-year integration cycle rather than a one-off procurement event. Value shifts toward commissioning, augmentation, degradation analytics, warranty management and dispatch optimization after initial equipment delivery.
- Saudi policy targets a power mix of 50% renewables by 2030 (Saudi Arabia), which requires faster forecasting, balancing and congestion management. Grid software providers and flexible-load aggregators benefit as variable generation becomes operationally material and curtailment avoidance gains financial value.
Electricity Demand and Customer Digitization
- The utility customer base expanded to 11.5 million (2025, Saudi Arabia), increasing the addressable population for digital energy portals, time-of-use analytics and distributed energy offers. Platform providers can monetize software and service layers on top of the installed AMI base.
- Residential customers represented 47.4% of electricity consumption (2024, Saudi Arabia), making cooling-load management and rooftop solar economics strategically relevant. Utilities and solution providers can reduce peak-system costs through automated demand response, smart thermostats and community-scale flexibility programs.
- Commercial and industrial users accounted for 35.9% of electricity consumption (2024, Saudi Arabia), providing concentrated loads with measurable savings potential. Energy-as-a-service providers can bundle solar, storage, controls and financing where avoided demand charges and outage costs support contract economics.
Market Challenges
Capital Intensity and Procurement Concentration
- Utility-led procurement concentrates revenue in a limited number of major tenders, increasing working-capital and bonding requirements for suppliers. With 55 transmission substations added in 2025 (Saudi Arabia), execution capacity and balance-sheet strength are essential for participation in concurrent programs.
- Long lead times for transformers, protection systems and power electronics expose EPC margins to logistics and commodity volatility. Transmission transformer capacity reached 534,014 MVA (2025, Saudi Arabia), indicating procurement scale that can strain specialist supply chains and testing capacity.
- Localization requirements increase near-term setup costs but affect bid competitiveness and contract eligibility. Saudi Energy reported 63.38% local content achieved in 2024, requiring international vendors to build local assembly, training and service capability rather than rely solely on imports.
Cybersecurity and Interoperability Risk
- AMI, DERMS, ADMS and SCADA must exchange operational data without weakening control-system security. Approximately 3 million IoT SIMs (2025, Saudi Energy) supported smart meters and IoT rollout, increasing identity, patching and network-segmentation requirements.
- Multi-vendor deployments create protocol and data-model integration costs that can delay commissioning and reduce expected automation benefits. Distribution automation was only 40.8% (2025, Saudi Arabia), so new assets must interoperate with a large installed base of mixed-age equipment.
- Cybersecurity qualification, local hosting and operational resilience add recurring compliance expenses. The grid serves 11.5 million customers (2025, Saudi Arabia), so incidents can carry national service and reputational consequences, favoring vendors with utility-grade governance and local incident response.
Distributed Energy Regulation and Project Economics
- Connection approvals, technical studies and certified-contractor requirements increase development time for small-scale systems. The framework requires exported energy to be recorded through the service provider's billing system, making metering and settlement integration a prerequisite for bankable projects.
- Customer economics vary by load profile, tariff class and self-consumption ratio, reducing the usefulness of standardized sales propositions. Average household electricity consumption reached 18.6 MWh (2024, Saudi Arabia), but peak timing and roof suitability determine actual solar and storage value.
- Low-cost utility power can lengthen payback periods for customer-owned DER without resilience or sustainability value. Grid losses were 8.5% (2024, Saudi Arabia), so system-level benefits exist, but commercial contracts must allocate avoided network costs and flexibility value clearly.
Market Opportunities
DERMS and Energy-as-a-Service Platforms
- USD 15,200 Mn market value by 2031 (Saudi Arabia) supports recurring revenue models based on software subscriptions, optimization fees and shared savings. Platform vendors can expand margins by linking forecasting, dispatch, settlement and asset-performance modules.
- Utilities, C&I customers and project developers benefit from a common control layer that coordinates batteries, solar, EV charging and flexible loads. The commissioned 8 GWh BESS fleet (2025, Saudi Arabia) creates a near-term reference base for optimization services.
- Opportunity realization requires standardized APIs, dispatch rules and settlement mechanisms. The national AMI base of approximately 10 million meters (2021 rollout, Saudi Arabia) provides data coverage, but commercial aggregation needs explicit participation and compensation frameworks.
Industrial Microgrids and Behind-the-Meter Storage
- Developers can monetize design-build-operate contracts combining solar, storage, controls and maintenance, with returns supported by avoided downtime and fuel consumption. Energy solutions providers reported 89 distributed energy projects (2025, Saudi Energy), demonstrating an emerging commercial pipeline.
- Data centers, mines, petrochemical plants and giga-project assets benefit from power-quality and resilience guarantees. A sales pipeline exceeding USD 667 Mn equivalent (2025, Saudi Energy) indicates buyer willingness to contract for integrated energy solutions beyond utility supply.
- Scale requires bankable long-term service contracts, standardized interconnection and credible performance guarantees. The 3% self-consumption cap (current framework, Saudi Arabia) makes regulatory capacity allocation and early project qualification strategically important.
Localization of Smart Equipment and Digital Services
- Manufacturers can localize smart RMUs, meters, sensors, inverters, battery enclosures and control panels to access framework tenders and reduce lead times. The national smart-meter program sourced 3.5 million units locally (2020 program, Saudi Arabia), establishing precedent for localized grid technology.
- Saudi investors and industrial groups benefit from joint ventures that combine global intellectual property with local assembly, testing and field service. The utility's 126,000 smart equipment installed base (2025, Saudi Arabia) supports aftermarket demand for spares, calibration, firmware and maintenance.
- Digital localization must progress beyond hardware toward Arabic interfaces, local data hosting, cybersecurity operations and Saudi engineering talent. Approximately 4.6 million active digital-service users (2025, Saudi Energy) demonstrate the scale of customer-facing platforms requiring continuous product development.
CHAPTER 9 - Competitive Landscape
Competitive Landscape Overview
The market is moderately concentrated around utility-led procurement and a limited group of large developers, grid OEMs and EPC contractors; technical qualification, localization, reference projects and balance-sheet capacity create material entry barriers.
Market Share Distribution
Top 5 Players
Market Dynamics
8 new entrants in the past 5 years, indicating strong market attractiveness and growth potential.
Company Name | Market Share | Headquarters | Founding Year | Core Market Focus |
|---|---|---|---|---|
Saudi Electricity Company | - | Riyadh, Saudi Arabia | 1999 | Transmission, distribution automation, advanced metering, storage and distributed energy services |
ACWA Power | - | Riyadh, Saudi Arabia | 2004 | Renewable generation, battery storage and long-term contracted energy infrastructure |
alfanar | - | Riyadh, Saudi Arabia | 1976 | Grid equipment, EPC, automation, power systems and battery storage integration |
Siemens Energy | - | Munich, Germany | 2020 | Grid technologies, digital substations, transmission systems and control platforms |
Schneider Electric | - | Rueil-Malmaison, France | 1836 | Energy management, distribution automation, microgrids and industrial digital power |
Hitachi Energy | - | Zurich, Switzerland | 2020 | Grid automation, HVDC, transformers, power quality and energy management software |
GE Vernova | - | Cambridge, United States | 2024 | Grid solutions, protection, controls, power conversion and renewable integration |
BYD Company Limited | - | Shenzhen, China | 1995 | Battery energy storage systems, cells, power conversion and integrated storage platforms |
Huawei Technologies Co., Ltd. | - | Shenzhen, China | 1987 | Digital power, solar inverters, storage, communications and intelligent energy management |
Larsen & Toubro Limited | - | Mumbai, India | 1938 | Power transmission and distribution EPC, substations and grid modernization projects |
Cross Comparison Parameters
The report provides detailed cross-comparison of key players across 10 performance parameters to identify competitive strengths and weaknesses.
Grid-Connected Capacity Enabled (GW)
Automated Distribution Assets Deployed (Units)
Saudi Sector Revenue Growth (%)
Project EBITDA Margin (%)
Analysis Covered
Market Share Analysis:
Quantifies utility, OEM, developer and integrator positions across revenue pools.
Cross Comparison Matrix:
Benchmarks deployment scale, localization, margins and project execution capability consistently.
SWOT Analysis:
Assesses strategic advantages, constraints, exposure and defensible growth options objectively.
Pricing Strategy Analysis:
Compares hardware, software, EPC and service pricing across procurement models.
Company Profiles:
Maps ownership, capabilities, partnerships, contracts and Saudi market positioning comprehensively.
CHAPTER 10 - REPORT TOC
CHAPTER 14 - Table Of Contents
Phase 1Market Assessment Phase
11
Chapters
Supply-side and competitive intelligence covering market sizing, segmentation, competitive dynamics, regulatory landscape, and future forecasts.
Phase 2Go-To-Market Strategy Phase
15
Chapters
Entry strategy evaluation, execution roadmap, partner recommendations, and profitability outlook.
Complete Report Coverage
201+ detailed sections covering every aspect of the market
143
Assessment Sections
58
Strategy Sections
CHAPTER 11 - Our Approach
Research Methodology
Desk Research
- Reviewed Saudi electricity statistical publications
- Mapped grid modernization investment programs
- Analyzed distributed energy connection regulations
- Benchmarked utility and developer filings
Primary Research
- Interviewed utility grid planning directors
- Consulted DER project development managers
- Engaged power systems engineering leads
- Surveyed industrial energy procurement heads
Validation and Triangulation
- Validated findings across 360 respondents
- Reconciled capex with project pipelines
- Cross-checked deployment and revenue intensity
- Tested downside and upside scenarios
CHAPTER 12 - FAQ
FAQs
Still have questions?
Our research team is here to help you find the right solution
CHAPTER 13 - Related Research
Explore Related Reports
Expand your market intelligence with complementary research across regions and adjacent markets.
Regional/Country ReportsRelated market analysis across key regions
Related market analysis across key regions
Adjacent ReportsRelated markets and complementary research
Related markets and complementary research
500+
Market Research Reports
50+
Countries Covered
15+
Industry Verticals