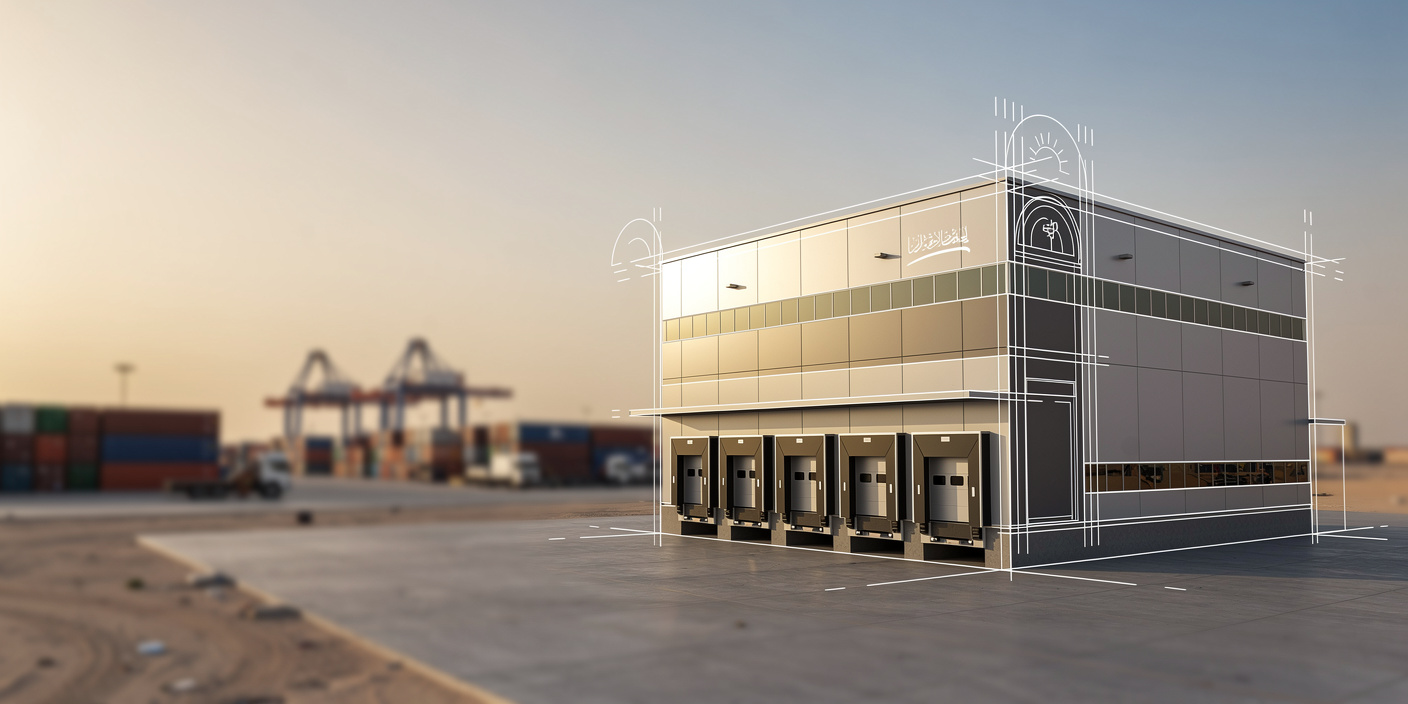
CHAPTER 1 - MARKET SUMMARY
Market Overview
The Saudi Arabia Warehousing Market functions through storage, inventory control, fulfillment, cross-docking, dispatch preparation and value-added handling across commercial, captive and institutional facilities. More than 290 million delivery orders were fulfilled in 2024, up 27.2%, increasing the commercial importance of forward inventory placement, rapid picking and flexible urban replenishment for retailers, manufacturers and digital-commerce operators.
Riyadh is the principal national distribution hub because it combines the largest inland consumption base with dense industrial and logistics investment. Official 2024 records counted 6,763 licensed commercial warehouses in Riyadh Region covering about 10.7 million sqm, while major private projects are adding Grade A capacity. This concentration improves route density but raises competition for high-specification sites.
Market Value
USD 7,265 million
2025
Dominant Region
Central Region, led by Riyadh
2025
Dominant Segment
Storage Services
2025
Total Number of Players
1,500+
2025
Future Outlook
The Saudi Arabia Warehousing Market is projected to expand from USD 7,265 Mn in 2025 to USD 11,290 Mn by 2032, a 6.50% forecast CAGR. The historical 2020-2025 trajectory averaged 6.80%, with growth strengthening as e-commerce fulfillment, industrial localization and specialized storage demand broadened warehouse utilization. The 2031 interim market size is modeled at USD 10,601 Mn. Forecast growth remains supported by the 59-center logistics program, continued Grade A investment and service-mix improvement. The model preserves the supplied 2026 and 2027 estimates and extends the same base-case growth logic through the mandated 2032 terminal year.
Physical expansion and higher service intensity both contribute to the outlook. Occupied warehousing floor space increases from 68.70 million sqm in 2025 to about 90.40 million sqm by 2032 under a 4.0% annual volume assumption, while blended revenue per occupied sqm rises from about USD 105.8 to USD 124.9. The gap between value and volume growth reflects a higher mix of fulfillment, cold-chain, bonded, inventory-management and automation-enabled services rather than aggressive rental inflation. Investors should therefore prioritize compliant capacity, customer integration and throughput economics, while occupiers should secure strategic space early in Riyadh, Jeddah and Dammam.
6.50%
Forecast CAGR
$11,290 Mn
2030 Projection
Base Year
2025
Historical Period
2020-2025
Forecast Period
2025-2032
Historical CAGR
6.80%
CHAPTER 2 - SCOPE OF REPORT
Scope of the Market
CHAPTER 3 - Key Stakeholders
Key Target Audience
Key stakeholders who can leverage from this market analysis for investment, strategy, and operational planning.
Investors
occupancy, rental growth, capex intensity, automation, returns, pipeline
Corporates
storage cost, inventory turns, SLA, fulfillment resilience, compliance
Government
logistics capacity, licensing, localization, trade efficiency, resilience, investment
Operators
utilization, throughput, automation, cold chain, contract retention, pricing
Financial institutions
project finance, occupancy covenants, cash flow, demand stability
CHAPTER 4 - Market Size & Growth
Market Size, Growth Forecast and Trends
This section evaluates the historical market size, analyzes year-over-year growth dynamics, and presents forecast projections supported by market performance indicators and demand-side drivers.
Historical & Projected Market Size ($ Million)
Year-over-Year Growth Rate (%)
Market Value vs Volume Growth (%)
Historical Market Performance (2020-2025)
The modeled historical series rises from USD 5,229 Mn in 2020 to the locked USD 7,265 Mn base in 2025, equivalent to a 6.80% CAGR. Annual value growth was weakest in 2021 at 4.80% as pandemic-era operating disruption and uneven inventory normalization constrained expansion. Growth strengthened to 7.61% in 2023 and peaked at 7.80% in 2024, coinciding with 12,234 licensed commercial warehouses and accelerating delivery activity. The 2025 increase of 7.52% reflects continued tight prime capacity, expansion of higher-specification facilities and rising warehouse-based service intensity.
Forecast Market Outlook (2025-2032)
The base case maintains the supplied 2026 value of USD 7,738 Mn and 2027 value of USD 8,241 Mn, then extends a 6.50% value CAGR through 2032. Terminal market value reaches USD 11,290 Mn while occupied floor space increases at 4.0% annually, implying a roughly 2.5 percentage-point value-over-volume spread. That spread is attributed to automation, fulfillment, bonded storage, cold-chain compliance and value-added handling rather than pure rent escalation. Growth therefore depends on successful absorption of new Grade A capacity and increasing revenue per occupied sqm as operators deepen customer integration.
CHAPTER 5 - Market Data
Market Breakdown
The Saudi Arabia Warehousing Market combines a steadily expanding revenue base with high utilization in major hubs and a larger national logistics-center network. For CEOs and investors, returns increasingly depend on occupied capacity, service density and the ability to monetize specialized handling rather than floor space alone.
Year | Market Size (USD Mn) | YoY Growth (%) | Occupied Floor Space (Mn sqm) | Blended Revenue/sqm (USD) | Prime Hub Occupancy (%) | Period |
|---|---|---|---|---|---|---|
| 2020 | $5,229 Mn | +- | - | - | Forecast | |
| 2021 | $5,480 Mn | +4.80% | - | - | Forecast | |
| 2022 | $5,825 Mn | +6.30% | - | - | Forecast | |
| 2023 | $6,268 Mn | +7.61% | - | - | Forecast | |
| 2024 | $6,757 Mn | +7.80% | - | - | Forecast | |
| 2025 | $7,265 Mn | +7.52% | 68.70 | 105.8 | Forecast | |
| 2026 | $7,738 Mn | +6.51% | 71.45 | 108.3 | Forecast | |
| 2027 | $8,241 Mn | +6.50% | 74.31 | 110.9 | Forecast | |
| 2028 | $8,776 Mn | +6.49% | 77.28 | 113.6 | Forecast | |
| 2029 | $9,346 Mn | +6.49% | 80.37 | 116.3 | Forecast | |
| 2030 | $9,954 Mn | +6.51% | 83.58 | 119.1 | Forecast | |
| 2031 | $10,601 Mn | +6.50% | 86.92 | 122.0 | Forecast | |
| 2032 | $11,290 Mn | +6.50% | 90.40 | 124.9 | Forecast |
Occupied Floor Space
68.70 million sqm, 2025, Saudi Arabia. Scale is the principal physical denominator for the broad service-value model. Official 2024 records separately identified 12,234 licensed commercial warehouses covering more than 22 million sqm, confirming substantial formal stock alongside captive and logistics-center capacity.
Blended Revenue per sqm
USD 105.8/sqm, 2025, Saudi Arabia. Higher revenue density depends on fulfillment, regulated storage and handling services. SAL estimated national warehouse occupancy around 97% and demand rising from about 87 million sqm in 2023 to 115 million sqm by 2030.
Prime Hub Occupancy
97.0%, 2025, Saudi Arabia major hubs. Tight utilization supports development economics but raises occupier costs and pre-leasing risk. In regulated sectors, licensed factories and warehouses under SFDA supervision increased 18% in 2025 to 9,155 facilities, strengthening demand for compliant storage capacity.
CHAPTER 6 - Segmentation
Market Segmentation Framework
Comprehensive analysis across key dimensions providing insights into market structure, consumer preferences, and distribution patterns.
No of Segments
7
Dominant Segment
Service Type
Fastest Growing Segment
Technology Adoption
Service Type
Warehouse Type
Temperature Control
Technology Adoption
End-Use Industry
Business Model
Geography
Key Segmentation Takeaways
Comprehensive analysis across all extracted segmentation dimensions providing insights into market structure, consumer preferences, and distribution patterns.
Service Type
Storage Services remain the largest foundational revenue pool because both outsourced and captive warehouse operations require recurring space, inventory control and handling. The commercial upside comes from layering fulfillment, labeling, kitting, quality checks and dispatch management onto existing capacity, improving revenue per occupied sqm and increasing switching costs for large retail, healthcare and industrial customers.
Technology Adoption
Fully Automated Warehousing is the fastest-growing configuration as high-volume retail, e-commerce and regulated customers demand better inventory accuracy, faster throughput and traceability. WMS integration, automated storage and retrieval, sortation and goods-to-person robotics can reduce labor intensity and increase storage density, making automation a primary differentiator for operators seeking multi-year contracts and premium service economics.
CHAPTER 7 - Regional Analysis
Regional Analysis
Saudi Arabia ranks second among selected GCC warehousing peers by modeled 2025 market size, behind the UAE but materially ahead of Kuwait, Qatar, Oman and Bahrain. Its position reflects a larger domestic demand base, industrial diversification and a 59-center logistics program that broadens national distribution infrastructure.
Focus Country Ranking
2nd
Focus Country Market Size
USD 7,265 Mn (2025)
Saudi Arabia CAGR (2025-2032)
6.50%
Focus Country Ranking
2nd
Focus Country Market Size
USD 7,265 Mn (2025)
Saudi Arabia CAGR (2025-2032)
6.50%
Regional Analysis (Current Year)
Regional Analysis Comparison
Market Position
Saudi Arabia ranks 2nd in the selected GCC peer set at USD 7,265 Mn in 2025, supported by USD 232.81 Bn of merchandise imports and a large domestic distribution base.
Growth Advantage
Saudi Arabia's 6.50% forecast CAGR trails the UAE at 8.30% and Qatar at 8.00%, but its larger base creates a substantial absolute revenue pool for scalable national operators.
Competitive Strengths
A 3.4 LPI score, 12,234 licensed commercial warehouses and 59 planned logistics centers give Saudi Arabia unusual domestic scale, multimodal reach and policy-backed capacity expansion within the GCC.
CHAPTER 8 - INDUSTRY ANALYSIS
Growth Drivers, Challenges & Opportunities
Comprehensive analysis of key factors shaping the Saudi Arabia Warehousing Market, including growth catalysts, operational challenges, and emerging opportunities across production, distribution, and consumer segments.
Growth Drivers
National Logistics Infrastructure Expansion
- The national layout allocates 12 centers to Riyadh (2030 plan, Saudi Arabia), reinforcing the capital's role as the main inland distribution and consumption hub for enterprise inventory.
- Makkah Region receives 12 logistics centers (2030 plan, Saudi Arabia), supporting Jeddah port-linked warehousing, retail replenishment and western-region import distribution with shorter inland transfers.
- The Eastern Region is allocated 17 logistics centers (2030 plan, Saudi Arabia), creating capacity for industrial, petrochemical and cross-border supply chains around Dammam and Jubail.
E-Commerce and High-Frequency Fulfillment
- Delivery orders increased 27.2% (2024, Saudi Arabia), creating demand for multi-client fulfillment, item-level picking, return handling and inventory positioning near major consumer clusters.
- Average delivery time fell from 45 to 35 minutes (2024, Saudi Arabia), strengthening the economics of forward stocking and urban-adjacent fulfillment capacity.
- Electronic payments represented 79% of retail payments (2024, Saudi Arabia), supporting continued migration toward digitally orchestrated commerce and warehouse-integrated fulfillment demand.
Grade A and Multinational Capacity Investment
- The DHL project includes 53,000 sqm of advanced multi-user warehousing (planned 2027, Riyadh), targeting technology, retail, automotive, energy and e-commerce verticals.
- Maersk opened a 225,000 sqm logistics park (2024, Jeddah) with multimodal, bonded and temperature-controlled capability, raising the competitive benchmark for integrated facilities.
- Agility Logistics Parks delivered 226,000 sqm of new space (2025, Saudi Arabia), indicating continued institutional confidence in Grade A warehouse absorption.
Market Challenges
Tight Prime Capacity and Rental Pressure
- Riyadh warehouse rents increased 16% in H1 2025 (Saudi Arabia), compressing tenant economics and increasing the value of early pre-leasing for strategic facilities.
- Jeddah rents increased 8% in H1 2025 (Saudi Arabia), raising distribution costs for import-heavy consumer, retail and food supply chains linked to the western gateway.
- Dammam rents increased 9% in H1 2025 (Saudi Arabia), making location and contract duration more important for industrial and petrochemical occupiers in the Eastern Region.
Fragmented Legacy Stock and Modernization Burden
- Commercial warehouses covered more than 22 million sqm (2024, Saudi Arabia), but modern demand increasingly favors higher clear heights, dock access, fire systems and digital inventory control.
- Activated logistics centers covered 34.6 million sqm (2024, Saudi Arabia), creating a scale transition that can strand lower-grade standalone stock if operators do not upgrade services.
- More than 1,500 unified logistics licenses (latest program disclosure, Saudi Arabia) increase formal competition and place pressure on undifferentiated storage providers to improve service quality.
Specialized Compliance and Operating Complexity
- Food-sector regulation covered 5,344 licensed warehouses (2025, Saudi Arabia), increasing requirements for traceability, hygiene, temperature control and documented operating procedures.
- Medical devices accounted for 1,313 licensed warehouses (2025, Saudi Arabia), raising the value of specialized QA, inventory visibility and controlled-storage capabilities.
- Drug-sector warehousing included 568 licensed warehouses (2025, Saudi Arabia), making validated temperature management and compliance expertise a meaningful barrier to entry.
Market Opportunities
Value-Added Fulfillment Monetization
- Operators can monetize 290+ million delivery orders (2024, Saudi Arabia) through picking, labeling, returns, packaging and inventory-control fees rather than storage rent alone.
- Investors benefit when integrated service contracts lift revenue density above the USD 105.8/sqm base (2025, Saudi Arabia) used in the market model.
- Value capture requires WMS integration and customer data connectivity as electronic payments reached 12.6 billion transactions (2024, Saudi Arabia), signaling wider digital commerce intensity.
Bonded and Re-Export Warehousing
- Maersk's Jeddah facility represents a USD 250 million investment (2024, Saudi Arabia), demonstrating institutional willingness to fund integrated bonded and multimodal warehousing.
- LogiPoint's South Jeddah platform sits within a 150 km2 logistics hub (latest, Jeddah), supporting port-adjacent storage, cross-docking and re-export service density.
- The national plan targets 59 logistics centers by 2030 (Saudi Arabia), widening the number of nodes where bonded and multimodal services can be commercially replicated.
Healthcare and Temperature-Controlled Expansion
- Tamer Logistics operates 12 warehousing facilities across seven cities (latest, Saudi Arabia), illustrating the nationwide footprint needed for healthcare and FMCG service contracts.
- SAL operated 45,900 sqm of logistics warehouse capacity (year-end 2025, Saudi Arabia) and is expanding specialist capabilities, creating partnership and outsourcing opportunities.
- SFDA licensing covered 831 cosmetics warehouses (2025, Saudi Arabia), adding another compliance-sensitive customer pool for temperature, quality and traceability services.
CHAPTER 9 - Competitive Landscape
Competitive Landscape Overview
The market combines large multinational and national logistics platforms with a fragmented local tail; competition centers on compliant capacity, network reach, automation, specialization, occupancy and integrated contract-logistics execution.
Market Share Distribution
Top 5 Players
Market Dynamics
8 new entrants in the past 5 years, indicating strong market attractiveness and growth potential.
Company Name | Market Share | Headquarters | Founding Year | Core Market Focus |
|---|---|---|---|---|
DHL Supply Chain | - | Bonn, Germany | 1969 | Contract logistics, multi-user warehousing and e-commerce fulfillment |
DSV Saudi Arabia | - | Hedehusene, Denmark | 1976 | Contract warehousing, distribution, customs and value-added services |
Agility Logistics Parks | - | Kuwait City, Kuwait | - | Grade A warehousing, logistics parks and build-to-suit facilities |
CEVA Almajdouie Logistics | - | Riyadh, Saudi Arabia | 2024 | Contract logistics, bonded storage, distribution and inventory management |
Tamer Logistics | - | Jeddah, Saudi Arabia | 2011 | Healthcare, FMCG, cosmetics and compliance-led warehousing |
SAL Saudi Logistics Services | - | Jeddah, Saudi Arabia | 2019 | Warehouse fulfillment, specialist logistics and logistics-zone development |
Kuehne+Nagel Saudi Arabia | - | Schindellegi, Switzerland | 1890 | Contract logistics, warehousing and integrated supply-chain services |
Bahri Integrated Logistics | - | Riyadh, Saudi Arabia | 1978 | Storage, contract logistics, distribution and value-added logistics |
Wared Logistics | - | Jeddah, Saudi Arabia | - | Ambient, chilled warehousing and nationwide distribution |
LogiPoint | - | Jeddah, Saudi Arabia | - | Bonded re-export zones, logistics parks and warehousing infrastructure |
Cross Comparison Parameters
The report provides detailed cross-comparison of key players across 10 performance parameters to identify competitive strengths and weaknesses.
Warehousing Capacity
Prime Hub Occupancy
In-Scope Revenue Growth
EBITDA Margin
Analysis Covered
Market Share Analysis:
Assesses warehouse revenue concentration across major operator and facility tiers.
Cross Comparison Matrix:
Benchmarks capacity, occupancy, growth and profitability across leading warehouse operators.
SWOT Analysis:
Evaluates network strengths, capability gaps, opportunities and operating execution risks.
Pricing Strategy Analysis:
Compares storage, handling, fulfillment and contract monetization approaches across players.
Company Profiles:
Reviews operating footprint, specialization, investment priorities and service capabilities comprehensively.
CHAPTER 10 - REPORT TOC
Table of Contents
Market Assessment Phase
Supply-side and competitive intelligence covering market sizing, segmentation, competitive dynamics, regulatory landscape, and future forecasts.
Go-To-Market Strategy Phase
15 chapters
Entry strategy evaluation, execution roadmap, partner recommendations, and profitability outlook.
Survey Phase
8 chapters
Demand-side primary research conducted through structured interviews and online surveys with end users across priority metros and Tier 2/3 cities to capture consumption behavior, unmet needs, and purchase drivers.
Complete Report Coverage
201+ detailed sections covering every aspect of the market
143
Assessment Sections
58
Strategy Sections
CHAPTER 11 - Our Approach
Research Methodology
Desk Research
- Saudi warehouse license and area records
- Logistics-center capacity and policy tracking
- Operator warehouse investment disclosure review
- E-commerce fulfillment and trade indicators
Primary Research
- Warehouse operations directors and managers
- Logistics park asset management executives
- Retail supply chain procurement heads
- Cold-chain and customs operations managers
Validation and Triangulation
- Triangulated 320 respondent observations
- Cross-checked operator capacity disclosures
- Reconciled occupancy with storage demand
- Validated rates against contract economics
CHAPTER 12 - FAQ
FAQs
Still have questions?
Our research team is here to help you find the right solution
CHAPTER 13 - Related Research
Explore Related Reports
Expand your market intelligence with complementary research across regions and adjacent markets.
Regional/Country ReportsRelated market analysis across key regions
Related market analysis across key regions
- Indonesia Warehousing Market Outlook to 2027
- Vietnam Warehousing Market Outlook to 2027
- Thailand Warehousing Market Outlook to 2027
- Malaysia Warehousing Market Outlook to 2027
- Philippines Warehousing Market Outlook to 2027
Adjacent ReportsRelated markets and complementary research
Related markets and complementary research
- Oman Cold Storage Market Size, Share & Forecast, By Storage Type, Temperature Range & End-Use Industry, 2026-2032
- Malaysia Temperature Controlled Logistics Market
- South Africa Warehouse Management Systems Market
- Bahrain inventory management software market report Size, Share, Growth Drivers, Trends, Opportunities & Forecast 2025–2030
- Saudi Arabia Supply Chain Automation Market
500+
Market Research Reports
50+
Countries Covered
15+
Industry Verticals