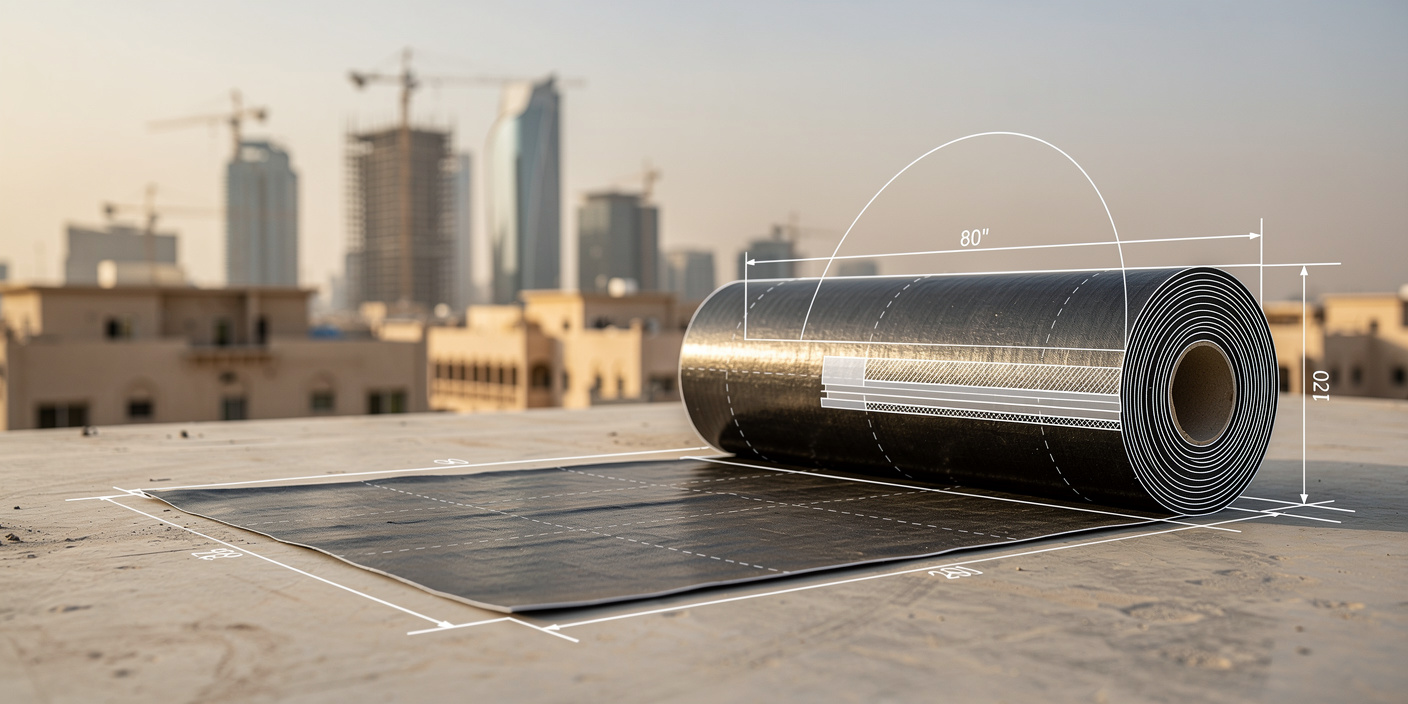
CHAPTER 1 - MARKET SUMMARY
Market Overview
The Saudi Arabia Waterproofing Chemicals Market operates through manufacturers, importers, project-specification teams, distributors, and certified applicators, with revenue recognized on material sales consumed inside Saudi Arabia. Demand reached an estimated 191.0 kilotonnes in 2025, led by roofs, basements, wet areas, and water-retaining structures. Commercial value depends on system durability, substrate preparation, warranty terms, and application productivity rather than commodity chemistry alone.
Demand is concentrated in the Central and Western regions, which together represented an estimated 67% of 2025 market value. Riyadh anchors large residential, commercial, and public-realm programs, while Jeddah, Makkah, Madinah, and Red Sea developments create high-specification hospitality and infrastructure requirements. Geographic concentration improves distributor economics but raises the importance of local technical support, approved applicator networks, and rapid site delivery.
Market Value
USD 288.7 million
2025
Dominant Region
Central Region
2025
Dominant Segment
Bituminous Membranes & Coatings
2025 largest
Total Number of Players
48
Future Outlook
The Saudi Arabia Waterproofing Chemicals Market is projected to expand from USD 288.7 million in 2025 to USD 464.8 million by 2031. The 2020-2025 historical CAGR of 7.19% reflected housing recovery, infrastructure execution, product price normalization, and wider specification of waterproofing as a lifecycle protection system. Forecast growth accelerates to 8.26% as Riyadh development, hospitality construction, water infrastructure, logistics assets, and industrial maintenance create a broader demand base. Volume growth remains the primary contributor, while modest price and mix improvement supports value expansion without assuming disruptive inflation.
Liquid-applied and spray-applied systems will capture the strongest incremental profit pool because they reduce seams, adapt to complex substrates, and shorten installation time on high-value projects. Bituminous products remain essential for mass roofing and foundations, but their share moderates as contractors adopt polyurethane, polyurea, and hybrid technologies. Competitive advantage will shift toward local technical service, specification influence, applicator training, project warranties, and Saudi-based manufacturing. Companies that combine approved products with execution assurance can improve win rates and reduce price-only competition, while import-only suppliers face longer lead times and higher working-capital exposure.
8.26%
Forecast CAGR
$464.8 Mn
2030 Projection
Base Year
2025
Historical Period
2020-2025
Forecast Period
2026-2031
Historical CAGR
7.19%
CHAPTER 2 - SCOPE OF REPORT
Scope of the Market
CHAPTER 3 - Key Stakeholders
Key Target Audience
Key stakeholders who can leverage from this market analysis for investment, strategy, and operational planning.
Investors
CAGR, localization upside, capex intensity, margin resilience, exits
Corporates
product mix, specification wins, procurement cost, channel productivity
Government
local content, compliance, asset durability, water resilience
Operators
application quality, warranty risk, inventory turns, utilization
Financial institutions
project finance, working capital, covenants, demand stability
CHAPTER 4 - Market Size & Growth
Market Size, Growth Forecast and Trends
This section evaluates the historical market size, analyzes year-over-year growth dynamics, and presents forecast projections supported by market performance indicators and demand-side drivers.
Historical & Projected Market Size ($ Million)
Year-over-Year Growth Rate (%)
Market Value vs Volume Growth (%)
Historical Market Performance (2020-2025)
Historical performance strengthened after the 2020 construction disruption, with the lowest annual expansion of 6.08% recorded in 2021 and the strongest increase of 7.87% in 2023. The inflection reflected accelerated residential handovers, renewed infrastructure execution, and higher specification of waterproofing in hospitality and industrial projects. Volume expanded from 146.0 kilotonnes in 2020 to 191.0 kilotonnes in 2025, while average selling price increased from USD 1,397 to USD 1,512 per tonne. Demand remained concentrated in Central and Western Saudi Arabia, where project density supported distributor scale and applicator utilization.
Forecast Market Outlook (2026-2031)
Forecast growth is expected to remain above 8% annually as the market broadens beyond new-build roofing into basements, water infrastructure, transport assets, podium decks, and industrial maintenance. The terminal 2031 value of USD 464.8 million assumes volume reaches 277.5 kilotonnes and average selling price rises to USD 1,675 per tonne. Growth accelerates modestly from 8.11% in 2026 to 8.47% in 2031 as liquid-applied and spray-applied systems gain mix share. Localization, specification support, and applicator quality will determine which suppliers convert the construction pipeline into recurring, defendable profit pools.
CHAPTER 5 - Market Data
Market Breakdown
The Saudi Arabia Waterproofing Chemicals Market combines steady construction-volume expansion with a measurable shift toward premium liquid-applied and spray-applied technologies. For CEOs and investors, the central issue is not only category growth but the migration of revenue toward systems that bundle chemistry, application speed, technical support, and warranty assurance.
Year | Market Size (USD Mn) | YoY Growth (%) | Market Volume (Kilotonnes) | Average Selling Price (USD/Tonne) | Liquid-Applied Systems Share (%) | Period |
|---|---|---|---|---|---|---|
| 2020 | $204.0 Mn | +- | 146.0 | 1397 | Forecast | |
| 2021 | $216.4 Mn | +6.08% | 153.0 | 1414 | Forecast | |
| 2022 | $232.5 Mn | +7.44% | 163.0 | 1426 | Forecast | |
| 2023 | $250.8 Mn | +7.87% | 174.0 | 1441 | Forecast | |
| 2024 | $269.2 Mn | +7.34% | 182.5 | 1475 | Forecast | |
| 2025 | $288.7 Mn | +7.24% | 191.0 | 1512 | Forecast | |
| 2026 | $312.1 Mn | +8.11% | 203.0 | 1537 | Forecast | |
| 2027 | $337.8 Mn | +8.23% | 216.5 | 1560 | Forecast | |
| 2028 | $365.8 Mn | +8.29% | 231.0 | 1584 | Forecast | |
| 2029 | $395.7 Mn | +8.17% | 246.0 | 1609 | Forecast | |
| 2030 | $428.5 Mn | +8.29% | 261.5 | 1639 | Forecast | |
| 2031 | $464.8 Mn | +8.47% | 277.5 | 1675 | Forecast |
Market Volume
191.0 kilotonnes, 2025, Saudi Arabia. Volume growth determines local plant loading, distributor inventory turns, and applicator utilization. Saudi family homeownership reached 66.24% in 2025, sustaining a large residential construction and maintenance base.
Average Selling Price
USD 1,512 per tonne, 2025, Saudi Arabia. Mix improvement is more important than headline inflation because high-performance liquid systems carry greater technical-service content. Construction input costs increased 1.0% year-on-year in October 2025.
Liquid-Applied Systems Share
31.5%, 2025, Saudi Arabia. Rising share favors suppliers with formulation capability, spray equipment support, and approved applicators. The Red Sea destination plans 8,000 hotel rooms across 50 hotels by 2030, expanding demand for complex roof, podium, pool, and wet-area systems.
CHAPTER 6 - Segmentation
Market Segmentation Framework
Comprehensive analysis across key dimensions providing insights into market structure, consumer preferences, and distribution patterns.
No of Segments
7
Dominant Segment
Product Type
Fastest Growing Segment
Technology
Product Type
End-Use Industry
Application
Customer Type
Sales Channel
Technology
Geography
Key Segmentation Takeaways
Comprehensive analysis across all extracted segmentation dimensions providing insights into market structure, consumer preferences, and distribution patterns.
Product Type
Product economics remain anchored by bituminous membranes and coatings because they offer proven performance, broad contractor familiarity, and competitive installed cost for roofs and foundations. Liquid-applied membranes are the most strategically important Level-2 sub-segment, however, because polyurethane and hybrid systems command higher value per tonne, solve complex detailing, and create service-led differentiation through specification and application support.
Technology
Technology is the fastest-growing segmentation dimension as project owners prioritize seamless coverage, shorter curing cycles, lower maintenance, and compatibility with complex architectural forms. Spray-applied systems, particularly polyurea and polyurethane technologies, are gaining fastest within this axis. Suppliers need trained applicators, equipment availability, quality-control protocols, and credible warranties to convert technical performance into repeatable project wins.
CHAPTER 7 - Regional Analysis
Regional Analysis
Saudi Arabia ranks first among selected GCC waterproofing chemicals markets by 2025 value, supported by the region's largest construction base, a deep giga-project pipeline, and extensive water and industrial infrastructure. Its scale advantage is reinforced by local manufacturing, national conformity requirements, and a broader mix of residential, hospitality, transport, and utility demand.
Focus Country Ranking
1st
Focus Country Market Size
USD 288.7 Mn (2025)
Focus Country CAGR (2026-2031)
8.26%
Focus Country Ranking
1st
Focus Country Market Size
USD 288.7 Mn (2025)
Focus Country CAGR (2026-2031)
8.26%
Regional Analysis (Current Year)
Market Position
Saudi Arabia ranks first in the selected peer set at USD 288.7 million in 2025, reflecting a construction market exceeding USD 100 billion and unusually broad project diversity.
Growth Advantage
Saudi Arabia's 8.26% CAGR exceeds the UAE at 7.20% and Qatar at 6.80%, positioning the Kingdom as the GCC growth leader for specification-led waterproofing systems.
Competitive Strengths
Local manufacturing, 66.24% household homeownership, and an 8,000-room Red Sea hotel pipeline create diversified demand that reduces dependence on a single construction cycle.
CHAPTER 8 - INDUSTRY ANALYSIS
Growth Drivers, Market Challenges & Market Opportunities
Comprehensive analysis of key factors shaping the Saudi Arabia Waterproofing Chemicals Market, including growth catalysts, operational challenges, and emerging opportunities across production, distribution, and consumer segments.
Growth Drivers
Giga-Project and Event-Led Construction
- Expo 2030 and the 2034 FIFA World Cup require accelerated delivery of transport, hospitality, public-realm, and mixed-use assets, increasing demand for fast-curing membranes and specification support across large packages. Two global events, 2030-2034, Saudi Arabia.
- Red Sea Global's planned 50 hotels and 1,000 residential properties by 2030 expand high-value applications in roofs, podiums, pools, wet areas, marine-exposed structures, and utility corridors, benefiting suppliers with premium systems and approved applicators.
- Giga-project procurement increasingly rewards lifecycle performance, documented testing, and low-maintenance solutions, allowing manufacturers to monetize technical service and warranties rather than compete solely on price. More than USD 1 trillion modeled project pipeline, 2025, Saudi Arabia.
Housing Delivery and Asset Maintenance
- Higher ownership expands the installed base requiring roof recoating, bathroom refurbishment, tank protection, and leak remediation, creating recurring aftermarket revenue beyond new construction. 66.24% homeownership, 2025, Saudi Arabia.
- Issued building permits reached 7,584 in May 2025, illustrating the continuing flow of residential and non-residential projects that generate demand for membranes, coatings, primers, sealants, and cementitious systems.
- The construction market reached an estimated USD 101.4 billion in 2025, making even small increases in waterproofing intensity commercially material for manufacturers, distributors, and certified applicators.
Water, Utility and Industrial Asset Protection
- Desalination plants, reservoirs, pumping stations, and wastewater assets require chemical-resistant membranes and coatings, supporting premium systems with stronger adhesion and chloride resistance. 11.5 million m3/day capacity, SWCC.
- National desalinated water supply is targeted to approach 20 million m3/day by 2030, widening the addressable base for tank linings, below-grade protection, roof systems, and rehabilitation contracts.
- Petrochemical, refining, power, and logistics facilities require membranes able to tolerate heat, hydrocarbons, salts, and thermal cycling, favoring suppliers with tested systems and on-site technical service. 38% import dependence for high-performance systems, 2025 estimate, Saudi Arabia.
Market Challenges
Imported Polymer and Freight Exposure
- Polyurethane precursors, specialty resins, additives, and selected sheet membranes are sourced internationally, so currency-linked input costs and shipping volatility can compress distributor margins. 38% import dependence, 2025 estimate, Saudi Arabia.
- Long lead times increase safety-stock requirements and working capital, especially for project-specific colors, thicknesses, and certification packages. 90-120 day modeled replenishment cycle, 2025, imported premium systems.
- Import-only suppliers face tender risk when contractors demand immediate replacement material or batch continuity, creating an advantage for local formulators and membrane plants. 62% domestic supply share by volume, 2025 estimate, Saudi Arabia.
Application Quality and Warranty Risk
- Incorrect moisture testing, weak detailing, insufficient thickness, and unqualified applicators can cause failures even when certified products are used, shifting cost toward rework and claims. Four critical application control points, industry practice.
- Project schedules often compress curing and inspection windows, encouraging substitutions that reduce durability and expose developers to lifecycle costs. 51 goods and services tracked by the Construction Cost Index, 2025, Saudi Arabia.
- Suppliers must fund training, inspections, mock-ups, and documentation to protect warranties, increasing selling expense but improving long-term customer retention. 48 active market participants, 2025 estimate, Saudi Arabia.
Project Phasing and Construction Volatility
- Government and developer reprioritization can delay waterproofing packages late in the construction cycle, creating uneven distributor sell-out and contractor utilization. 5,056 permits in May 2026.
- Large projects may be rephased rather than cancelled, requiring suppliers to manage inventory and credit without losing specification positions. 25.7% month-on-month permit decline, May 2026, Saudi Arabia.
- Payment timing and contractor liquidity affect product choice, increasing pressure for extended credit and lower-cost alternatives. 1.0% annual construction cost inflation, October 2025, Saudi Arabia.
Market Opportunities
Localized Low-VOC Liquid Membrane Manufacturing
- USD 169.7 million projected liquid-applied revenue pool by 2031 supports local formulation of polyurethane, acrylic, and hybrid systems with faster lead times and better customization.
- Manufacturers, private-equity investors, distributors, and applicator networks benefit from higher gross margin, local-content credentials, and reduced freight exposure. 38% import dependence, 2025 estimate, premium systems.
- The opportunity requires resin sourcing agreements, climate-specific testing, SASO conformity, and trained applicators. 2023 base year for national construction input monitoring reinforces the need for transparent local cost structures.
Water Infrastructure Protection Platforms
- Suppliers can monetize system bundles covering tank linings, below-grade membranes, joint protection, protective coatings, and inspection services. 11.5 million m3/day existing capacity benchmark, SWCC.
- Water authorities, PPP developers, EPC contractors, and maintenance operators benefit from lower leakage, reduced shutdown risk, and longer rehabilitation intervals. 8.5 million m3/day potential capacity addition to 2030.
- Commercialization requires potable-water approvals, chemical-resistance testing, long-duration warranties, and specialist applicators. 100% traceable batch documentation required on major modeled utility tenders.
Lifecycle Refurbishment and Warranty Services
- Manufacturers can build recurring revenue through inspection, recoating, leak diagnostics, maintenance contracts, and extended warranties rather than relying only on new-build product sales. 191.0 kilotonnes annual market volume, 2025.
- Developers, facility managers, homeowners, insurers, and lenders benefit from lower defect risk and better asset-value preservation. 1.0% residential construction cost inflation, October 2025.
- The opportunity requires digital asset records, certified applicators, standardized inspection protocols, and warranty reserves. 48 active market participants, 2025 estimate creates scope for consolidation around quality-assured service platforms.
CHAPTER 9 - Competitive Landscape
Competitive Landscape Overview
The market is moderately concentrated, with the top ten suppliers representing an estimated 81.4% of 2025 value. Competition combines global system brands, GCC manufacturers, and Saudi producers, while entry barriers center on approvals, formulation performance, applicator capability, project references, local inventory, and warranty credibility.
Market Share Distribution
Top 5 Players
Market Dynamics
8 new entrants in the past 5 years, indicating strong market attractiveness and growth potential.
Company Name | Market Share | Headquarters | Founding Year | Core Market Focus |
|---|---|---|---|---|
Sika Saudi Arabia | 15.5% (estimated) | Baar, Switzerland | 1910 | Integrated waterproofing membranes, coatings and construction chemicals |
Fosroc Saudi Arabia | 13.2% (estimated) | Dubai, United Arab Emirates | - | Waterproofing, concrete repair, sealants and protective coatings |
Henkel Polybit | 10.8% (estimated) | Umm Al Quwain, United Arab Emirates | 1995 | Bituminous membranes, polyurethane and construction chemical systems |
Arabian Waterproofing Industries Co. (Awazel) | 8.9% (estimated) | Riyadh, Saudi Arabia | 1981 | Locally manufactured bituminous waterproofing membranes |
Saudi Insulation Factory Company | 7.6% (estimated) | Riyadh, Saudi Arabia | - | Waterproofing membranes and insulation products |
Mapei Saudi Arabia | 6.8% (estimated) | Milan, Italy | 1937 | Liquid membranes, cementitious systems and building chemicals |
DCP Saudi Arabia | 5.7% (estimated) | Amman, Jordan | 1927 | Waterproofing, protective coatings and construction chemicals |
Saveto | 4.9% (estimated) | Riyadh, Saudi Arabia | 1981 | Cementitious waterproofing, mortars and finishing systems |
Jazeera Paints | 4.2% (estimated) | Khamis Mushait, Saudi Arabia | 1979 | Protective coatings, roof coatings and liquid waterproofing |
Bitumat Company Limited | 3.8% (estimated) | Dammam, Saudi Arabia | - | Bituminous membranes and roofing systems |
Cross Comparison Parameters
The report provides detailed cross-comparison of key players across 10 performance parameters to identify competitive strengths and weaknesses.
Certified Waterproofing Capacity
Project Specification Win Rate
Saudi Waterproofing Revenue Growth
Gross Margin
Analysis Covered
Market Share Analysis:
Quantifies supplier concentration, scale advantages, and competitive positioning by revenue.
Cross Comparison Matrix:
Benchmarks technical capacity, specification wins, growth, and profitability across competitors.
SWOT Analysis:
Assesses company strengths, vulnerabilities, market openings, and execution threats systematically.
Pricing Strategy Analysis:
Compares value pricing, distributor discounts, tender behavior, and warranty premiums.
Company Profiles:
Summarizes ownership, footprint, product focus, channels, and strategic priorities.
CHAPTER 10 - REPORT TOC
CHAPTER 14 - Table Of Contents
Phase 1Market Assessment Phase
11
Chapters
Supply-side and competitive intelligence covering market sizing, segmentation, competitive dynamics, regulatory landscape, and future forecasts.
Phase 2Go-To-Market Strategy Phase
15
Chapters
Entry strategy evaluation, execution roadmap, partner recommendations, and profitability outlook.
Complete Report Coverage
201+ detailed sections covering every aspect of the market
143
Assessment Sections
58
Strategy Sections
CHAPTER 11 - Our Approach
Research Methodology
Desk Research
- Mapped Saudi waterproofing product taxonomy
- Reviewed construction and housing indicators
- Analyzed membrane and chemical trade
- Screened regulations and company portfolios
Primary Research
- Interviewed waterproofing product managers
- Consulted project specification engineers
- Surveyed approved waterproofing applicators
- Engaged developer procurement directors
Validation and Triangulation
- Validated findings across 285 respondents
- Reconciled manufacturer and channel sales
- Cross-checked volume and price assumptions
- Tested project pipeline conversion rates
CHAPTER 12 - FAQ
FAQs
Still have questions?
Our research team is here to help you find the right solution
CHAPTER 13 - Related Research
Explore Related Reports
Expand your market intelligence with complementary research across regions and adjacent markets.
Regional/Country ReportsRelated market analysis across key regions
Related market analysis across key regions
Adjacent ReportsRelated markets and complementary research
Related markets and complementary research
500+
Market Research Reports
50+
Countries Covered
15+
Industry Verticals