CHAPTER 1 - MARKET SUMMARY
Market Overview
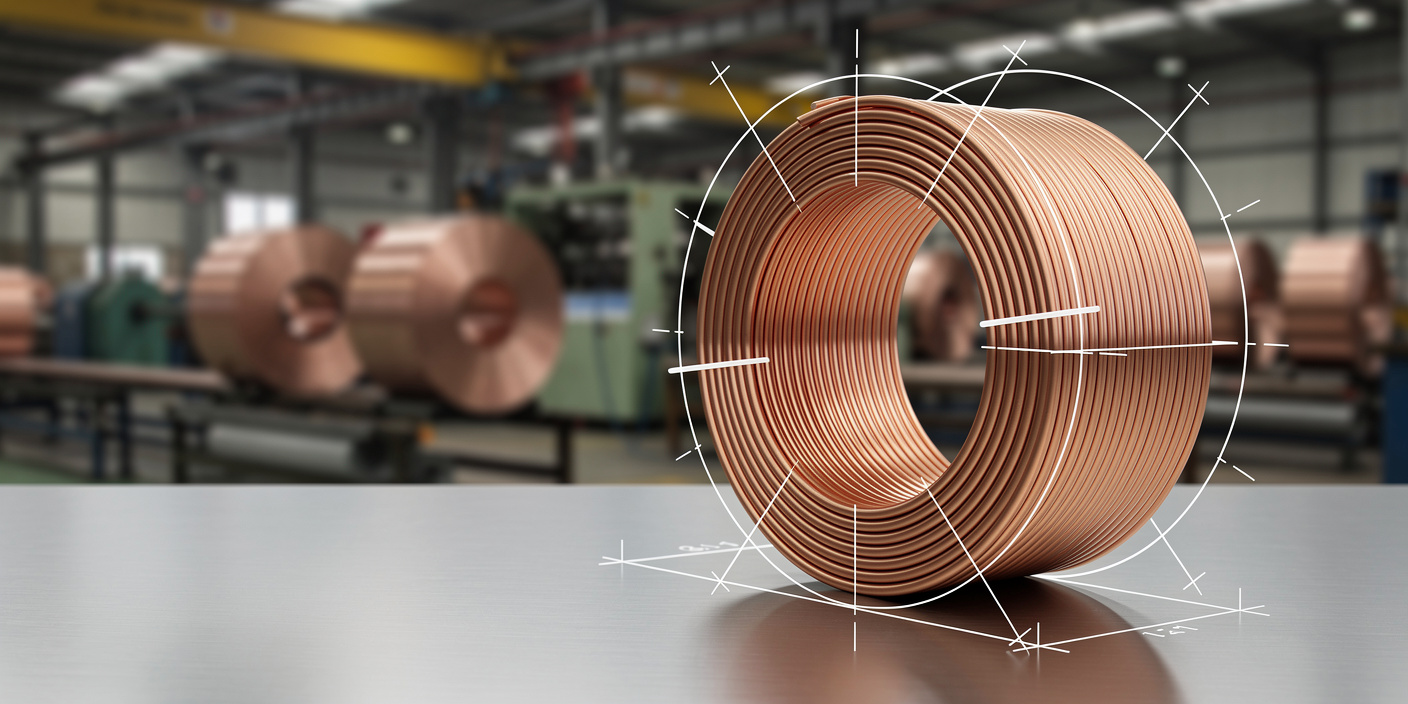
The Global Seamless Copper Tubes Market Size, Share & Forecast, By Product Type & End Use, 2026-2031 operates through integrated copper processors, specialist tube mills, distributors, and OEM procurement programs. Demand is anchored in HVACR, plumbing, heat exchange, medical gas, and thermal-management systems. Global space-cooling energy demand is expected to rise by almost 4% annually through 2035, making refrigerant-line performance, wall-thickness optimization, and leak integrity central commercial requirements.
Asia-Pacific is the principal production and consumption hub, accounting for an estimated 58.0% of 2025 market value and about 64% of manufacturing capacity. China, Japan, South Korea, Malaysia, and India combine large HVAC manufacturing bases with established extrusion, drawing, annealing, and inner-grooving capabilities. This concentration improves scale economics but increases exposure to regional energy costs, trade controls, and logistics disruptions.
Market Value
USD 26.25 billion
2025
Dominant Region
Asia-Pacific
2025
Dominant Segment
HVACR Tubes
fastest growing, 2026-2031
Total Number of Players
190
2025
Future Outlook
The Global Seamless Copper Tubes Market Size, Share & Forecast, By Product Type & End Use, 2026-2031 is projected to increase from USD 26.25 billion in 2025 to USD 38.09 billion by 2031. The model implies a forecast CAGR of 6.4%, above the 5.1% historical CAGR recorded during 2020-2025. Growth shifts from metal-price-led expansion toward a broader combination of tube-volume gains, higher-value internally enhanced products, regional manufacturing localization, and qualification for lower-GWP refrigerants. HVACR remains the primary demand pool, while industrial heat exchangers, medical gas systems, and automotive thermal management provide smaller but higher-specification profit pools.
Forecast value growth exceeds volume growth because average selling prices are expected to rise from about USD 9,442 per tonne in 2025 to USD 10,379 per tonne in 2031. The spread reflects copper input inflation, thinner-wall engineering premiums, stricter cleanliness and pressure-testing requirements, and a larger share of inner-grooved and alloyed tubes. The base case assumes no prolonged global construction recession, orderly refrigerant transitions, and adequate refined copper availability. The 2031 confidence band ranges from USD 34.1 billion to USD 42.3 billion, with copper pricing and HVAC equipment output creating the widest uncertainty.
6.4%
Forecast CAGR
$38,090 Mn
2030 Projection
Base Year
2025
Historical Period
2020-2025
Forecast Period
2026-2031
Historical CAGR
5.1%
CHAPTER 2 - SCOPE OF REPORT
Scope of the Market
CHAPTER 3 - Key Stakeholders
Key Target Audience
Key stakeholders who can leverage from this market analysis for investment, strategy, and operational planning.
Investors
CAGR, capacity utilization, copper exposure, margins, consolidation risk
Corporates
procurement indexation, tube yield, qualification, supplier resilience, pricing
Government
localization, trade exposure, recycling, standards, industrial competitiveness, employment
Operators
drawing efficiency, grooving yield, scrap recovery, quality, throughput
Financial institutions
working capital, commodity hedging, covenants, demand stability, capex
CHAPTER 4 - Market Size & Growth
Market Size, Growth Forecast and Trends
This section evaluates the historical market size, analyzes year-over-year growth dynamics, and presents forecast projections supported by market performance indicators and demand-side drivers.
Historical & Projected Market Size ($ Million)
Year-over-Year Growth Rate (%)
Market Value vs Volume Growth (%)
Historical Market Performance (2020-2025)
Historical performance was shaped by a sharp 2021 value rebound of 16.17%, followed by 6.35% growth in 2022 as copper input costs remained elevated. The 2023 trough produced a 3.20% contraction even though estimated volume increased 1.96%, indicating price and mix normalization rather than structural demand destruction. Growth returned to 3.06% in 2024 and 4.04% in 2025. HVACR application share rose from 42.5% in 2020 to 46.0% in 2025, concentrating demand in equipment replacement, cooling access, and refrigeration investment.
Forecast Market Outlook (2026-2031)
Forecast growth accelerates to a 6.40% CAGR, taking market value to USD 38.09 billion in 2031. Volume reaches 3.67 million tonnes, representing a 4.74% CAGR, while the balance of value growth comes from an estimated 1.57% annual increase in average selling price and richer product mix. Annual value growth remains between 6.10% and 6.57%, avoiding reliance on a single spike year. Internally enhanced HVACR tubes, copper-iron thin-wall formats, and localized manufacturing programs create the main premium-growth channels through the terminal forecast year.
CHAPTER 5 - Market Data
Market Breakdown
The Global Seamless Copper Tubes Market Size, Share & Forecast, By Product Type & End Use, 2026-2031 combines commodity-linked value exposure with specification-driven premiums. For CEOs and investors, the key distinction is whether growth comes from physical tube demand, copper pass-through, or migration toward higher-value enhanced tubing.
Year | Market Size (USD Mn) | YoY Growth (%) | Volume (Mn Tonnes) | Average Selling Price (USD/Tonne) | HVACR Application Share (%) | Period |
|---|---|---|---|---|---|---|
| 2020 | $20,470 Mn | +- | 2.42 | 8,459 | Forecast | |
| 2021 | $23,780 Mn | +16.17 | 2.50 | 9,512 | Forecast | |
| 2022 | $25,290 Mn | +6.35 | 2.55 | 9,918 | Forecast | |
| 2023 | $24,480 Mn | +-3.20 | 2.60 | 9,415 | Forecast | |
| 2024 | $25,230 Mn | +3.06 | 2.70 | 9,344 | Forecast | |
| 2025 | $26,250 Mn | +4.04 | 2.78 | 9,442 | Forecast | |
| 2026 | $27,850 Mn | +6.10 | 2.91 | 9,570 | Forecast | |
| 2027 | $29,680 Mn | +6.57 | 3.05 | 9,731 | Forecast | |
| 2028 | $31,620 Mn | +6.54 | 3.19 | 9,912 | Forecast | |
| 2029 | $33,650 Mn | +6.42 | 3.34 | 10,075 | Forecast | |
| 2030 | $35,810 Mn | +6.42 | 3.50 | 10,231 | Forecast | |
| 2031 | $38,090 Mn | +6.37 | 3.67 | 10,379 | Forecast |
Volume
2.78 million tonnes, 2025, global. Volume establishes the underlying capacity requirement and limits the risk of mistaking copper-price inflation for structural growth. World refined copper use was about 27.6 million tonnes in 2025, placing seamless tube demand near one-tenth of refined use.
Average Selling Price
USD 9,442 per tonne, 2025, global. The metric governs working capital, contract indexation, and gross-margin volatility. Mueller Industries reported COMEX copper averaging USD 5.13 per pound in the fourth quarter of 2025, 22% above the prior-year quarter.
HVACR Application Share
46.0%, 2025, global. HVACR exposure increases growth but concentrates earnings around equipment cycles and refrigerant transitions. Space cooling is projected to remain the fastest-growing building energy use, rising almost 4% annually through 2035.
CHAPTER 6 - Segmentation
Market Segmentation Framework
Comprehensive analysis across key dimensions providing insights into market structure, consumer preferences, and distribution patterns.
No of Segments
7
Dominant Segment
Application
Fastest Growing Segment
Technology
Product Type
End-Use Industry
Application
Customer Type
Sales Channel
Technology
Geography
Key Segmentation Takeaways
Comprehensive analysis across all extracted segmentation dimensions providing insights into market structure, consumer preferences, and distribution patterns.
Application
Refrigerant lines form the largest commercially addressable use case because every split, packaged, commercial, and refrigeration system requires pressure-rated tubing between compressors, heat exchangers, and expansion devices. Potable-water distribution remains a stable second pool, but HVACR applications generate greater product differentiation through cleanliness, coil geometry, inner grooving, pressure capability, and refrigerant compatibility.
Technology
Internally enhanced tubes are the fastest-growing technology group as OEMs pursue higher heat-transfer coefficients, smaller refrigerant charges, and more compact coils. Thin-wall high-strength copper-iron formats also gain relevance where lower material intensity can offset copper inflation. Growth therefore shifts profit pools from standard commodity tube toward proprietary groove geometry, precision wall control, qualification support, and joint engineering with equipment manufacturers.
CHAPTER 7 - Regional Analysis
Regional Analysis
Asia-Pacific leads the Global Seamless Copper Tubes Market Size, Share & Forecast, By Product Type & End Use, 2026-2031 through a combination of large HVAC equipment output, dense copper-processing capacity, and expanding urban infrastructure. Europe and North America retain premium demand in regulated plumbing, heat pumps, medical gas, and high-efficiency heat exchange, while emerging regions show faster but smaller-volume expansion.
Regional Ranking
1st
Asia-Pacific Market Size (2025)
USD 15.23 Bn
Asia-Pacific CAGR (2026-2031)
7.1%
Regional Ranking
1st
Asia-Pacific Market Size (2025)
USD 15.23 Bn
Asia-Pacific CAGR (2026-2031)
7.1%
Regional Analysis (Current Year)
Regional Analysis Comparison
Market Position
Asia-Pacific ranks first with USD 15.23 billion in 2025 market value, supported by an estimated 64% of global tube-making capacity and the world’s largest HVAC manufacturing clusters.
Growth Advantage
Asia-Pacific’s 7.1% forecast CAGR exceeds North America’s 5.8% and Europe’s 4.8%, positioning the region as the primary volume-growth and capacity-localization market through 2031.
Competitive Strengths
The region combines 1.61 million tonnes of 2025 demand, extensive inner-grooving capacity, and fast localization programs, including India’s new copper-tube ventures linked to HVACR and smart construction.
CHAPTER 8 - INDUSTRY ANALYSIS
Growth Drivers, Market Challenges, Market Opportunities, Growth Driver Framework & Scenario Projections
Comprehensive analysis of key factors shaping the Global Seamless Copper Tubes Market Size, Share & Forecast, By Product Type & End Use, 2026-2031, including growth catalysts, operational challenges, and emerging opportunities across production, distribution, and consumer segments.
Growth Drivers
Expansion of Cooling and Refrigeration Demand
- The global stock of building air conditioners could reach 5.6 billion units by 2050 (2018, IEA/global), creating recurring OEM, replacement, and service demand for line sets, coils, and internally enhanced tubes.
- Cooling electricity use could more than triple without stronger efficiency measures, so equipment makers increasingly value tube geometries that improve heat transfer and reduce refrigerant charge, supporting higher specification margins. The baseline increase exceeds threefold by 2050 (2018, IEA/global).
- HVACR accounts for an estimated 46.0% of seamless tube value in 2025 (2025, model/global), giving copper tube producers direct exposure to residential cooling, food refrigeration, cold storage, heat pumps, and data-center thermal systems.
Urban Infrastructure and Plumbing Replacement
- Urban population growth could add 2.5 billion people by 2050 (2018, UN/global), with nearly 90% of the increase in Asia and Africa, shifting incremental plumbing and cooling demand toward emerging markets.
- North America had an urbanization rate of 82% in 2018 (2018, UN/North America), making replacement, renovation, and code-compliant retrofits more important than greenfield additions, which favors distributors and established tube-and-fitting systems.
- Potable-water and plumbing applications represent an estimated 27% of 2025 market value (2025, model/global), providing a lower-growth but more defensive revenue base than cyclical HVAC equipment demand.
Efficiency Standards and Refrigerant Transition
- The regulation covers refrigeration, air-conditioning, and heat-pump equipment, pushing OEMs toward lower-GWP refrigerants and components capable of handling different pressures, flammability classes, and cleanliness requirements. Its implementation began in 2024 (2024, EU/Europe).
- ASTM maintains more than 20 active pipe-and-tube standards across seamless copper applications (2026, ASTM/global reference), supporting qualification-based differentiation in water, refrigeration, medical gas, condenser, and pressure-service markets.
- Technology-led products are projected to increase HVACR application share from 46.0% in 2025 to 50.5% in 2031 (2025-2031, model/global), concentrating value creation in inner-grooved and thin-wall high-strength tubes.
Market Challenges
Copper Price Volatility and Working-Capital Exposure
- The Q4 2025 copper average was 22% above the prior-year quarter (2025, Mueller/United States), increasing inventory financing and customer-credit exposure even where metal pass-through clauses protect nominal gross profit.
- Copper traded above USD 11,000 per tonne in May 2024 (2024, LME/global), demonstrating how price spikes can inflate reported market value without equivalent physical volume growth and can accelerate material substitution.
- The 2025 model ASP of USD 9,442 per tonne (2025, model/global) includes metal plus conversion value; suppliers with weak indexation or long payment cycles face margin compression and higher borrowing requirements.
Substitution and Material-Intensity Reduction
- Aluminum micro-channel systems compete in selected condensers, forcing copper suppliers to defend total lifecycle value through repairability, corrosion behavior, heat-transfer performance, and installed service networks rather than metal price alone. HVACR remains 46.0% of market value in 2025 (2025, model/global).
- Thin-wall high-strength tubes reduce copper kilograms per unit, so shipment length can grow faster than tonnage. The forecast assumes only 1.6% annual ASP expansion from 2025 to 2031 (2025-2031, model/global), limiting nominal upside from mix.
- Customer qualification cycles can delay adoption of new alloys and groove profiles, particularly in pressure-bearing systems. More than 20 ASTM tube standards were active or listed by 2026 (2026, ASTM/global reference), reflecting fragmented performance requirements.
Trade Barriers and Regional Supply Fragmentation
- The tariff scope covered an estimated 400,000-500,000 tonnes of copper products annually (2025, Reuters/United States), raising incentives for regional tube drawing and finishing while disrupting established sourcing routes.
- Asia-Pacific holds an estimated 64% of global tube-making capacity in 2025 (2025, model/global), so policy restrictions affecting Chinese and regional exports can create temporary shortages in importing markets.
- Local content requirements and divergent product standards increase duplicate tooling, inventory, and certification costs. North America and Europe together represent 35.0% of 2025 market value (2025, model/global), making compliance fragmentation economically material.
Market Opportunities
Localized Tube Capacity in High-Growth Markets
- integrated smelting and tube conversion can capture metal margin, conversion premium, and logistics savings. Adani’s related smelter investment was reported at USD 1.2 billion in 2025 (2025, Reuters/India).
- domestic HVAC OEMs, construction buyers, and exporters gain shorter lead times and reduced foreign-exchange exposure. MetTube’s Indian plant was commissioned in 2024 (2024, company/India).
- local ecosystems need consistent cathode quality, skilled drawing operations, testing laboratories, and OEM qualification. Asia excluding China could exceed 9.2 million tonnes of copper demand by 2030 (2030, BMI/Asia).
Premium Inner-Grooved and Low-GWP-Compatible Tubes
- proprietary groove geometry, cleanliness, and pressure qualification support premium conversion margins above commodity smooth-bore tubes. Inner-grooved products represent an estimated 34% of 2025 value (2025, model/global).
- HVAC OEMs reduce coil size and refrigerant charge, while tube suppliers deepen design-in relationships and switching costs. Space-cooling demand rises by almost 4% annually through 2035 (2025, IEA/global).
- suppliers need alloy, joining, flammability, and pressure-validation capabilities aligned with refrigerant transitions. Regulation (EU) 2024/573 took effect on 11 March 2024 (2024, EU/Europe).
Closed-Loop Copper and Low-Carbon Procurement
- segregated clean scrap from tube mills can be recycled into high-quality feedstock, reducing metal losses and enabling recycled-content premiums. ICSG operates an annual recyclables survey and recycling input-rate framework in 2025 (2025, ICSG/global).
- integrated fabricators, HVAC OEMs, and building-product buyers gain traceability and lower embedded-carbon exposure. Wieland markets copper tubes using 100% recycled material under its Cuprolife initiative in 2025 (2025, company/Europe).
- buyers need mass-balance rules, scrap segregation, verified emissions factors, and long-term offtake contracts. The model’s bull case reaches USD 42.3 billion by 2031 (2031, model/global) when premium circular and enhanced products scale faster.
CHAPTER 9 - Competitive Landscape
Competitive Landscape Overview
The market is moderately fragmented: the top 10 manufacturers represent an estimated 47.9% of 2025 value. Entry barriers include copper working capital, precision drawing and grooving know-how, OEM qualification, global distribution, and compliance with application-specific pressure, cleanliness, and dimensional standards.
Market Share Distribution
Top 5 Players
Market Dynamics
8 new entrants in the past 5 years, indicating strong market attractiveness and growth potential.
Company Name | Market Share | Headquarters | Founding Year | Core Market Focus |
|---|---|---|---|---|
Zhejiang Hailiang Co., Ltd. | 10.5% (estimated, 2025) | Zhuji, China | 1989 | Large-scale smooth, grooved, and precision copper tubes for HVACR and industrial customers |
Wieland Group | 8.0% (estimated, 2025) | Ulm, Germany | 1820 | High-performance copper tubes, inner-grooved products, heat-exchanger solutions, and circular copper |
Mueller Industries, Inc. | 6.8% (estimated, 2025) | Collierville, United States | 1917 | Plumbing tube, HVACR line sets, fittings, engineered tube, and regional distribution |
Golden Dragon Precise Copper Tube Group Inc. | 6.3% (estimated, 2025) | Chongqing, China | 2000 | Precision copper tubing for air-conditioning, refrigeration, and multinational OEM supply |
KME Group S.p.A. | 4.2% (estimated, 2025) | Milan, Italy | - | European copper tubes, industrial semi-finished products, and engineered copper applications |
Luvata | 3.4% (estimated, 2025) | Pori, Finland | 1910 | Technically demanding copper tubes and engineered products for HVACR, healthcare, and electrification |
Kobelco & Materials Copper Tube Co., Ltd. | 3.0% (estimated, 2025) | Tokyo, Japan | 2004 | High-quality copper tubes for air-conditioning, refrigeration, heat exchangers, and industrial systems |
MetTube | 2.5% (estimated, 2025) | Selangor, Malaysia | 1991 | Integrated copper tube manufacturing focused on HVACR coils, straight lengths, and regional exports |
Ningbo Jintian Copper (Group) Co., Ltd. | 2.4% (estimated, 2025) | Ningbo, China | 1986 | Copper processing, precision tubes, alloy products, and industrial customer supply |
Maksal Tubes (Pty) Ltd. | 0.8% (estimated, 2025) | Springs, South Africa | - | African copper tubing, extrusions, profiles, plumbing, and HVACR applications |
Cross Comparison Parameters
The report provides detailed cross-comparison of key players across 10 performance parameters to identify competitive strengths and weaknesses.
Annual Tube Production Capacity
Inner-Grooved Tube Yield Rate
Sector-Specific Revenue Growth
EBITDA Margin
Analysis Covered
Market Share Analysis:
Quantifies estimated revenue concentration across leading seamless tube manufacturers globally.
Cross Comparison Matrix:
Benchmarks capacity, product mix, profitability, and conversion economics across competitors.
SWOT Analysis:
Evaluates strategic advantages, vulnerabilities, expansion options, and external competitive threats.
Pricing Strategy Analysis:
Assesses metal pass-through, conversion premiums, contracts, discounts, and regional pricing.
Company Profiles:
Reviews footprint, product focus, customer exposure, capabilities, and strategic priorities.
CHAPTER 10 - REPORT TOC
CHAPTER 14 - Table Of Contents
Phase 1Market Assessment Phase
11
Chapters
Supply-side and competitive intelligence covering market sizing, segmentation, competitive dynamics, regulatory landscape, and future forecasts.
Phase 2Go-To-Market Strategy Phase
15
Chapters
Entry strategy evaluation, execution roadmap, partner recommendations, and profitability outlook.
Complete Report Coverage
201+ detailed sections covering every aspect of the market
143
Assessment Sections
58
Strategy Sections
CHAPTER 11 - Our Approach
Research Methodology
Desk Research
- Reviewed global copper semis statistics
- Mapped seamless tube trade flows
- Analyzed HVACR and plumbing demand
- Examined tube standards and filings
Primary Research
- Interviewed copper tube plant directors
- Consulted HVAC procurement vice presidents
- Engaged plumbing distribution category managers
- Validated assumptions with metallurgical engineers
Validation and Triangulation
- Completed 318 stakeholder interviews globally
- Cross-checked value and volume estimates
- Reconciled company and trade benchmarks
- Stress-tested copper price pass-through
CHAPTER 12 - FAQ
FAQs
Still have questions?
Our research team is here to help you find the right solution
CHAPTER 13 - Related Research
Explore Related Reports
Expand your market intelligence with complementary research across regions and adjacent markets.
Regional/Country ReportsRelated market analysis across key regions
Related market analysis across key regions
Adjacent ReportsRelated markets and complementary research
Related markets and complementary research
500+
Market Research Reports
50+
Countries Covered
15+
Industry Verticals