CHAPTER 1 - MARKET SUMMARY
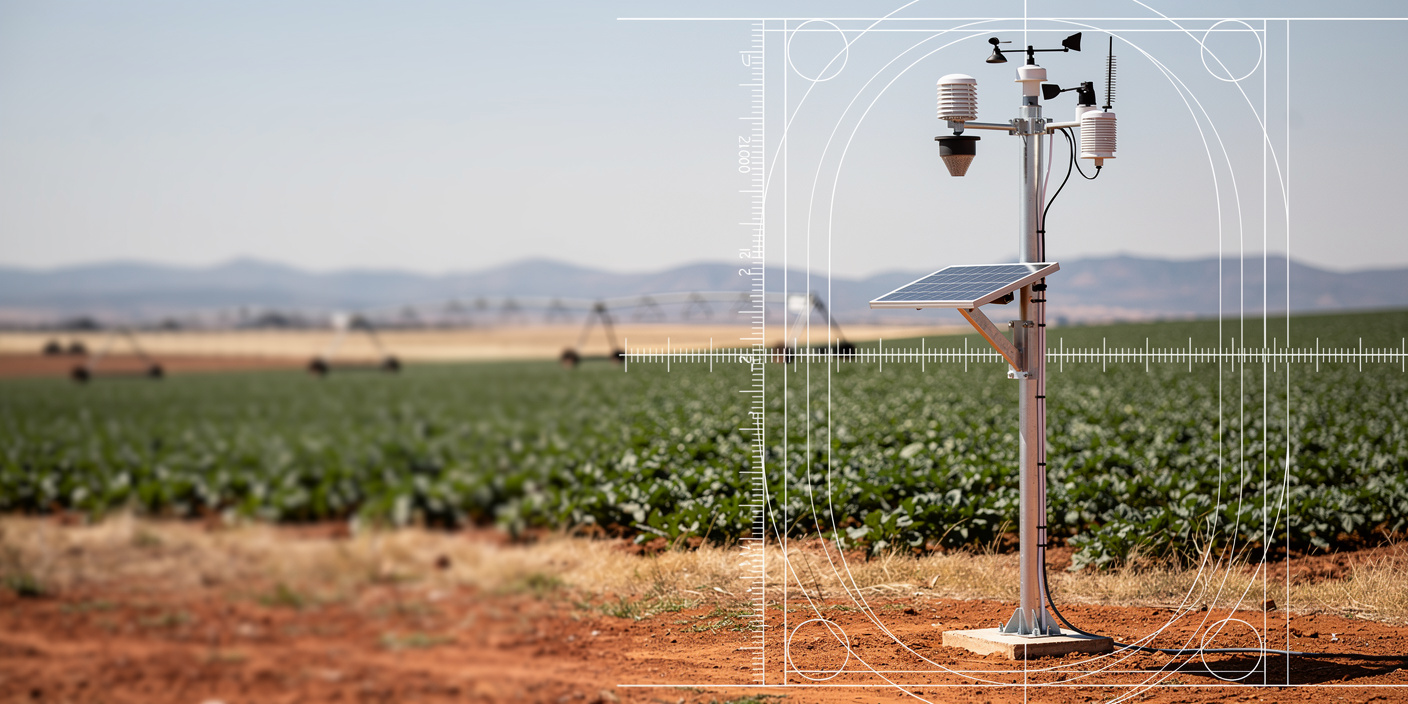
South Africa Smart Farming with IoT Market Overview
The South Africa Smart Farming with IoT Market serves a commercial agriculture industry that earned approximately USD 29.2 billion in 2024. Large agricultural enterprises generated 65.8% of sector income, creating a concentrated buyer base capable of funding integrated sensing, automation, telematics, and analytics deployments. Demand is strongest where technology can protect crop value, reduce input variance, improve asset utilization, and support auditable production decisions.
Western Cape represents the leading provincial demand cluster because orchards, vineyards, citrus farms, and export-oriented horticulture require intensive irrigation control, crop imaging, weather intelligence, and traceability. National agricultural capital expenditure reached approximately USD 2.93 billion in 2024, including USD 1.72 billion for vehicles, machinery, tractors, plant, and equipment. This investment pool creates a practical channel for bundling connectivity and precision-agriculture capabilities with asset purchases.
Market Value
USD 1.2 billion
2025
Dominant Region
Western Cape
2025
Dominant Segment
Product Type, led by Field Sensors and Monitoring Devices
2025
Total Number of Players
85
Future Outlook
The South Africa Smart Farming with IoT Market is projected to expand from USD 1.2 billion in 2025 to USD 2.74 billion by 2031. Forecast growth reflects an 11.2% annual increase in active connected farm-equivalent installations and approximately 3.2% annual uplift from software mix, analytics intensity, service contracts, and higher-value automation. Precision irrigation, machinery telematics, orchard analytics, livestock security, and integrated farm-management platforms will capture the largest incremental revenue pools.
Recurring software, connectivity, monitoring, and support revenue is expected to increase from 38% of market value in 2025 to 56% by 2031. Hardware will remain essential, but competitive advantage will shift toward vendors that translate sensor data into measurable water savings, lower chemical usage, reduced equipment downtime, improved yield forecasting, stronger biosecurity, and export-grade traceability. Deployment financing and interoperable subscription models will determine whether adoption extends beyond large commercial farms.
14.75%
Forecast CAGR
USD 2,739.7 Mn
2030 Projection
Base Year
2025
Historical Period
2020-2025
Forecast Period
2026-2031
Historical CAGR
11.87%
CHAPTER 2 - SCOPE OF REPORT
Scope of the Market
CHAPTER 4 - Market Size & Growth
Market Size and Growth Trajectory
This section evaluates the historical market size, analyzes year-over-year growth dynamics, and presents forecast projections supported by market performance indicators and demand-side drivers.
Historical & Projected Market Size ($ Million)
Year-over-Year Growth Rate (%)
Market Value vs Volume Growth (%)
Historical Market Performance
Market growth accelerated from 9.5% in 2021 to 14.2% in 2023 as machinery replacement, remote farm management, input-cost pressure, and post-pandemic digitization supported investment. Growth moderated to 11.4% in 2024 as farm margins and capital budgets normalized. Connected farm-equivalent installations increased from approximately 12,100 in 2020 to 18,900 in 2025, while recurring revenue expanded eleven percentage points as buyers adopted cloud dashboards, connectivity, data storage, analytics, and service agreements.
Forecast Market Outlook
Forecast growth will be driven by larger multi-device deployments and rising revenue per connected site. Active installations are projected to reach approximately 35,700 by 2031, equivalent to an 11.2% volume CAGR. Average annual supplier revenue per installation is expected to rise from about USD 63,500 in 2025 to USD 76,700 in 2031 as remote sensing, automation, AI analytics, cybersecurity, integration, and outcome-based agronomic services increase their share of expenditure.
CHAPTER 5 - Market Data
Market Structure and Ecosystem Analysis
Period | Market Development | Commercial Implication | ||||
|---|---|---|---|---|---|---|
| Before 2015 | $Standalone GPS guidance, basic telemetry, local weather stations, and proprietary irrigation controls Mn | +Technology purchases were hardware-led and operated in isolated systems | Forecast | |||
| 2015-2019 | $Cloud farm-management platforms, drone imagery, mobile agronomy applications, and remote equipment monitoring expanded Mn | +Data aggregation became a differentiator for large commercial farms | Forecast | |||
| 2020-2023 | $Remote management, connected sensors, digital records, and subscription services accelerated Mn | +Recurring software and connectivity became material revenue streams | Forecast | |||
| 2024-2025 | $AI image analytics, automated irrigation, multi-source dashboards, livestock tracking, and traceability integration advanced Mn | +Buyers increasingly evaluated measurable operational ROI rather than device specifications | Forecast | |||
| 2026-2031 | $Interoperable farm operating systems, outcome-based services, edge AI, satellite-cellular integration, and embedded finance scale Mn | +Platforms controlling decision workflows and data continuity capture higher lifetime value | Forecast |
CHAPTER 6 - Segmentation
Market Segmentation Framework
Comprehensive analysis across key dimensions providing insights into market structure, buyer preferences, application priorities, and distribution patterns.
No of Segments
7
Dominant Segment
Product Type
Fastest Growing Segment
Application
Product Type
Application
Customer Type
Crop Type
Farm Size
Distribution Channel
Geography
Key Segmentation Takeaways
Comprehensive analysis across all extracted segmentation dimensions provides insights into market structure, technology demand, buyer economics, use-case maturity, and route-to-market requirements.
Product Type
Product Type is the dominant dimension because most procurement begins with a physical monitoring, connectivity, control, or machinery requirement. Field Sensors and Monitoring Devices lead current spending, while Automated Control and Analytics Systems expand the value captured from installed devices. Vendors with integrated hardware, software, support, and agronomic workflows achieve stronger account penetration than single-device suppliers.
Application
Application is the fastest-growing dimension as buyers increasingly fund measurable operational outcomes rather than isolated technology categories. Livestock Monitoring and Security is projected to expand fastest, supported by animal health, theft prevention, breeding, location, and biosecurity requirements. Precision Irrigation remains the largest application because water scarcity creates an immediate, quantifiable savings case across high-value crops and irrigated production systems.
CHAPTER 7 - Regional Analysis
Regional and Peer Country Analysis
South Africa ranks as the largest addressable smart-farming-with-IoT market among the selected African peers. Its position reflects a comparatively large commercial-farming segment, strong equipment expenditure, sophisticated horticultural exports, domestic agritech capabilities, and national 4G/LTE population coverage of 99.5%. Market estimates below use a consistent broad-scope revenue definition and institutional demand indicators.
Focus Country Ranking
1st
Focus Country Market Size
USD 1,200 Mn (2025)
Focus Country CAGR
14.75% (2026-2031)
Focus Country Ranking
1st
Focus Country Market Size
USD 1,200 Mn (2025)
Focus Country CAGR
14.75% (2026-2031)
Regional and Peer Country Analysis (Current Year)
Market Position
South Africa ranks first in the peer set with USD 1.2 billion in modeled 2025 revenue, supported by concentrated commercial agriculture, USD 2.93 billion of sector capital expenditure, and high-value export production.
Growth Advantage
South Africa's 14.75% forecast CAGR trails Kenya and Nigeria but exceeds modeled growth in Egypt and Morocco, positioning the country as the peer group's leading scale market with mid-to-high growth.
Competitive Strengths
National 4G/LTE population coverage of 99.5%, USD 13.7 billion of agricultural exports, and established domestic agritech firms provide South Africa with stronger commercialization, service, and traceability foundations than most African peers.
CHAPTER 8 - INDUSTRY ANALYSIS
Growth Drivers, Challenges and Opportunities
Comprehensive analysis of key factors shaping the South Africa Smart Farming with IoT Market, including growth catalysts, operational challenges, and emerging opportunities across technology supply, distribution, and agricultural end-use segments.
Growth Drivers
Water Scarcity and Irrigation Efficiency
- Average losses across irrigation schemes are approximately 30% (2024, South Africa), creating an addressable savings pool for soil-moisture sensing, pressure monitoring, leak detection, automated valves, and irrigation scheduling. Vendors capture value where savings can be verified at block or scheme level.
- Drip systems can use up to 40% less water and energy than sprinklers (supplier benchmark), strengthening payback economics for integrated controllers, meters, fertigation systems, and remote-monitoring subscriptions in citrus and other permanent crops.
- Precision Irrigation and Fertigation represents an estimated 31% of 2025 market revenue, giving irrigation integrators, sensor suppliers, connectivity providers, and analytics platforms the largest current application profit pool.
Agricultural Capital Investment and Equipment Digitization
- Motor vehicles, plant, machinery, tractors, and equipment attracted approximately USD 1.72 billion (2024, South Africa), allowing guidance, telematics, variable-rate controls, and data subscriptions to be bundled with replacement cycles.
- New agricultural-asset expenditure increased at an annualized 17.9% from 2022 to 2024, indicating that productive-asset investment can support multi-year technology upgrades when farm margins and financing remain available.
- Large enterprises generated 65.8% of agricultural income (2024, South Africa), concentrating purchasing power among buyers capable of deploying connected equipment across multiple farms, machines, irrigation blocks, and production cycles.
Connectivity, Exports and Digital Traceability
- Rural provincial 4G/LTE population coverage ranged from 89% to 100% in 2025, enabling mobile-connected farm platforms while preserving demand for LPWAN, offline-first, and satellite fallback designs in remote locations.
- Agricultural exports reached USD 13.7 billion in 2024, increasing the financial value of digital spray records, production histories, sustainability metrics, disease surveillance, cold-chain visibility, and buyer-facing traceability.
- More than 2,700 farms had adopted the MyFarmWeb platform in an earlier disclosed deployment milestone, demonstrating local appetite for centralized production data and decision support across multiple crop systems.
Market Challenges
Rural Coverage Quality and Power Reliability
- Rural 5G coverage was as low as 13% in Northern Cape in 2025, limiting high-bandwidth use cases and requiring local storage, edge processing, low-power networks, or satellite connectivity for remote operations.
- Telecommunications providers used 84,829 batteries and 1,969 generators in 2025, illustrating the infrastructure cost of maintaining resilient networks and the need for farm-side backup power for gateways and controllers.
- Hybrid LPWAN, cellular, and satellite architectures raise initial design costs but reduce service interruptions; suppliers unable to support multi-network deployments face lower retention in geographically dispersed accounts.
Affordability and Unequal Farm Economics
- Micro enterprises contributed only 5.8% of agricultural income in 2024, constraining their ability to absorb sensor, connectivity, software, training, and maintenance costs without shared-service or financing models.
- Black producers account for less than 10% of national agricultural output, making inclusive adoption dependent on commercialization support, finance, extension capacity, and affordable technology packages.
- The Department of Agriculture targets a producer share of 20% over five years, but technology adoption will require outcome-linked finance and collective procurement rather than conventional upfront equipment sales.
Interoperability, Data Governance and Skills
- A typical scaled deployment may connect five or more technology layers, including sensors, connectivity, cloud platforms, machinery, remote sensing, and business records, creating ownership and support ambiguity when systems fail.
- Recurring revenue is estimated at 38% of market value in 2025, making data portability, subscription terms, cybersecurity, and platform continuity increasingly important to procurement and vendor-switching decisions.
- Technology providers must support farm managers, equipment operators, irrigation teams, agronomists, and executives, requiring multi-role training rather than one-time installation instruction.
Market Opportunities
Precision Irrigation as a Managed Service
- Vendors can combine meters, soil sensors, weather intelligence, controllers, agronomic recommendations, and maintenance into multi-year contracts priced per hectare or irrigation block.
- Farmers, irrigation integrators, water-user associations, financiers, and insurers benefit when system performance is expressed through water productivity, energy use, crop condition, and avoided loss.
- Scaling requires standardized metering, interoperable controls, credible baseline measurement, remote support, and contracts that allocate savings and operational responsibilities clearly.
Livestock Monitoring, Biosecurity and Farm Security
- Recurring collar, tag, camera, gateway, and analytics subscriptions can monetize animal location, health, breeding, grazing behavior, theft alerts, and disease-risk detection.
- Livestock producers, veterinary networks, insurers, processors, and government surveillance programs benefit from faster detection, traceable movement records, and reduced manual inspection costs.
- Commercialization requires rugged devices, long battery life, rural connectivity, interoperable animal identification, and clear evidence that alerts reduce mortality, theft, or disease-response time.
Embedded Finance, Insurance and Traceability Data
- Platforms can earn transaction, verification, analytics, or referral revenue by connecting farm records with lenders, insurers, processors, exporters, and certification workflows.
- Emerging farmers benefit when verified production data substitutes for limited financial histories, while financiers gain improved visibility into crop progress, asset use, weather exposure, and operational risk.
- Adoption requires consent-based data governance, standardized agronomic records, independent model validation, integration with payment systems, and transparent rules governing automated credit or insurance decisions.
Whitespace Opportunity 1: Managed Irrigation Intelligence
Whitespace Opportunity 2: Mid-Market Farm Operating Platform
Whitespace Opportunity 3: Livestock Risk and Security Network
Whitespace Opportunity 4: Traceability and Finance Data Exchange
CHAPTER 9 - Competitive Landscape
Competitive Landscape Overview
The market is moderately fragmented, with global machinery and precision-agriculture vendors competing alongside irrigation specialists, domestic agronomy platforms, remote-sensing firms, livestock-security providers, dealers, telecom partners, and systems integrators.
Market Share Distribution
Top 5 Players
Market Dynamics
8 new entrants in the past 5 years, indicating strong market attractiveness and growth potential.
Company Name | Estimated Market Share | Headquarters | Founding Year | Core Market Focus |
|---|---|---|---|---|
John Deere | 12.0% | Moline, United States | 1837 | Connected machinery, guidance, telematics, operations management, and precision application |
Trimble | 9.5% | Westminster, United States | 1978 | Guidance, positioning, farm software, correction services, and equipment connectivity |
Netafim | 8.5% | Hatzerim, Israel | 1965 | Connected irrigation, fertigation, controllers, sensors, and digital crop management |
AGCO Corporation | 7.0% | Duluth, United States | 1990 | Smart machinery, telemetry, guidance, and farm-data integration |
CNH Industrial | 6.5% | Basildon, United Kingdom | 2013 | Precision machinery, telematics, guidance, and connected service solutions |
Valmont Industries | 5.5% | Omaha, United States | 1946 | Center-pivot irrigation, remote control, field monitoring, and irrigation analytics |
Agri Technovation | 4.5% | Wellington, South Africa | 2008 | Precision agronomy, MyFarmWeb, soil intelligence, crop analytics, and advisory services |
Aerobotics | 4.0% | Cape Town, South Africa | 2014 | Drone imagery, orchard intelligence, AI analytics, yield measurement, and crop-risk detection |
Pessl Instruments | 3.0% | Weiz, Austria | 1984 | Weather stations, field sensors, telemetry, disease models, and decision support |
FarmRanger | 2.5% | South Africa | - | Farm security, livestock monitoring, surveillance, alerts, and remote asset protection |
Cross Comparison Parameters
The report provides detailed cross-comparison of key players across 10 performance parameters to identify competitive strengths and weaknesses.
Pricing Analysis
CHAPTER 10 - REPORT TOC
Market Report Structure
Comprehensive coverage across three strategic phases — Market Assessment, Go-To-Market Strategy, and Survey — delivering end-to-end insights from market analysis and execution roadmap to customer demand validation.
Market Assessment Phase
Supply-side and competitive intelligence covering market sizing, segmentation, competitive dynamics, regulatory landscape, and future forecasts.
Go-To-Market Strategy Phase
15 chapters
Entry strategy evaluation, execution roadmap, partner recommendations, and profitability outlook.
Survey Phase
8 chapters
Demand-side primary research conducted through structured interviews and online surveys with end users across priority metros and Tier 2/3 cities to capture consumption behavior, unmet needs, and purchase drivers.
Complete Report Coverage
201+ detailed sections covering every aspect of the market
143
Assessment Sections
58
Strategy Sections
CHAPTER 11 - Our Approach
Research Methodology
Desk Research
- Agricultural income and capex analysis
- Water-use and irrigation efficiency review
- Rural connectivity and coverage assessment
- Vendor portfolio and channel mapping
Primary Research
- Commercial farm operations director interviews
- Precision agriculture product leader interviews
- Irrigation systems manager consultations
- Agricultural technology procurement head interviews
Validation and Triangulation
- 295 respondent evidence base reviewed
- Supplier revenue reconciled with expenditure
- Deployment volumes tested against pricing
- Forecast drivers checked across stakeholders
CHAPTER 12 - FAQ
Market Entry Prioritization
Still have questions?
Our research team is here to help you find the right solution
CHAPTER 13 - Related Research
Explore Related Reports
Expand your market intelligence with complementary research across regions and adjacent markets.
Regional/Country ReportsRelated market analysis across key regions
Related market analysis across key regions
- Indonesia Smart Farming with IoT Market
- Vietnam Smart Farming with IoT Market
- Thailand Smart Farming with IoT Market
- Malaysia Smart Farming with IoT Market
- Philippines Smart Farming with IoT Market
Adjacent ReportsRelated markets and complementary research
Related markets and complementary research
- Japan Precision Irrigation Market
- Kuwait Livestock Security Market
- Qatar Orchard Analytics Market
- Germany Machinery Telematics Market
- Mexico Biosecurity Technology Market
500+
Market Research Reports
50+
Countries Covered
15+
Industry Verticals