CHAPTER 1 - MARKET SUMMARY
Market Overview
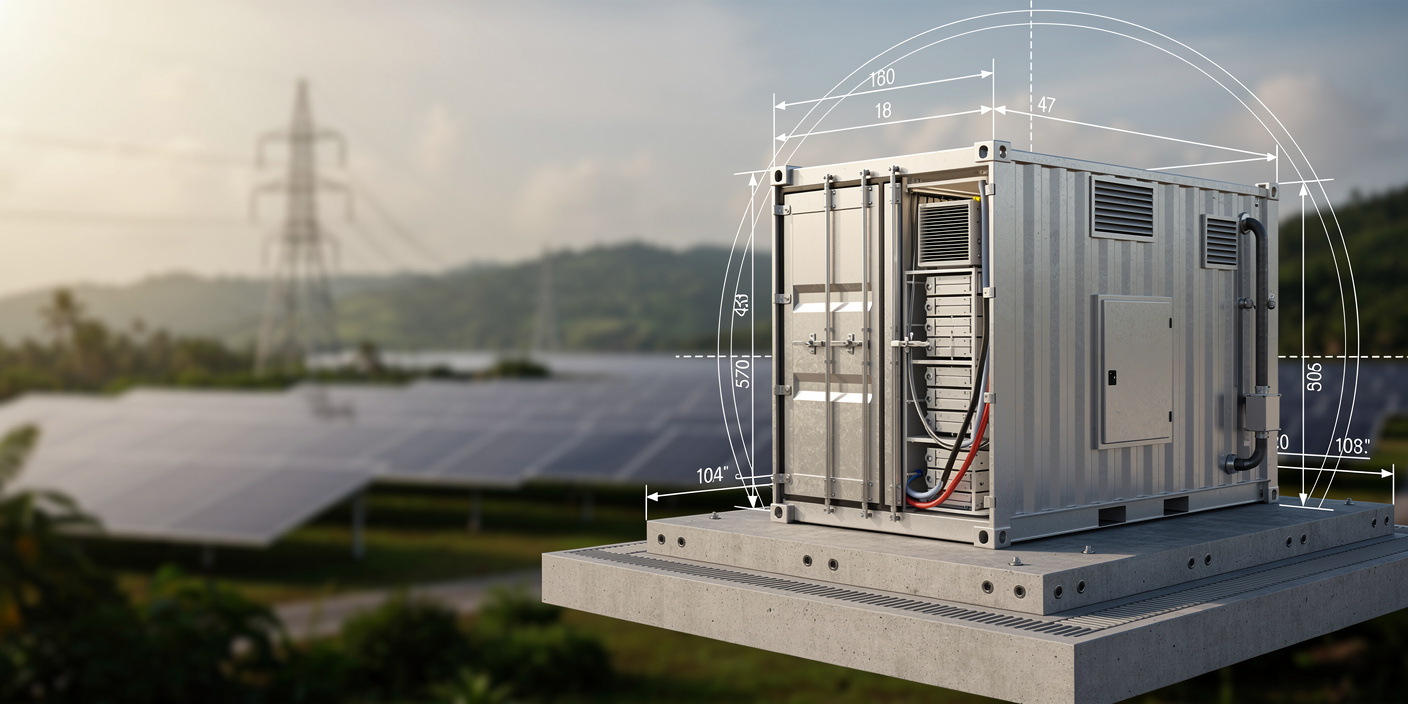
The Southeast Asia Battery Energy Storage Systems Market connects battery-cell suppliers, containerized system manufacturers, power-conversion vendors, software providers, engineering contractors, utilities and project investors. Regional renewable capacity reached approximately 120 GW in 2024. Increasing solar and wind penetration creates demand for frequency response, ramp control, peak shifting, congestion relief and renewable-energy firming across weak or islanded grids.
Commercial deployment is concentrated in the Philippines, Thailand and Singapore, which collectively account for an estimated 68% of 2025 market revenue. The Philippines has established a large utility-scale storage fleet, Thailand is procuring solar-plus-storage capacity and Singapore operates a 285 MWh system. Indonesia, Malaysia and Vietnam represent the principal pipeline markets because of their larger electricity systems and renewable-development plans.
Market Value
USD 2,170 Mn
2025
Annual BESS Deployments
4.2 GWh
2025
Dominant Geography
Philippines
32% estimated share, 2025
Dominant Segment
Lithium Iron Phosphate Chemistry
72% estimated share, 2025
Estimated Active Vendors, Integrators and Developers
185
Future Outlook
The Southeast Asia Battery Energy Storage Systems Market is projected to increase from USD 2,170 Mn in 2025 to USD 7,441 Mn by 2031, representing a forecast CAGR of 22.80%. Expansion will be driven by utility-scale renewable integration, capacity-deferral requirements, ancillary-service procurement, behind-the-meter resilience and new solar-plus-storage rules. Vietnam and Indonesia are expected to become major incremental markets as policy targets translate into auctions, grid-service contracts and renewable-development obligations.
Annual deployed storage capacity is projected to rise from 4.2 GWh in 2025 to approximately 17.5 GWh by 2031. The integrated system value per kWh is expected to decline from USD 516.7 to USD 425.2 as lithium iron phosphate cells, standardized containers and modular power-conversion systems achieve scale. Volume growth should therefore exceed value growth, while software, integration, augmentation and long-term service contracts capture a larger proportion of project lifetime economics.
22.80%
Forecast CAGR
USD 7,441 Mn
2030 Projection
Base Year
2025
Historical Period
2020-2025
Forecast Period
2026-2031
Historical CAGR
28.47%
CHAPTER 2 - SCOPE OF REPORT
Scope of the Market
CHAPTER 4 - Market Size & Growth
Market Size and Growth Trajectory
This section evaluates historical market size, year-over-year growth and forecast projections using vendor revenue, project commissioning, annual deployed energy capacity, integrated system pricing and demand-side grid-investment indicators.
Historical & Projected Market Size ($ Million)
Year-over-Year Growth Rate (%)
Market Value vs Volume Growth (%)
Historical Market Performance
Market expansion accelerated in 2022 as annual commissioned energy capacity increased to approximately 1.7 GWh and integrated project costs declined to USD 617.6 per kWh. Utility-scale projects in the Philippines and Singapore demonstrated that BESS could provide frequency response, reserve capacity and solar shifting under tropical operating conditions. Growth remained above 28% in 2023 and 2024 as procurement broadened to Thailand, Indonesia, Malaysia and Vietnam. By 2025, average project duration had increased to approximately 2.4 hours, indicating a gradual transition from short-duration ancillary services toward renewable shifting and capacity applications.
Forecast Market Outlook
Annual deployments are projected to reach 17.5 GWh in 2031, equivalent to a volume CAGR of approximately 26.8% from the 2025 base. Integrated value per kWh is forecast to decline by approximately 3.2% annually as cell costs fall and container designs standardize. The base case assumes continued grid investment, renewable auctions that recognize storage value and no prolonged battery-material shortage. Vietnam's storage target, mandatory integration rules in the Philippines and greater solar-plus-storage procurement in Thailand should shift the region toward larger two-to-four-hour systems and multi-year service agreements.
CHAPTER 5 - Market Data
Market Breakdown
The market is entering a scale-up phase in which deployment volume, average project duration and integrated system value determine vendor revenue and project returns. The following KPI framework links annual market value with physical installations and pricing.
Year | Market Size (USD Mn) | YoY Growth (%) | Annual Deployments (GWh) | Power Capacity Added (GW) | Integrated Value (USD/kWh) | Period |
|---|---|---|---|---|---|---|
| 2020 | $620 Mn | +- | 0.9 | 0.40 | Forecast | |
| 2021 | $780 Mn | +25.8% | 1.2 | 0.52 | Forecast | |
| 2022 | $1,050 Mn | +34.6% | 1.7 | 0.72 | Forecast | |
| 2023 | $1,360 Mn | +29.5% | 2.4 | 0.99 | Forecast | |
| 2024 | $1,750 Mn | +28.7% | 3.2 | 1.31 | Forecast | |
| 2025 | $2,170 Mn | +24.0% | 4.2 | 1.75 | Forecast | |
| 2026 | $2,665 Mn | +22.8% | 5.3 | 2.16 | Forecast | |
| 2027 | $3,272 Mn | +22.8% | 6.8 | 2.72 | Forecast | |
| 2028 | $4,018 Mn | +22.8% | 8.7 | 3.42 | Forecast | |
| 2029 | $4,935 Mn | +22.8% | 11.0 | 4.23 | Forecast | |
| 2030 | $6,060 Mn | +22.8% | 13.9 | 5.35 | Forecast | |
| 2031 | $7,441 Mn | +22.8% | 17.5 | 7.00 | Forecast |
Annual Deployments
4.2 GWh, 2025, Southeast Asia. Deployment volume is the principal revenue driver because utility-scale projects increasingly use two-hour or longer configurations. Vietnam's adjusted power plan sets a 10,000-16,300 MW BESS target by 2030, materially expanding the future addressable installation pipeline.
Power Capacity Added
1.75 GW, 2025, Southeast Asia. Power capacity determines the ability to provide reserve, frequency control and peak reduction. Singapore's 285 MWh utility-scale system demonstrates the operating role of high-power storage in a compact grid with constrained land and increasing solar penetration.
Integrated Value per kWh
USD 516.7, 2025, Southeast Asia. The metric includes battery containers, power conversion, controls, engineering, logistics, installation and commissioning. Regional battery manufacturing reached 26 GWh in 2024, improving the potential for localization even as safety certification and bankability requirements preserve integration margins.
CHAPTER 6 - Segmentation
Market Segmentation Framework
Comprehensive analysis across battery technology, grid use case, customer group, project scale, ownership structure, value-chain position and geography provides a decision-oriented view of the Southeast Asia Battery Energy Storage Systems Market.
No of Segments
7
Dominant Segment
Battery Chemistry
Fastest Growing Segment
Application
Battery Chemistry
Application
End User
Project Scale
Ownership Model
Value Chain Stage
Geography
Key Segmentation Takeaways
Comprehensive analysis across all extracted segmentation dimensions provides insights into technology selection, project bankability, customer procurement, route-to-market economics and country-level investment priorities.
Battery Chemistry
Lithium Iron Phosphate dominates new procurement because it combines lower thermal-runaway risk, high cycle life and cost competitiveness for daily-use applications. Containerized LFP systems also benefit from a broad Asian supplier base and standardized rack configurations. Alternative chemistries remain strategically relevant for longer-duration use cases, but they face lower production scale, fewer bankable suppliers and more limited operating references in Southeast Asia.
Application
Renewable Energy Integration is the fastest-growing demand dimension as policymakers move from standalone solar and wind procurement toward firm, dispatchable clean-energy supply. Solar shifting is the leading sub-segment, particularly where midday generation causes congestion or curtailment. Grid-support applications remain important, but future value growth increasingly depends on two-to-four-hour systems that combine energy arbitrage, capacity support and reserve revenue.
CHAPTER 7 - Regional Analysis
Regional and Country Analysis
Country Leader Ranking:
Country Leader Market Size:
Fastest Country CAGR:
Country Leader Ranking:
Country Leader Market Size:
Fastest Country CAGR:
Regional and Country Analysis (Current Year)
Regional and Country Analysis Comparison
| Metric | Philippines | Thailand | Singapore | Indonesia | Malaysia | Vietnam | Other Southeast Asia |
|---|---|---|---|---|---|---|---|
| Market Size (USD Mn, 2025) | 694 | 456 | 326 | 282 | 217 | 152 | 43 |
| CAGR (%, 2026-2031) | 20.8% | 23.2% | 13.5% | 27.4% | 24.8% | 31.5% | 18.0% |
| Annual BESS Deployments (GWh, 2025) | 1.30 | 0.88 | 0.61 | 0.55 | 0.42 | 0.34 | 0.10 |
| Selected Policy Benchmark | ESS integration required for prospective VRE plants of at least 10 MW | 24 solar-plus-storage procurement contracts totaling approximately 994 MW | At least 200 MW ESS target beyond 2025 and a 285 MWh operating system | Utility storage pilots linked to renewable integration and remote grids | Energy-transition planning includes utility-scale storage procurement | 10,000-16,300 MW BESS target by 2030 | Cambodia project includes 250 MW and 500 MWh of utility-scale storage |
Market Position
The Philippines ranks first with an estimated USD 694 Mn market in 2025, supported by early reserve-market deployment and mandatory storage integration for prospective variable renewable projects of at least 10 MW.
Growth Advantage
Vietnam's projected 31.5% CAGR exceeds the regional 22.80% rate because its adjusted power plan targets 10,000-16,300 MW of BESS by 2030 from a limited installed base.
Competitive Strengths
Singapore combines a 285 MWh operating system, a target of at least 200 MW beyond 2025 and advanced grid controls, while the Philippines provides greater utility-scale volume and reserve-market depth.
CHAPTER 8 - INDUSTRY ANALYSIS
Growth Drivers, Challenges and Opportunities
Comprehensive analysis of key factors shaping the Southeast Asia Battery Energy Storage Systems Market, including renewable integration, grid-service requirements, capital constraints, safety regulation and emerging storage business models.
Growth Drivers
Accelerating Renewable Energy Integration
- Renewable capacity is projected to nearly triple by 2035 under stated policies, increasing the need for storage at generation, transmission and distribution nodes.
- Solar-heavy systems require BESS to transfer midday generation into evening demand periods, reducing curtailment and improving renewable-project revenue realization.
- Utilities, renewable developers and storage integrators capture value when batteries substitute for gas peakers, defer grid upgrades and provide operating reserve.
Mandatory Storage Policies and National Targets
- Vietnamese centralized solar projects must include storage equal to at least 10% of installed capacity for two hours, creating a direct equipment and integration market.
- The Philippines requires prospective variable renewable plants of at least 10 MW to integrate storage, improving system reliability and project bankability.
- Singapore's target of at least 200 MW of ESS beyond 2025 supports technology validation, grid-service procurement and high-density urban deployment models.
Regional Battery Manufacturing Expansion
- Committed manufacturing projects exceed 80 GWh by 2030, enabling regional module assembly, shorter shipping routes and greater procurement competition.
- Indonesia, Thailand, Malaysia and Vietnam can leverage automotive-battery investment to localize enclosures, cooling, wiring, control systems and service labor.
- Developers benefit from reduced lead times, while governments capture manufacturing employment and greater resilience against global logistics disruption.
Market Challenges
High Cost of Capital and Revenue Uncertainty
- Annual low-emissions investment must approach USD 95 billion by 2035, requiring stronger project pipelines, risk allocation and long-term contracting.
- Grid storage and transmission investment depend on public finance for approximately 40% of funding, exposing deployment to fiscal and utility-credit constraints.
- Projects without capacity payments or ancillary-service contracts must rely on energy arbitrage, which may be insufficient to support debt service and augmentation reserves.
Fragmented Safety, Grid and Permitting Standards
- Developers must reconcile different interconnection codes, fire standards, environmental approvals and import-certification processes across more than 10 Southeast Asian markets.
- Tropical heat and humidity increase thermal-management requirements, affecting auxiliary consumption, warranty conditions and usable battery life.
- Vendors with tested fire suppression, remote monitoring and documented degradation guarantees gain an advantage, but compliance adds cost for smaller projects.
Limited Monetization of Multiple Grid Services
- Single-service contracts can leave substantial battery capability unmonetized, weakening equity returns and increasing dependence on subsidies or utility ownership.
- Utility procurement frequently emphasizes upfront cost rather than lifecycle availability, degradation, efficiency and response performance, creating quality-selection risk.
- Regulators must define dispatch rights, state-of-charge obligations and settlement rules before merchant and storage-as-a-service models can scale.
Market Opportunities
Solar-Plus-Storage Project Development
- Developers can monetize firm renewable-energy blocks, curtailment reduction and evening delivery premiums rather than selling undifferentiated daytime output.
- Independent power producers, EPC contractors, power-conversion vendors and lenders benefit from larger project values and more predictable utilization.
- Standardized auction rules, dispatch obligations and bankable storage-payment structures are required to convert policy targets into financed projects.
Grid Resilience and Transmission Deferral
- Storage located near constrained substations can reduce peak loading, provide reserve and defer higher-cost network expansion.
- Utilities, infrastructure funds and multilateral lenders benefit from projects combining measurable reliability improvements with renewable-energy integration.
- Locational tariffs and performance-based contracts must recognize avoided transmission cost, outage reduction and rapid-response capability.
Localized Manufacturing and Lifecycle Services
- Regional suppliers can capture module assembly, power electronics, controls, container fabrication, cooling and commissioning revenue beyond battery-cell production.
- Operators benefit from faster spare-parts supply, local technical support and lower logistics costs across 15-to-20-year project lives.
- Common warranty, recycling, traceability and second-life standards are required to develop a credible regional lifecycle-services market.
CHAPTER 9 - Competitive Landscape
Competitive Landscape Overview
The competitive landscape combines global battery manufacturers, power-conversion specialists, storage integrators, engineering contractors, utilities and local project developers. Competition is strongest in utility-scale LFP systems, where bankability, safety certification, control software, degradation guarantees, financing support and local service coverage determine vendor selection.
Market Share Distribution
Top 5 Players
Market Dynamics
8 new entrants in the past 5 years, indicating strong market attractiveness and growth potential.
Company Name | Estimated Share of Addressable Vendor and Integration Revenue, 2025 | Headquarters | Founding Year | Core Market Focus |
|---|---|---|---|---|
Sungrow Power Supply | 8.5% | Hefei, China | 1997 | Power conversion, containerized BESS and plant controls |
Huawei Digital Power | 7.5% | Shenzhen, China | 1987 | Smart string storage, power electronics and digital controls |
Fluence | 6.0% | Arlington, United States | 2018 | Utility-scale storage integration and optimization software |
Wärtsilä Energy Storage | 5.0% | Helsinki, Finland | 1834 | Grid-scale storage, hybrid plants and energy management |
Sembcorp Industries | 4.5% | Singapore | 1998 | Storage asset development, ownership and grid services |
San Miguel Global Power | 4.0% | Mandaluyong, Philippines | 2008 | Utility-scale storage ownership and reserve services |
Delta Electronics | 3.5% | Taipei, Taiwan | 1971 | Power conversion, controls and commercial storage systems |
Hitachi Energy | 3.0% | Zurich, Switzerland | 2020 | Grid integration, substations, controls and storage systems |
Tesla Energy | 2.8% | Austin, United States | 2003 | Megapack systems, controls and utility-scale deployment |
BYD Energy Storage | 2.7% | Shenzhen, China | 1995 | Battery cells, modules and integrated storage systems |
Cross Comparison Parameters
The report provides detailed cross-comparison of key players across 10 performance parameters to identify competitive strengths and weaknesses.
Regional Deployment Reach
Integrated PCS and EMS Capability
Project Bankability
Local Service Coverage
Analysis Covered
Market Share Analysis:
Assesses estimated concentration across battery suppliers, integrators, EPC providers and asset developers.
Cross Comparison Matrix:
Benchmarks deployment reach, system capability, bankability and service coverage.
SWOT Analysis:
Evaluates regional supply-chain strengths, project risks and monetization opportunities.
Pricing Strategy Analysis:
Compares turnkey pricing, software fees, availability guarantees and augmentation structures.
Company Profiles:
Reviews headquarters, market focus, capabilities and Southeast Asian positioning.
CHAPTER 10 - REPORT TOC
Market Report Structure
Comprehensive coverage across three strategic phases — Market Assessment, Go-To-Market Strategy, and Survey — delivering end-to-end insights from market analysis and execution roadmap to customer demand validation.
Market Assessment Phase
Supply-side and competitive intelligence covering market sizing, segmentation, competitive dynamics, regulatory landscape, and future forecasts.
Go-To-Market Strategy Phase
15 chapters
Entry strategy evaluation, execution roadmap, partner recommendations, and profitability outlook.
Survey Phase
8 chapters
Demand-side primary research conducted through structured interviews and online surveys with end users across priority metros and Tier 2/3 cities to capture consumption behavior, unmet needs, and purchase drivers.
Complete Report Coverage
201+ detailed sections covering every aspect of the market
143
Assessment Sections
58
Strategy Sections
CHAPTER 11 - Our Approach
Research Methodology
Desk Research
- Reviewed national storage policy frameworks
- Mapped commissioned and announced projects
- Analyzed battery and inverter pricing
- Tracked renewable and grid investment
Primary Research
- Interviewed utility storage procurement directors
- Consulted battery systems integration managers
- Surveyed renewable project development executives
- Engaged lenders and grid specialists
Validation and Triangulation
- Used 332-response market validation panel
- Reconciled capacity and vendor revenues
- Checked project duration and pricing
- Stress-tested country pipeline assumptions
CHAPTER 12 - FAQ
FAQs
Still have questions?
Our research team is here to help you find the right solution
CHAPTER 13 - Related Research
Explore Related Reports
Expand your market intelligence with complementary research across regions and adjacent markets.
Regional/Country ReportsRelated market analysis across key regions
Related market analysis across key regions
- Europe Battery Energy Storage Systems Market Size, Share & Forecast, By Project Type, Technology & End-Use Sector, 2025-2032
- India Battery Energy Storage Systems Market Size, Share & Forecast, By Battery Technology, Application & End User, 2026-2031
- Qatar battery energy storage systems market report size, share, growth drivers, trends, opportunities & forecast 2025–2030
- Indonesia battery energy storage systems market Size, Share, Growth Drivers, Trends, Opportunities & Forecast 2025–2030
- Vietnam Battery Energy Storage Systems Market
Adjacent ReportsRelated markets and complementary research
Related markets and complementary research
- Belgium Smart Grid Infrastructure Market
- Belgium Power Conversion Systems Market
- South Korea Thermal Management Systems Market
- Belgium Lithium Iron Phosphate Chemistry Market
- Malaysia Portable Power Generation Market
500+
Market Research Reports
50+
Countries Covered
15+
Industry Verticals