About the Report
Base Year 2024Listen to the audio summary
Tanzania Grains Market Overview
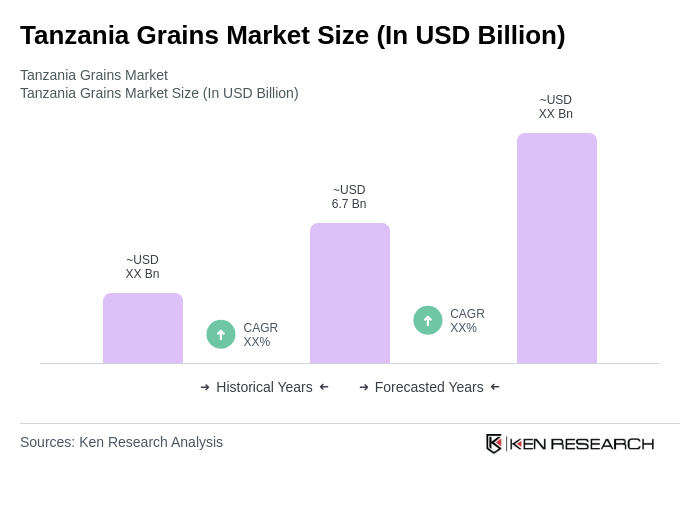
- The Tanzania Grains Market is valued at USD 6.7 billion, based on a five-year historical analysis. This growth is primarily driven by increasing domestic consumption, improvements in agricultural productivity, and government initiatives aimed at enhancing food security. The market has seen a steady rise in demand for staple grains such as maize, rice, and wheat, which are essential for both human consumption and animal feed. Maize remains the dominant crop, with rice and wheat also gaining importance as dietary preferences shift and urbanization increases .
- Key regions in this market include Dar es Salaam, Mwanza, and Arusha, which dominate due to their strategic locations for trade and distribution. Dar es Salaam serves as the primary port city, facilitating imports and exports, while Mwanza and Arusha are crucial for agricultural production and processing, contributing significantly to the overall market dynamics .
- The Tanzanian government continues to implement policies such as the National Agricultural Policy, which aims to boost grain production through improved farming techniques, access to quality seeds, and investment in research and development. Recent government budgets have allocated substantial funding—estimated at over USD 200 million—for agricultural research, infrastructure, and sustainability initiatives in the grains sector .
Tanzania Grains Market Segmentation
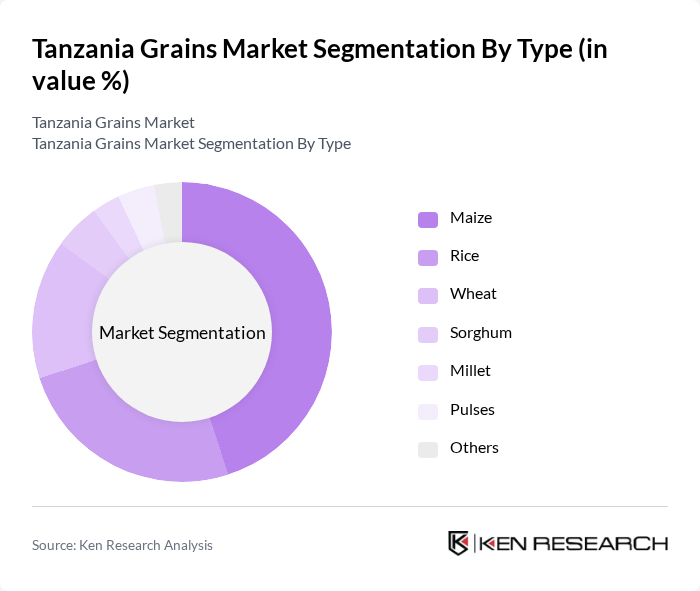
By Type:The grains market can be segmented into various types, including maize, rice, wheat, sorghum, millet, pulses, and others. Among these, maize is the most dominant type due to its significance as a staple food in Tanzania. The increasing population and urbanization have led to a higher demand for maize, which is used for both human consumption and animal feed. Rice and wheat are also gaining traction, particularly in urban areas where dietary preferences are shifting .
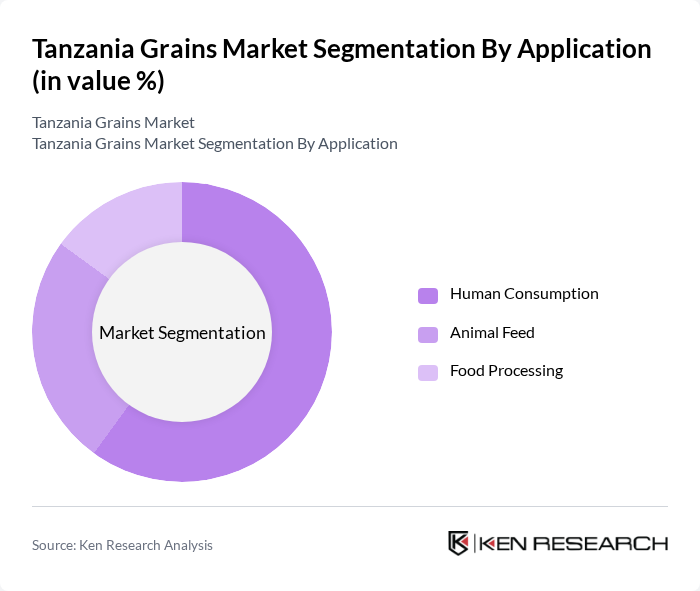
By Application:The grains market is also segmented by application, which includes human consumption, animal feed, and food processing. Human consumption is the leading application segment, driven by the staple nature of grains in the Tanzanian diet. The growing livestock sector has also increased the demand for grains as animal feed, while food processing is emerging as a significant area due to the rise in processed food products .
Tanzania Grains Market Competitive Landscape
The Tanzania Grains Market is characterized by a dynamic mix of regional and international players. Leading participants such as Tanzania Grain Traders Ltd., East African Grain Millers Ltd., Export Trading Group (ETG), Tanzania Grain Board, Mkulima Mbunifu Co. Ltd., Kilimanjaro Native Cooperative Union (KNCU), Tanzania Seed Company Ltd., Mohamed Enterprises Tanzania Ltd. (MeTL Group), National Milling Corporation Ltd., Tanzania Food and Nutrition Centre, Tanzania Agricultural Research Institute, Tanzania Cooperative Development Commission, Tanzania Export Development Authority, Tanzania Bureau of Standards, and Ministry of Agriculture (Tanzania) contribute to innovation, geographic expansion, and service delivery in this space.
Tanzania Grains Market Industry Analysis
Growth Drivers
- Increasing Population and Urbanization:Tanzania's population is projected to reach approximately 63 million in the future, up from 61 million in the past. This rapid growth, coupled with urbanization rates of about 5% annually, drives demand for grains as urban areas require more food supply. Urban consumers increasingly prefer processed grain products, which further stimulates production. The World Bank estimates that urbanization contributes significantly to economic growth, enhancing the grains market's potential in the region.
- Rising Demand for Food Security:The Tanzanian government aims to achieve food security by increasing grain production to meet the needs of its growing population. In the future, the country aims to produce over 10–12 million tons of staple grains, including maize and rice. This focus on self-sufficiency is supported by initiatives like the National Agricultural Policy, which allocates approximately $200 million annually to enhance agricultural productivity and ensure food availability, thereby boosting the grains market.
- Government Support for Agricultural Development:The Tanzanian government has committed to investing $1.5 billion in agricultural development in the future, focusing on improving infrastructure and access to resources for farmers. This includes subsidies for fertilizers and seeds, which are expected to increase grain yields by 20% over the next few years. Such support not only enhances production capacity but also encourages private sector investment, fostering growth in the grains market.
Market Challenges
- Climate Change and Weather Variability:Tanzania faces significant challenges from climate change, with projections indicating a 1.5°C increase in temperature in the future. This change threatens agricultural productivity, particularly in grain production, which relies heavily on consistent rainfall patterns. The World Bank reports that erratic weather could reduce maize yields by up to 30%, exacerbating food insecurity and impacting the grains market negatively.
- Inadequate Infrastructure:The lack of adequate infrastructure, particularly in rural areas, hampers the grains market's growth. Approximately 60% of rural roads are in poor condition, limiting farmers' access to markets and essential services. The African Development Bank estimates that improving rural infrastructure could increase agricultural productivity by 15%, highlighting the urgent need for investment to enhance market access and distribution channels for grains.
Tanzania Grains Market Future Outlook
The Tanzania grains market is poised for significant transformation driven by technological advancements and sustainable practices. In the future, the integration of digital tools in agriculture is expected to enhance productivity and efficiency, allowing farmers to make data-driven decisions. Additionally, the focus on climate-resilient crop varieties will help mitigate the impacts of climate change, ensuring stable grain production. These trends indicate a shift towards a more robust and sustainable grains market, aligning with global food security goals.
Market Opportunities
- Investment in Agricultural Technology:The adoption of precision agriculture technologies is expected to increase grain yields by up to 25% in the future. Investments in drones, soil sensors, and data analytics can optimize resource use and improve crop management, presenting a significant opportunity for growth in the grains market.
- Development of Value-Added Products:There is a growing market for value-added grain products, such as fortified flours and snacks. In the future, the demand for these products is projected to increase by 15%, driven by health-conscious consumers. This trend offers opportunities for local producers to diversify their offerings and enhance profitability in the grains sector.
Scope of the Report
| Segment | Sub-Segments |
|---|---|
| By Type | Maize Rice Wheat Sorghum Millet Pulses Others |
| By Application | Human Consumption Animal Feed Food Processing |
| By Distribution Channel | Direct Sales Wholesale Distributors Online Retail Supermarkets and Hypermarkets |
| By Packaging Type | Bulk Packaging Retail Packaging Eco-Friendly Packaging |
| By Quality Grade | Premium Quality Standard Quality Low-Grade Quality |
| By Price Range | Low Price Mid Price High Price |
| By Region | Northern Tanzania Southern Tanzania Eastern Tanzania Western Tanzania |
Key Target Audience
Investors and Venture Capitalist Firms
Government and Regulatory Bodies (e.g., Tanzania Food and Drugs Authority, Ministry of Agriculture)
Grain Producers and Farmers' Cooperatives
Grain Exporters and Importers
Food Processing Companies
Logistics and Supply Chain Companies
Agrochemical Suppliers
Financial Institutions and Banks
Players Mentioned in the Report:
Tanzania Grain Traders Ltd.
East African Grain Millers Ltd.
Export Trading Group (ETG)
Tanzania Grain Board
Mkulima Mbunifu Co. Ltd.
Kilimanjaro Native Cooperative Union (KNCU)
Tanzania Seed Company Ltd.
Mohamed Enterprises Tanzania Ltd. (MeTL Group)
National Milling Corporation Ltd.
Tanzania Food and Nutrition Centre
Tanzania Agricultural Research Institute
Tanzania Cooperative Development Commission
Tanzania Export Development Authority
Tanzania Bureau of Standards
Ministry of Agriculture (Tanzania)
Table of Contents
Market Assessment Phase
1. Executive Summary and Approach
2. Tanzania Grains Market Overview
2.1 Key Insights and Strategic Recommendations
2.2 Tanzania Grains Market Overview
2.3 Definition and Scope
2.4 Evolution of Market Ecosystem
2.5 Timeline of Key Regulatory Milestones
2.6 Value Chain & Stakeholder Mapping
2.7 Business Cycle Analysis
2.8 Policy & Incentive Landscape
3. Tanzania Grains Market Analysis
3.1 Growth Drivers
3.1.1 Increasing Population and Urbanization
3.1.2 Rising Demand for Food Security
3.1.3 Government Support for Agricultural Development
3.1.4 Expansion of Export Markets
3.2 Market Challenges
3.2.1 Climate Change and Weather Variability
3.2.2 Inadequate Infrastructure
3.2.3 Market Access and Distribution Issues
3.2.4 Price Volatility of Grains
3.3 Market Opportunities
3.3.1 Investment in Agricultural Technology
3.3.2 Development of Value-Added Products
3.3.3 Access to International Markets
3.3.4 Sustainable Farming Practices
3.4 Market Trends
3.4.1 Organic and Health-Conscious Grain Products
3.4.2 Digitalization in Agriculture
3.4.3 Increased Focus on Supply Chain Transparency
3.4.4 Adoption of Climate-Resilient Varieties
3.5 Government Regulation
3.5.1 Agricultural Policy Reforms
3.5.2 Import and Export Regulations
3.5.3 Quality Standards for Grains
3.5.4 Subsidies for Farmers
4. SWOT Analysis
5. Stakeholder Analysis
6. Porter's Five Forces Analysis
7. Tanzania Grains Market Market Size, 2019-2024
7.1 By Value
7.2 By Volume
7.3 By Average Selling Price
8. Tanzania Grains Market Segmentation
8.1 By Type
8.1.1 Maize
8.1.2 Rice
8.1.3 Wheat
8.1.4 Sorghum
8.1.5 Millet
8.1.6 Pulses
8.1.7 Others
8.2 By Application
8.2.1 Human Consumption
8.2.2 Animal Feed
8.2.3 Food Processing
8.3 By Distribution Channel
8.3.1 Direct Sales
8.3.2 Wholesale Distributors
8.3.3 Online Retail
8.3.4 Supermarkets and Hypermarkets
8.4 By Packaging Type
8.4.1 Bulk Packaging
8.4.2 Retail Packaging
8.4.3 Eco-Friendly Packaging
8.5 By Quality Grade
8.5.1 Premium Quality
8.5.2 Standard Quality
8.5.3 Low-Grade Quality
8.6 By Price Range
8.6.1 Low Price
8.6.2 Mid Price
8.6.3 High Price
8.7 By Region
8.7.1 Northern Tanzania
8.7.2 Southern Tanzania
8.7.3 Eastern Tanzania
8.7.4 Western Tanzania
9. Tanzania Grains Market Competitive Analysis
9.1 Market Share of Key Players
9.2 KPIs for Cross Comparison of Key Players
9.2.1 Company Name
9.2.2 Market Share (%)
9.2.3 Annual Revenue (USD Million)
9.2.4 Revenue Growth Rate (%)
9.2.5 Volume of Grains Traded (Metric Tons)
9.2.6 Geographic Coverage (Regions/Export Markets)
9.2.7 Distribution Network Size
9.2.8 Processing Capacity (Metric Tons/Year)
9.2.9 Product Portfolio Breadth (Number of Grain Types)
9.2.10 Certifications & Quality Standards (e.g., TBS, ISO)
9.2.11 Innovation Index (e.g., Technology Adoption, R&D Spend)
9.2.12 Customer Segments Served (e.g., B2B, B2C, Export)
9.3 SWOT Analysis of Top Players
9.4 Pricing Analysis
9.5 Detailed Profile of Major Companies
9.5.1 Tanzania Grain Traders Ltd.
9.5.2 East African Grain Millers Ltd.
9.5.3 Export Trading Group (ETG)
9.5.4 Tanzania Grain Board
9.5.5 Mkulima Mbunifu Co. Ltd.
9.5.6 Kilimanjaro Native Cooperative Union (KNCU)
9.5.7 Tanzania Seed Company Ltd.
9.5.8 Mohamed Enterprises Tanzania Ltd. (MeTL Group)
9.5.9 National Milling Corporation Ltd.
9.5.10 Tanzania Food and Nutrition Centre
9.5.11 Tanzania Agricultural Research Institute
9.5.12 Tanzania Cooperative Development Commission
9.5.13 Tanzania Export Development Authority
9.5.14 Tanzania Bureau of Standards
9.5.15 Ministry of Agriculture (Tanzania)
10. Tanzania Grains Market End-User Analysis
10.1 Procurement Behavior of Key Ministries
10.1.1 Ministry of Agriculture
10.1.2 Ministry of Trade and Industry
10.1.3 Ministry of Finance
10.2 Corporate Spend on Infrastructure & Energy
10.2.1 Investment in Grain Storage Facilities
10.2.2 Funding for Agricultural Research
10.2.3 Expenditure on Transportation Infrastructure
10.3 Pain Point Analysis by End-User Category
10.3.1 Farmers
10.3.2 Distributors
10.3.3 Retailers
10.4 User Readiness for Adoption
10.4.1 Technology Adoption among Farmers
10.4.2 Awareness of Sustainable Practices
10.4.3 Readiness for Digital Platforms
10.5 Post-Deployment ROI and Use Case Expansion
10.5.1 ROI from Improved Yield
10.5.2 Expansion into New Markets
10.5.3 Increased Product Offerings
11. Tanzania Grains Market Future Size, 2025-2030
11.1 By Value
11.2 By Volume
11.3 By Average Selling Price
Go-To-Market Strategy Phase
1. Whitespace Analysis + Business Model Canvas
1.1 Market Gaps Identification
1.2 Business Model Framework
2. Marketing and Positioning Recommendations
2.1 Branding Strategies
2.2 Product USPs
3. Distribution Plan
3.1 Urban Retail Strategies
3.2 Rural NGO Tie-Ups
4. Channel & Pricing Gaps
4.1 Underserved Routes
4.2 Pricing Bands
5. Unmet Demand & Latent Needs
5.1 Category Gaps
5.2 Consumer Segments
6. Customer Relationship
6.1 Loyalty Programs
6.2 After-Sales Service
7. Value Proposition
7.1 Sustainability Initiatives
7.2 Integrated Supply Chains
8. Key Activities
8.1 Regulatory Compliance
8.2 Branding Efforts
8.3 Distribution Setup
9. Entry Strategy Evaluation
9.1 Domestic Market Entry Strategy
9.1.1 Product Mix
9.1.2 Pricing Band
9.1.3 Packaging Solutions
9.2 Export Entry Strategy
9.2.1 Target Countries
9.2.2 Compliance Roadmap
10. Entry Mode Assessment
10.1 Joint Ventures
10.2 Greenfield Investments
10.3 Mergers & Acquisitions
10.4 Distributor Model
11. Capital and Timeline Estimation
11.1 Capital Requirements
11.2 Timelines for Implementation
12. Control vs Risk Trade-Off
12.1 Ownership vs Partnerships
13. Profitability Outlook
13.1 Breakeven Analysis
13.2 Long-Term Sustainability
14. Potential Partner List
14.1 Distributors
14.2 Joint Ventures
14.3 Acquisition Targets
15. Execution Roadmap
15.1 Phased Plan for Market Entry
15.1.1 Market Setup
15.1.2 Market Entry
15.1.3 Growth Acceleration
15.1.4 Scale & Stabilize
15.2 Key Activities and Milestones
15.2.1 Milestone Planning
15.2.2 Activity Tracking
Research Methodology
Phase 1: Approach1
Desk Research
- Analysis of national agricultural production statistics from the Tanzania National Bureau of Statistics
- Review of market reports from the Food and Agriculture Organization (FAO) on grain production and consumption trends
- Examination of trade data from the Tanzania Revenue Authority regarding grain exports and imports
Primary Research
- Interviews with key stakeholders in the grains supply chain, including farmers, millers, and distributors
- Surveys conducted with agricultural extension officers to gather insights on farming practices and challenges
- Focus group discussions with consumers to understand preferences and purchasing behavior related to grains
Validation & Triangulation
- Cross-validation of findings through comparison with regional grain market reports
- Triangulation of data from government sources, industry reports, and primary interviews
- Sanity checks through expert reviews from agronomists and market analysts
Phase 2: Market Size Estimation1
Top-down Assessment
- Estimation of total grain market size based on national agricultural output and consumption data
- Segmentation of the market by grain type, including maize, rice, and wheat
- Incorporation of government agricultural policies and initiatives affecting grain production
Bottom-up Modeling
- Collection of production data from local farmers and cooperatives to establish baseline volumes
- Analysis of pricing trends across different grain types and regions
- Calculation of market size based on volume sold and average market prices
Forecasting & Scenario Analysis
- Development of growth projections based on historical trends and current market dynamics
- Scenario modeling considering factors such as climate change impacts and policy shifts
- Creation of baseline, optimistic, and pessimistic forecasts for the grains market through 2030
Phase 3: CATI Sample Composition1
| Scope Item/Segment | Sample Size | Target Respondent Profiles |
|---|---|---|
| Maize Production Insights | 100 | Farmers, Agricultural Cooperatives |
| Rice Market Dynamics | 80 | Mill Operators, Distributors |
| Wheat Supply Chain Analysis | 60 | Importers, Retailers |
| Consumer Grain Preferences | 90 | Household Consumers, Retail Shoppers |
| Grain Export Trends | 50 | Export Managers, Trade Analysts |
Frequently Asked Questions
What is the current value of the Tanzania Grains Market?
The Tanzania Grains Market is valued at approximately USD 6.7 billion, reflecting a steady growth driven by increasing domestic consumption, agricultural productivity improvements, and government initiatives focused on enhancing food security.
Which grains are most commonly produced in Tanzania?
What are the key regions for grain production in Tanzania?
How does urbanization affect the Tanzania Grains Market?
Other Regional/Country Reports
Indonesia Grains Market
Malaysia Grains Market
KSA Grains Market
APAC Grains Market
SEA Grains Market
Vietnam Grains Market
Why Buy From Us?

What makes us stand out is that our consultants follow Robust, Refine and Result (RRR) methodology. Robust for clear definitions, approaches and sanity checking, Refine for differentiating respondents' facts and opinions, and Result for presenting data with story.

We have set a benchmark in the industry by offering our clients with syndicated and customized market research reports featuring coverage of entire market as well as meticulous research and analyst insights.

While we don't replace traditional research, we flip the method upside down. Our dual approach of Top Bottom & Bottom Top ensures quality deliverable by not just verifying company fundamentals but also looking at the sector and macroeconomic factors.

With one step in the future, our research team constantly tries to show you the bigger picture. We help with some of the tough questions you may encounter along the way: How is the industry positioned? Best marketing channel? KPI's of competitors? By aligning every element, we help maximize success.

Our report gives you instant access to the answers and sources that other companies might choose to hide. We elaborate each steps of research methodology we have used and showcase you the sample size to earn your trust.

If you need any support, we are here! We pride ourselves on universe strength, data quality, and quick, friendly, and professional service.