CHAPTER 1 - MARKET SUMMARY
Market Overview
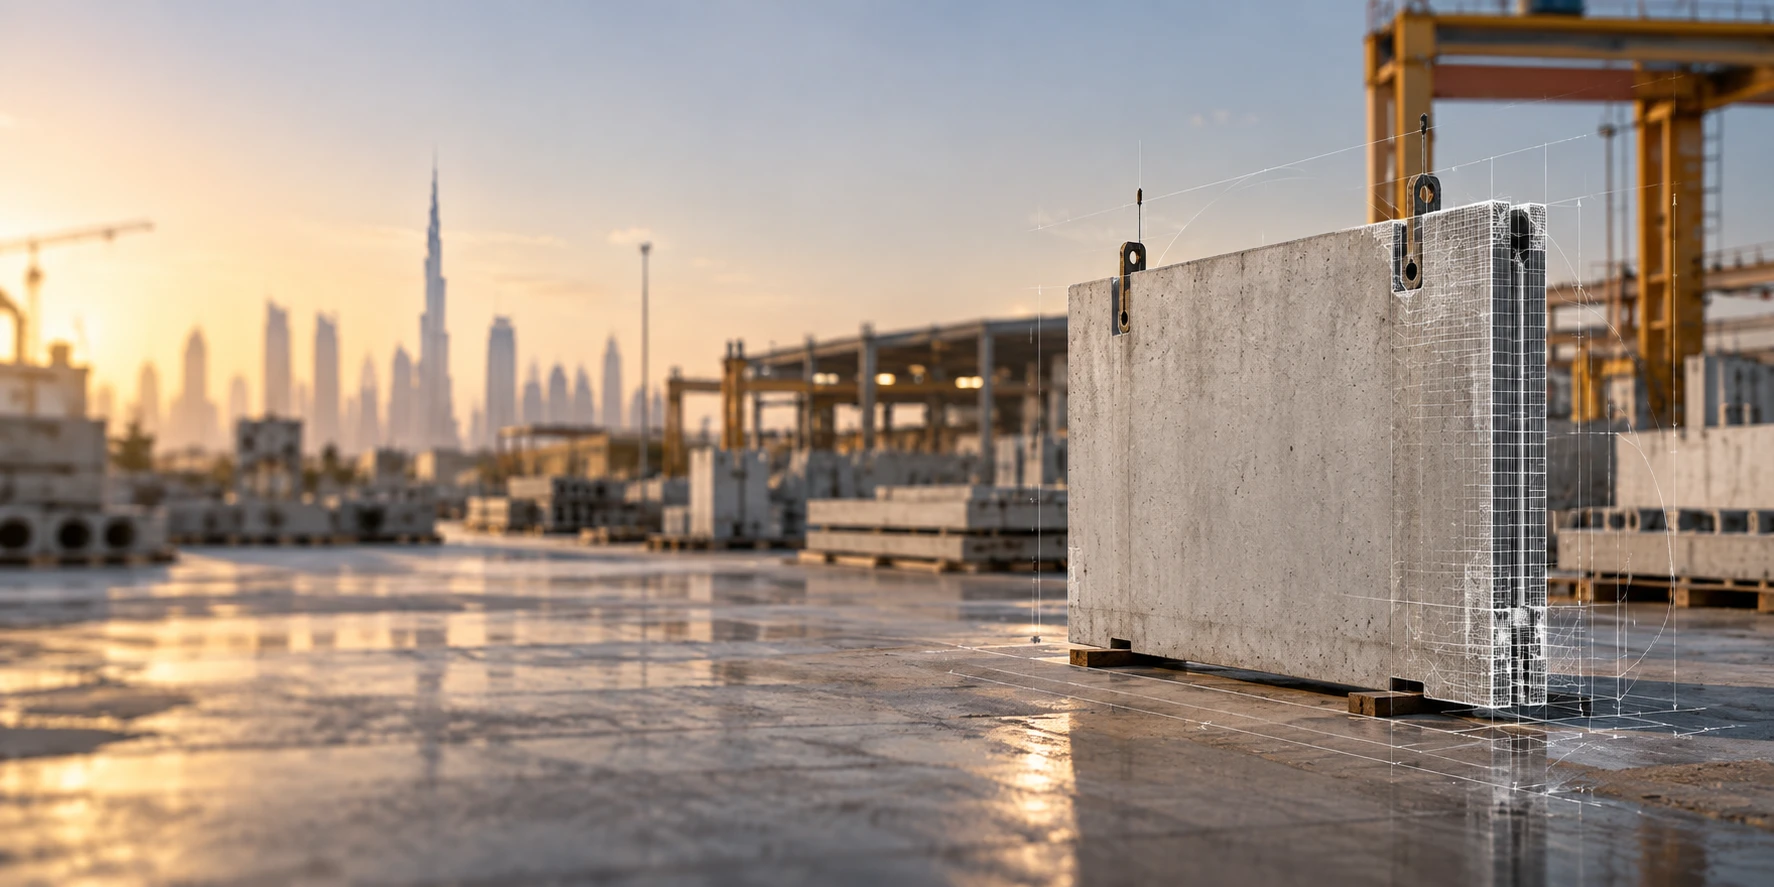
The UAE Precast Concrete Market is structured around factory-produced structural and architectural components supplied directly into residential, commercial, industrial and infrastructure projects. Demand is closely linked to project execution velocity and repeatable building formats. In H1 2025, Dubai Municipality inspected 18,800 buildings under construction across more than 36 million square metres, indicating a substantial addressable construction pipeline for industrialized building systems.
Dubai and Abu Dhabi form the market's primary production and demand hubs because both combine large-scale project pipelines with established precast manufacturing clusters. Gulf Precast reports five factories, six production facilities and daily capacity of approximately 1,500 cubic metres, while Exeed Precast reports maximum capacity of 365,000 cubic metres annually. These localized manufacturing networks reduce transport distances and improve installation responsiveness.
Market Value
USD 2,200 million
2025
Dominant Region
Dubai
2025
Dominant Segment
Structural Building Components
fastest growing
Total Number of Players
26
Future Outlook
The UAE Precast Concrete Market is projected to expand from USD 2,200 million in 2025 to approximately USD 3,121 million by 2031 and USD 3,308 million by 2032. The market's estimated historical CAGR of 5.17% during 2020-2025 is expected to strengthen to 6.00% during 2025-2032. Residential master communities, utility infrastructure, logistics facilities and transport-related construction will remain the main sources of volume growth. Capacity additions such as SIFTEC's facility, which can produce more than 700,000 cubic metres annually, improve the industry's ability to absorb larger standardized project packages.
Value growth is expected to remain modestly above physical-volume growth as manufacturers supply higher-specification structural systems, prestressed elements, façade components and engineered installation packages. Market volume is modeled to increase from approximately 2.55 million cubic metres in 2025 to 3.64 million cubic metres by 2032, implying a volume CAGR near 5.2%. The principal strategic opportunity is therefore not commodity concrete production alone, but integrated design, manufacturing, logistics and erection. Dubai's expanding sewerage and drainage programs, rail-linked industrial development and continuing residential completions create recurring demand for factory-produced structures with short installation cycles.
6.00%
Forecast CAGR
$3,308 Mn
2030 Projection
Base Year
2025
Historical Period
2020-2025
Forecast Period
2025-2032
Historical CAGR
5.17%
CHAPTER 2 - SCOPE OF REPORT
Scope of the Market
CHAPTER 3 - Key Stakeholders
Key Target Audience
Key stakeholders who can leverage from this market analysis for investment, strategy, and operational planning.
Investors
CAGR, capacity utilization, capex intensity, EBITDA, consolidation risk
Corporates
procurement cost, lead time, quality, capacity, supplier resilience
Government
housing delivery, infrastructure capacity, compliance, localization, sustainability
Operators
mould utilization, throughput, logistics, erection productivity, quality control
Financial institutions
project finance, utilization, covenants, backlog, cash conversion
CHAPTER 4 - Market Size & Growth
Market Size, Growth Forecast and Trends
This section evaluates the historical market size, analyzes year-over-year growth dynamics, and presents forecast projections supported by market performance indicators and demand-side drivers.
Historical & Projected Market Size ($ Million)
Year-over-Year Growth Rate (%)
Market Value vs Volume Growth (%)
Historical Market Performance (2020-2025)
Market momentum strengthened progressively after 2020 as delayed construction activity normalized and residential, warehousing and infrastructure projects returned to execution. Modeled physical consumption increased from approximately 2.07 million cubic metres in 2020 to 2.55 million cubic metres in 2025. The strongest modeled value increase occurred in 2023 at 5.59%, followed by another 5.26% rise in 2025. The market's historical CAGR of 5.17% is broadly consistent with evidence that precast adoption benefited from large housing programs and the need to accelerate repetitive structural construction.
Forecast Market Outlook (2025-2032)
Growth is projected to remain near 6.00% annually through 2032 as capacity expansion meets an increasingly diversified project pipeline. Physical market volume is expected to reach approximately 3.64 million cubic metres, while blended installed-system ASP rises toward USD 909 per cubic metre as higher-value prestressed, architectural and engineered packages gain mix. The forecast remains within published external benchmarks, including a 5.3% UAE forecast from 2026-2032 and a 6.75% estimate in another UAE market reference, supporting a central trajectory near 6%.
CHAPTER 5 - Market Data
Market Breakdown
Precast concrete economics in the UAE are driven by the interaction of project volume, plant utilization and the value of engineered fabrication and erection services. The following operating model links market value to physical output and blended selling value.
Year | Market Size (USD Mn) | YoY Growth (%) | Estimated Domestic Volume (Mn m3) | Blended ASP (USD/m3) | Capacity Utilization (%) | Period |
|---|---|---|---|---|---|---|
| 2020 | $1,710 Mn | +- | 2.07 | 826 | Forecast | |
| 2021 | $1,785 Mn | +4.39% | 2.12 | 842 | Forecast | |
| 2022 | $1,880 Mn | +5.32% | 2.21 | 851 | Forecast | |
| 2023 | $1,985 Mn | +5.59% | 2.31 | 859 | Forecast | |
| 2024 | $2,090 Mn | +5.29% | 2.42 | 864 | Forecast | |
| 2025 | $2,200 Mn | +5.26% | 2.55 | 863 | Forecast | |
| 2026 | $2,332 Mn | +6.00% | 2.69 | 867 | Forecast | |
| 2027 | $2,472 Mn | +6.00% | 2.83 | 874 | Forecast | |
| 2028 | $2,620 Mn | +5.99% | 2.98 | 879 | Forecast | |
| 2029 | $2,778 Mn | +6.03% | 3.13 | 888 | Forecast | |
| 2030 | $2,944 Mn | +5.98% | 3.30 | 892 | Forecast | |
| 2031 | $3,121 Mn | +6.01% | 3.47 | 899 | Forecast | |
| 2032 | $3,308 Mn | +5.99% | 3.64 | 909 | Forecast |
Estimated Domestic Volume
2.55 million m3, 2025, UAE. Volume is supported by major factory assets across Dubai and Abu Dhabi. Gulf Precast reports approximately 1,500 m3 daily capacity, while Exeed reports 365,000 m3 annual capacity, illustrating the depth of the domestic production base.
Blended ASP
USD 863/m3, 2025, UAE. The modeled ASP reflects a mix of concrete manufacture, reinforcement, engineering and project installation rather than commodity ready-mix pricing. Dubai Precast supplies structural, architectural and infrastructure products, supporting higher value realization for integrated packages.
Capacity Utilization
75%, 2025, UAE. New capacity is moderating near-term utilization pressure while expanding the industry's ability to execute megaprojects. SIFTEC's 2025 facility added more than 700,000 m3 of annual production capability and a 750,000-square-foot production area.
CHAPTER 6 - Segmentation
Market Segmentation Framework
Comprehensive analysis across key dimensions providing insights into market structure, consumer preferences, and distribution patterns.
No of Segments
7
Dominant Segment
End-Use Industry
Fastest Growing Segment
Technology
Product Type
End-Use Industry
Application
Customer Type
Sales Channel
Technology
Geography
Key Segmentation Takeaways
Comprehensive analysis across all extracted segmentation dimensions providing insights into market structure, consumer preferences, and distribution patterns.
End-Use Industry
Residential construction is the largest recurring demand pool because villas, townhouses, apartment buildings and master-planned housing communities benefit from repetitive factory-built structural systems. Large housing programs also allow manufacturers to amortize mould engineering across many units, strengthening precast economics relative to bespoke cast-in-place construction and supporting integrated supply-and-erection contracts.
Technology
Automated production, prestressing, digital detailing and lower-carbon concrete formulations are the fastest-evolving competitive dimensions. The most scalable plants increasingly combine automated reinforcement preparation, controlled curing, hollow-core extrusion and digitally coordinated installation. This raises throughput per production line, lowers dimensional variability and gives larger manufacturers an advantage on high-volume projects with demanding schedules.
CHAPTER 7 - Regional Analysis
Regional Analysis
The UAE ranks among the Gulf's largest precast concrete markets, behind Saudi Arabia but ahead of smaller GCC peers. Its position reflects a dense construction pipeline, established local manufacturing and strong adoption of factory-built systems in residential, commercial and infrastructure projects. Published Middle East data places regional precast demand at more than USD 7 billion in 2025.
Focus Country Ranking
2nd
Focus Country Market Size
USD 2,200 Mn
UAE CAGR (2025-2032)
6.00%
Focus Country Ranking
2nd
Focus Country Market Size
USD 2,200 Mn
UAE CAGR (2025-2032)
6.00%
Regional Analysis (Current Year)
Market Position
The UAE ranks 2nd among the selected GCC peers, with the model anchored at USD 2,200 million versus Saudi Arabia's independently reported USD 3,900 million in 2025.
Growth Advantage
UAE forecast growth of 6.00% is below Saudi Arabia's 8.2% but above modeled Qatar and Oman trajectories, placing the UAE in the Gulf's upper growth tier.
Competitive Strengths
UAE strengths include a 900 km national rail network, major industrial zones and new plants exceeding 700,000 m3 annual capacity, supporting logistics-intensive precast production.
CHAPTER 8 - INDUSTRY ANALYSIS
Growth Drivers, Challenges & Opportunities
Comprehensive analysis of key factors shaping the UAE Precast Concrete Market, including growth catalysts, operational challenges, and emerging opportunities across production, distribution, and consumer segments.
Growth Drivers
Large Residential and Urban Construction Pipeline
- Construction inspections covered more than 36 million square metres (H1 2025, Dubai), creating a large addressable surface for structural panels, slabs, stairs and façade systems. Manufacturers with standardized mould libraries can convert large developments into higher factory throughput.
- Dubai issued 1,669 building completion certificates (H1 2025, Dubai), up approximately 30% year-on-year, indicating strong project turnover and continued replenishment of construction activity. Faster completion requirements improve the economic case for off-site fabrication.
- Dubai Precast reports participation in hundreds of projects since 2005 (UAE and Oman), including villas, high-rise structures and car parks, demonstrating the breadth of applications in which precast can replace or complement cast-in-place construction.
Infrastructure and Utility Investment
- Dubai's Tasreef drainage program carries approximately USD 8.2 billion of investment (2025, Dubai), creating opportunities for precast chambers, culverts, drainage components and related civil-engineering products.
- The Dubai Strategic Tunnels for Sewerage project represents approximately USD 21.8 billion of planned investment (2025, Dubai), expanding the medium-term municipal infrastructure opportunity for engineered concrete structures and utility components.
- Etihad Rail's national network spans 900 km and connects 11 freight terminals and four major ports (2026, UAE), improving heavy-product logistics while generating direct rail-related infrastructure requirements.
Industrialized Construction and Capacity Expansion
- SIFTEC's facility occupies approximately 2.2 million square feet (2025, Dubai), with 750,000 square feet dedicated to production and 800,000 square feet to storage, enabling high-volume project execution.
- Gulf Precast reports five factories and six production facilities (2026, UAE), with daily output capacity around 1,500 m3, illustrating the scale already required to compete for national projects.
- Exeed Precast reports maximum production capability of 365,000 m3 annually (2026, Abu Dhabi), reinforcing Abu Dhabi's role as a major production base for structural and architectural precast products.
Market Challenges
Heavy Fixed-Cost Manufacturing Economics
- Exeed Precast operates a primary facility covering more than 200,000 square metres (2026, Abu Dhabi), demonstrating the land, equipment and working-capital intensity involved in competing at scale. Low utilization therefore creates significant unit-cost pressure.
- Hard Precast reports a 150,000 m3 annual production facility (2026, Dubai) and a fleet of 106 trailers and trucks, illustrating that logistics capital is an additional fixed-cost burden beyond production equipment.
- New supply of more than 700,000 m3 annually (2025, Dubai) increases competitive pressure for high-volume contracts, potentially compressing margins where demand growth temporarily trails installed capacity additions.
Certification and Quality-Control Requirements
- Factories must obtain a conformity certificate under Dubai Municipality's quality framework, creating mandatory compliance obligations (2012 onward, Dubai) covering production controls, testing and traceability.
- Dubai Municipality Standard No. 026 (2018, Dubai) sets technical operating requirements for concrete manufacturing facilities, requiring ongoing quality-management capability rather than one-time licensing.
- Dubai Municipality conducted 25,000 construction field inspections (H1 2025, Dubai), indicating active enforcement intensity and making consistent product documentation commercially important for manufacturers serving major contractors.
Competition from Alternative Construction Technologies
- The first Trakhees construction license using 3D printing was issued in 2024 (Dubai), signaling movement from pilot activity toward regulated commercial deployment and creating substitution risk for simple low-rise concrete elements.
- Dubai's 25% 3D-printed building target by 2030 encourages contractors to evaluate labor, material and schedule savings against precast and conventional methods, increasing technology competition for standardized structures.
- Global precast growth remains approximately 6.4% through 2033, suggesting precast remains competitive but must continue improving automation, digital engineering and lower-carbon product performance to defend share against emerging construction systems.
Market Opportunities
Integrated Design-Manufacture-Erection Contracts
- Dubai Precast has operated since 2006 (Dubai) as a manufacturer of complete prefabricated building components, illustrating the monetizable opportunity in engineering, fabrication and project-support services rather than element supply alone.
- Hard Precast's 106-truck and trailer fleet (2026, Dubai) highlights the competitive value of owning logistics and erection coordination, allowing manufacturers to capture project-management margin and reduce delivery-interface risk.
- To capture this opportunity, producers must integrate BIM coordination, mould engineering, production scheduling and site erection. Large facilities exceeding 700,000 m3 annual capacity (2025, Dubai) increase the value of digital order planning.
Utility and Water Infrastructure Components
- Precast producers can monetize recurring supply of manholes, chambers, pipes, culverts and tunnel-related components around the USD 8.2 billion Tasreef program (2025, Dubai).
- Government contractors and specialized utility producers benefit because standardized underground products create repeat-volume manufacturing economics across multi-year programs exceeding USD 20 billion equivalent (2025, Dubai).
- Capturing the opportunity requires certification, hydraulic-product engineering and procurement qualification. Dubai's active factory assessment system currently lists certified precast manufacturers with certificates extending into 2026-2027 (Dubai).
Low-Carbon and Digitally Manufactured Precast
- Manufacturers can build premium revenue pools around lower-carbon mixes, EPD-backed products and resource-efficient structural design as sustainability criteria become embedded in government and developer procurement. Emirates Precast has documented environmental declarations for products in the UAE.
- Automated plants benefit most because high utilization spreads robotics, carousel lines and digital quality-control investments over larger output. Exeed's 365,000 m3 annual maximum capacity (2026, Abu Dhabi) provides a scale benchmark for such investment.
- Realizing the opportunity requires integration of design data, factory automation and documented environmental performance. Dubai's construction system already performs 25,000 inspections in six months (H1 2025), favoring suppliers with strong traceability and process control.
CHAPTER 9 - Competitive Landscape
Competitive Landscape Overview
The UAE market is moderately fragmented, with several high-capacity national manufacturers competing against specialized local plants. Capital-intensive production, certification, mould engineering, heavy transport and erection capability create meaningful entry barriers.
Market Share Distribution
Top 5 Players
Market Dynamics
8 new entrants in the past 5 years, indicating strong market attractiveness and growth potential.
Company Name | Market Share | Headquarters | Founding Year | Core Market Focus |
|---|---|---|---|---|
Gulf Precast Concrete Company LLC | - | Abu Dhabi, UAE | - | Structural and architectural precast systems, infrastructure components |
Exeed Precast | - | Abu Dhabi, UAE | 2006 | High-capacity structural precast, hollow-core and architectural products |
Emirates Precast Construction LLC | - | Dubai, UAE | 1976 | Structural precast, architectural elements and engineered building systems |
Hard Precast Building Systems | - | Dubai, UAE | - | Prestressed systems, hollow-core slabs and integrated precast structures |
Dubai Precast LLC | - | Dubai, UAE | 2006 | Prefabricated building components, residential and infrastructure systems |
Abu Dhabi Precast LLC | - | Abu Dhabi, UAE | 2001 | Precast and prestressed concrete for buildings and infrastructure |
Hi-Tech Concrete Products LLC | - | Abu Dhabi, UAE | 2006 | Precast, hollow-core, GRC and integrated concrete products |
RAK Precast FZC | - | Ras Al Khaimah, UAE | 2006 | Structural precast, hollow-core slabs and building systems |
Nael Cement Products | - | Al Ain, UAE | - | Precast elements, hollow-core, utility products and concrete components |
SIFTEC | - | Dubai, UAE | - | Large-scale automated structural precast manufacturing |
Cross Comparison Parameters
The report provides detailed cross-comparison of key players across 10 performance parameters to identify competitive strengths and weaknesses.
Installed Precast Capacity
Capacity Utilization Rate
UAE Precast Revenue Growth
Precast EBITDA Margin
Analysis Covered
Market Share Analysis:
Estimates competitive scale using capacity, project pipeline and revenues.
Cross Comparison Matrix:
Benchmarks capacity, utilization, growth and profitability across leading manufacturers.
SWOT Analysis:
Assesses production strengths, commercial gaps, risks and expansion opportunities.
Pricing Strategy Analysis:
Compares value realization across products, specifications and contract structures.
Company Profiles:
Reviews footprint, capabilities, product focus and competitive strategic positioning.
CHAPTER 10 - REPORT TOC
Table of Contents
Market Assessment Phase
Supply-side and competitive intelligence covering market sizing, segmentation, competitive dynamics, regulatory landscape, and future forecasts.
Go-To-Market Strategy Phase
15 chapters
Entry strategy evaluation, execution roadmap, partner recommendations, and profitability outlook.
Survey Phase
8 chapters
Demand-side primary research conducted through structured interviews and online surveys with end users across priority metros and Tier 2/3 cities to capture consumption behavior, unmet needs, and purchase drivers.
Complete Report Coverage
201+ detailed sections covering every aspect of the market
143
Assessment Sections
58
Strategy Sections
CHAPTER 11 - Our Approach
Research Methodology
Desk Research
- Mapped certified precast factory registries
- Reviewed construction pipeline and permits
- Benchmarked plant capacities and technologies
- Tracked infrastructure project investment pipelines
Primary Research
- Precast plant general managers interviewed
- Production managers assessed utilization rates
- Contractors validated procurement decision criteria
- Structural consultants reviewed specification trends
Validation and Triangulation
- 287 respondents across stakeholder groups
- Capacity reconciled against project demand
- Pricing cross-checked across component categories
- Forecasts stress-tested against construction cycles
CHAPTER 12 - FAQ
FAQs
Still have questions?
Our research team is here to help you find the right solution
CHAPTER 13 - Related Research
Explore Related Reports
Expand your market intelligence with complementary research across regions and adjacent markets.
Regional/Country ReportsRelated market analysis across key regions
Related market analysis across key regions
- India Precast Concrete Market Size, Share & Forecast, By Product Type, End-Use Industry & Application, 2026-2031
- Indonesia Precast Concrete Market
- Oman Precast Concrete Market
- APAC precast concrete market report Size, Share, Growth Drivers, Trends, Opportunities & Forecast 2025–2030
- Bahrain middle east precast concrete market report Size, Share, Growth Drivers, Trends, Opportunities & Forecast 2025–2030
Adjacent ReportsRelated markets and complementary research
Related markets and complementary research
- Singapore Precast Concrete Products Market
- Australia Modular Construction Market Size, Share & Forecast, By Project Type, End-Use Sector & Technology, 2026-2031
- UAE Ready-Mix Concrete Market Size, Share & Forecast, By Product Type, Application & End-Use Industry, 2025–2032
- UAE 3D Printing in Construction Market Size, Share, Trends, Growth Drivers & Forecast 2025–2030
- Indonesia Construction Automation Technology Market
500+
Market Research Reports
50+
Countries Covered
15+
Industry Verticals