CHAPTER 1 - MARKET SUMMARY
Market Overview
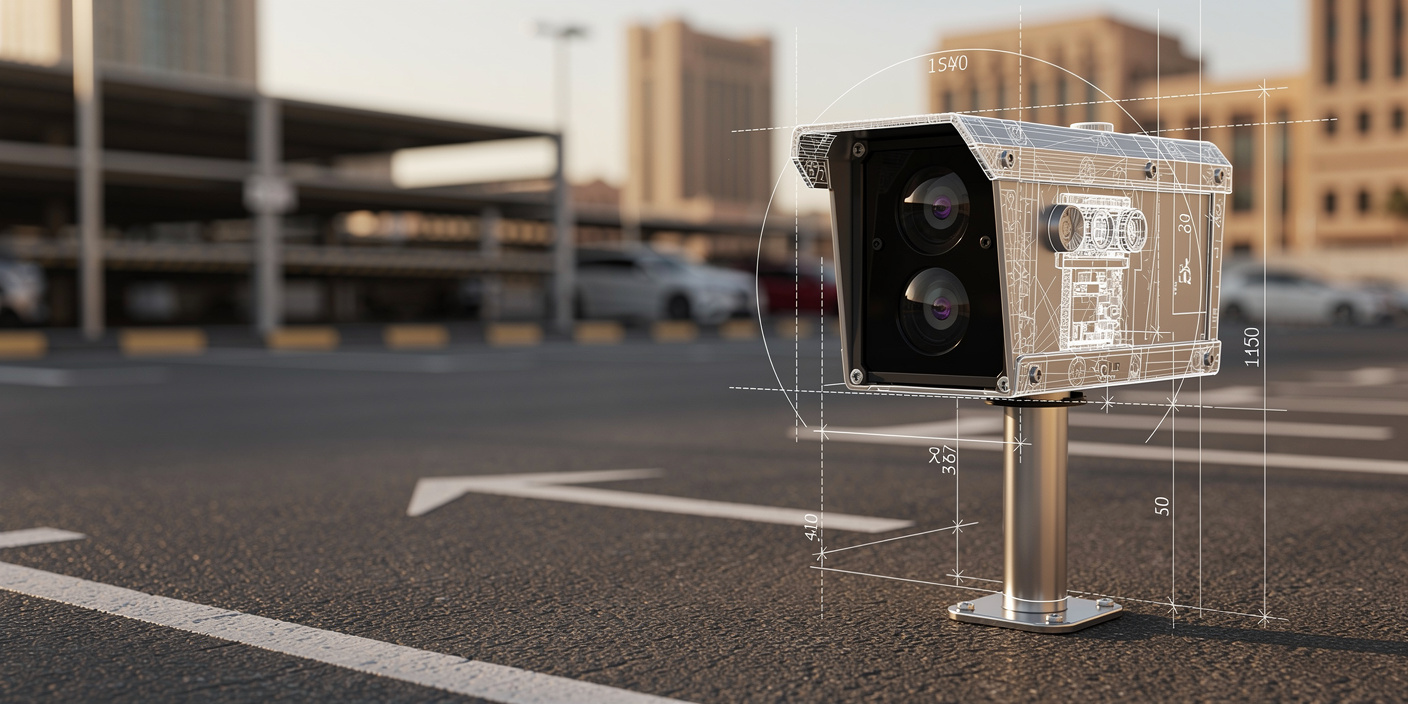
The UAE Smart Parking & ANPR Systems Market operates through municipal concessions, commercial property deployments, parking management software, ANPR equipment, mobile payments, enforcement services and transaction-linked contracts. Dubai accommodates approximately 3.5 million daytime vehicles in 2024, while registered vehicles increased about 10% over two years. This traffic intensity converts parking availability, payment convenience and enforcement accuracy into measurable commercial priorities.
Dubai represents the market's largest operating hub because dense commercial districts, malls, hotels, airports and mixed-use communities support high-frequency transactions. A major listed parking operator managed approximately 229,000 active spaces in Q4 2025, including 193,200 public spaces and 32,200 developer spaces. Concentrated portfolios improve route economics for inspection vehicles, maintenance teams, software integration and centralized revenue management.
Market Value
USD 1,200 Mn
2025
Dominant Region
Dubai
Dominant Segment
Cloud-Based Parking Management Platforms
fastest growing
Total Number of Players
64
Future Outlook
The UAE Smart Parking & ANPR Systems Market is projected to expand from USD 1,200 Mn in 2025 to USD 2,500 Mn by 2031. The market recorded a historical CAGR of 15.7% during 2020-2025 as municipal digitalization, mobile payment adoption, retail parking modernization and automated enforcement broadened the addressable revenue pool. Forecast growth will be driven by barrierless parking, cloud-based management, variable tariffs, AI-assisted plate recognition and private-property outsourcing. Dubai will remain the principal revenue center, while Abu Dhabi and the Northern Emirates provide incremental deployment opportunities across public, residential and transport assets.
The forecast CAGR is estimated at 13.0% during 2025-2031, with annual growth moderating from 13.5% in 2026 to 12.1% in 2031 as large metropolitan portfolios become more digitally mature. Smart-managed parking spaces are projected to increase from approximately 755,000 in 2025 to 1.55 million in 2031. Cashless transactions could represent 96% of covered activity by the terminal year, compared with 81% in 2025. Value growth will also reflect premium software modules, enforcement analytics, reservations, dynamic pricing and multi-site management rather than space additions alone.
13.0%
Forecast CAGR
$2,500 Mn
2030 Projection
Base Year
2025
Historical Period
2020-2025
Forecast Period
2026-2031
Historical CAGR
15.7%
CHAPTER 2 - SCOPE OF REPORT
Scope of the Market
CHAPTER 3 - Key Stakeholders
Key Target Audience
Key stakeholders who can leverage this market analysis for investment, strategy, procurement and operational planning.
Investors
market growth, concession economics, recurring revenue, margins and consolidation potential
Corporates
property monetization, parking experience, access control, procurement and operating ROI
Government
congestion management, tariff policy, enforcement productivity, accessibility and data governance
Operators
utilization, revenue per space, ANPR throughput, maintenance and customer service
Financial institutions
concession duration, cash flow visibility, capital intensity, covenants and technology risk
CHAPTER 4 - Market Size & Growth
Market Size, Growth Forecast and Trends
This section evaluates the historical market size, analyzes year-over-year growth dynamics, and presents forecast projections supported by market performance indicators and demand-side drivers.
Historical & Projected Market Size ($ Million)
Year-over-Year Growth Rate (%)
Market Value vs Volume Growth (%)
Historical Market Performance (2020-2025)
Market growth accelerated from 10.7% in 2021 to a historical peak of 19.2% in 2024, reflecting post-pandemic traffic normalization, cashless adoption, private-property modernization and broader use of automated enforcement. Smart-managed spaces expanded from approximately 380,000 in 2020 to 755,000 in 2025, equivalent to a 14.7% CAGR. The cashless share increased by 43 percentage points during the period. Value growth exceeded space expansion in 2024 and 2025 as operators introduced premium tariffs, cloud subscriptions, enforcement analytics and transaction-linked revenue models.
Forecast Market Outlook (2026-2031)
The forecast assumes a 13.0% CAGR, producing a terminal value of USD 2,500 Mn in 2031. Smart-managed spaces are projected to exceed 1.55 million, while connected ANPR and sensor endpoints reach approximately 314,000. Growth will increasingly come from software and service intensity rather than hardware installation alone. Cloud analytics, barrierless access, reservations, digital permits, automated violation processing and property-level revenue optimization will expand recurring revenue. Annual growth gradually moderates as Dubai matures, although Abu Dhabi, Sharjah, private communities and transportation hubs sustain double-digit national expansion.
CHAPTER 5 - Market Data
Market Breakdown
The UAE Smart Parking & ANPR Systems Market combines infrastructure deployment, software subscriptions, mobile payments, enforcement processing and managed parking operations. Its growth trajectory is strategically relevant because value creation is moving toward connected space portfolios, high-frequency digital transactions and scalable ANPR analytics.
Year | Market Size (USD Mn) | YoY Growth (%) | Smart-Managed Spaces (000) | Cashless Transaction Share (%) | Connected ANPR and Sensor Endpoints (000) | Period |
|---|---|---|---|---|---|---|
| 2020 | $578 Mn | +- | 380 | 38% | Forecast | |
| 2021 | $640 Mn | +10.7% | 430 | 45% | Forecast | |
| 2022 | $735 Mn | +14.8% | 495 | 53% | Forecast | |
| 2023 | $860 Mn | +17.0% | 575 | 62% | Forecast | |
| 2024 | $1,025 Mn | +19.2% | 660 | 72% | Forecast | |
| 2025 | $1,200 Mn | +17.1% | 755 | 81% | Forecast | |
| 2026 | $1,362 Mn | +13.5% | 850 | 85% | Forecast | |
| 2027 | $1,545 Mn | +13.4% | 960 | 88% | Forecast | |
| 2028 | $1,750 Mn | +13.3% | 1,085 | 91% | Forecast | |
| 2029 | $1,980 Mn | +13.1% | 1,225 | 93% | Forecast | |
| 2030 | $2,230 Mn | +12.6% | 1,380 | 95% | Forecast | |
| 2031 | $2,500 Mn | +12.1% | 1,550 | 96% | Forecast |
Smart-Managed Spaces
755,000, 2025, UAE. Portfolio growth supports scalable software, payment and enforcement economics. Dubai's largest listed parking operator managed 229,000 active spaces in Q4 2025, an 11% annual increase.
Cashless Transaction Share
81%, 2025, UAE. High digital penetration lowers cash collection costs and enables account-based mobility services. Dubai Mall parking payments were processed through a fully seamless account-linked model during 2025.
Connected ANPR and Sensor Endpoints
125,000, 2025, UAE. Connected endpoints expand enforcement throughput, occupancy intelligence and predictive maintenance. Dubai inspection operations scanned approximately 29 million vehicle plates in Q4 2025 using field devices and 27 smart vehicles.
CHAPTER 6 - Segmentation
Market Segmentation Framework
Comprehensive analysis across key dimensions providing insights into market structure, consumer preferences, and distribution patterns.
No of Segments
7
Dominant Segment
Solution Type
Fastest Growing Segment
Deployment Model
Solution Type
Deployment Model
End-Use Industry
Enterprise Size
Application
Pricing Model
Geography
Key Segmentation Takeaways
Comprehensive analysis across all extracted segmentation dimensions providing insights into market structure, consumer preferences, and distribution patterns.
Solution Type
Solution Type is the dominant segmentation dimension because purchasing economics differ materially across on-street infrastructure, off-street access systems, ANPR enforcement and software-led payment platforms. Parking Software and Payments provides the strongest recurring-revenue characteristics, while ANPR and Enforcement Systems generate high strategic value through measurable compliance, permit validation, security and labor-productivity improvements.
Deployment Model
Deployment Model is the fastest-growing segmentation dimension as municipalities and property operators replace isolated servers with cloud-managed, API-enabled and multi-site architectures. Cloud-Based deployments lead expansion because they accelerate tariff updates, mobile integration, centralized monitoring, plate-list synchronization and analytics. Hybrid models remain important for sites requiring local gate control, low-latency processing and operational continuity during connectivity disruptions.
CHAPTER 7 - Regional Analysis
Regional Analysis
The UAE ranks second among selected Gulf smart parking and ANPR markets by estimated 2025 value, behind Saudi Arabia but ahead of Qatar, Kuwait, Oman and Bahrain. Its smaller population is offset by high vehicle ownership, dense commercial assets, advanced digital payments and rapid deployment of automated parking enforcement.
Focus Country Ranking
2nd
Focus Country Market Size
USD 1.20 Bn
UAE CAGR (2026-2031)
13.0%
Focus Country Ranking
2nd
Focus Country Market Size
USD 1.20 Bn
UAE CAGR (2026-2031)
13.0%
Regional Analysis (Current Year)
Market Position
The UAE ranks second with USD 1.20 Bn in 2025, supported by approximately 600 vehicles per 1,000 people and digitally mature municipal parking operations.
Growth Advantage
The UAE forecast CAGR of 13.0% exceeds Qatar at 10.8% and Kuwait at 9.6%, positioning the country as a Gulf growth leader outside Saudi Arabia.
Competitive Strengths
Competitive advantages include 3.5 million daytime Dubai vehicles, account-linked payment infrastructure and a 229,000-space listed operator portfolio supporting scalable deployment economics.
CHAPTER 8 - INDUSTRY ANALYSIS
Growth Drivers, Market Challenges & Market Opportunities
Comprehensive analysis of key factors shaping the UAE Smart Parking & ANPR Systems Market, including growth catalysts, operational challenges, and emerging opportunities across technology deployment, parking operations, enforcement and property management.
Growth Drivers
High Vehicle Density and Urban Mobility Demand
- Registered vehicles increased approximately 10% over two years (2024, Dubai), compared with a stated global range of 2% to 4%, expanding pressure on curb space and commercial parking capacity.
- Dubai population is projected to expand by approximately 3.6% annually through 2030 (Dubai), increasing parking demand around residential communities, workplaces, schools, hospitals and transit interchanges.
- Dubai received 19.59 million international overnight visitors (2025, Dubai), up 5%, supporting parking transactions at hotels, malls, attractions, airports and event venues.
Parking Portfolio Expansion and Pricing Modernization
- The operator's public parking portfolio reached 193,200 spaces (Q4 2025, Dubai), creating a large installed base for digital permits, variable tariffs, mobile payment and plate-based inspection.
- The weighted average hourly tariff increased to AED 3.03 (Q4 2025, Dubai), up 51% from AED 2.01, strengthening the business case for revenue-control and demand-management systems.
- Public parking revenue per space increased to AED 749 (Q4 2025, Dubai), up 23%, demonstrating that pricing, enforcement and digital payment can lift asset productivity without proportional capacity expansion.
ANPR Enforcement and Barrierless Payment Adoption
- Smart inspection vehicles scanned 17.5 million plates (Q4 2025, Dubai), up 154%, while field inspection devices scanned another 11.5 million plates.
- Enforcement notices increased to approximately 810,000 notices (Q4 2025, Dubai), up 59%, supporting revenue for violation management, digital evidence and back-office processing.
- Parking account integration was operational at 73 of 154 Parkonic locations (H1 2025, UAE), extending barrierless payment beyond a single flagship property.
Market Challenges
Capital Intensity and Multi-Year Payback
- Projects combining ANPR cameras, barriers, sensors, communications, servers, payment equipment and civil works can require 3 to 5 years of payback (2025, UAE benchmark), depending on utilization and tariff levels.
- Sites with fewer than 300 to 500 spaces (2025, UAE benchmark) may struggle to absorb dedicated control rooms, integrations and maintenance costs without shared cloud infrastructure.
- Operators therefore require phased deployment, subscription pricing or revenue-sharing structures to reduce upfront capital and align vendor compensation with realized parking transactions.
Legacy Integration and Portfolio Complexity
- Public curb spaces, developer garages and multi-storey assets require different access, tariff, permit and enforcement workflows, increasing interface and configuration costs across more than 229,000 spaces (Q4 2025, Dubai).
- A concession fee capped at 27.5% of eligible revenue (2025, Dubai) creates direct pressure to control technology, maintenance and processing costs while maintaining service levels.
- Variable pricing introduced in April 2025 (Dubai) requires systems to synchronize location classifications, time bands, user communication, payment calculations and enforcement rules without creating billing disputes.
Privacy, Cybersecurity and Plate-Data Governance
- Parking systems may process millions of plate observations, with Dubai enforcement scanning approximately 29 million plates in Q4 2025, increasing the operational importance of access controls and retention rules.
- Barrierless systems link plate records to digital accounts and payment instruments, making encryption, breach response and auditable processing essential across 100% seamless Dubai Mall transactions (2025, Dubai).
- Cross-property and cross-emirate interoperability requires clear responsibility between operators, municipalities, payment providers and technology vendors before plate records can support broader mobility services.
Market Opportunities
Barrierless Retail and Hospitality Parking
- Dubai Mall parking operated through 100% seamless account-linked transactions (2025, Dubai), demonstrating the potential for payment fees, revenue sharing and premium reservations.
- Property owners, parking operators, payment platforms and ANPR vendors benefit as ancillary parking revenue reached AED 8.7 million in H1 2025 for one integrated mobility provider.
- Integration must expand beyond the existing 73 of 154 Parkonic locations (H1 2025, UAE) with consistent plate matching, account consent and customer support.
Abu Dhabi and Secondary Emirate Expansion
- Municipal additions can support bundled contracts covering sensors, ANPR, permits, payments and enforcement rather than one-time equipment sales across 302 new spaces (2025, Abu Dhabi).
- Regional integrators and cloud vendors can serve public authorities, residential districts and tourism assets while diversifying beyond Dubai's approximately 229,000-space leading operator portfolio (Q4 2025).
- Standardized APIs, plate-list formats and payment interoperability are required to connect 7 emirates (UAE) without recreating separate technology stacks for every authority.
AI-Based Utilization and Enforcement Analytics
- Analytics can optimize tariffs and staffing across 37 million quarterly parking transactions (Q4 2025, Dubai), supporting recurring software and performance-linked fees.
- Operators and municipalities gain from route optimization as 27 smart inspection vehicles (Q4 2025, Dubai) provide a scalable data stream for enforcement planning.
- Plate recognition, occupancy and transaction datasets must be unified under privacy-compliant governance before algorithms can optimize millions of observations, including 29 million Q4 plate scans.
Government & Regulators
International Institutions
Trade & Industry Bodies
- UAE Smart Parking and ANPR Systems Market Reference
Company Filings and Corporate Sources
Key Assumptions
- Domestic market value reflects revenue earned from smart parking deployments and operations attributable to UAE customers and assets.
- Parking fees retained entirely by property owners are excluded unless they fund an externally contracted technology, payment or management service.
- Imported equipment and software consumed in UAE deployments are included irrespective of vendor headquarters.
- Market volume represents parking spaces managed using connected software, ANPR, sensors, digital payment or automated access systems.
- ANPR endpoints include cameras, mobile inspection devices and connected sensor-equivalent control points used within parking workflows.
- Company shares represent estimated UAE smart parking and ANPR revenue rather than global group revenue.
- Peer-country values are normalized to a consistent smart parking, ANPR, payment and operating-service scope.
Forecast Boundaries
- The base scenario assumes continued municipal digitalization, private-property modernization and stable infrastructure investment.
- No structural prohibition on plate-based parking access, digital payment or cloud parking management is assumed.
- Forecast values include replacement, expansion, software upgrades, transaction growth and externally earned managed-service revenue.
- Inflation, tariff mix, analytics modules and subscription pricing are incorporated into implied revenue per managed space.
- Forecast CAGR reconciles with the 2025 and 2031 market values.
Limitations
- Private-company revenue and installation volumes are not consistently disclosed and require benchmark-based estimation.
- Operator disclosures may combine parking fees, enforcement, permits, development contracts and adjacent mobility income.
- Property owners frequently procure integrated access, security and parking systems without separating category-level expenditure.
- Connected-space estimates depend on the definition of smart management and may differ across public and private portfolios.
- Rapid changes in tariff policy, concession structures, privacy requirements and payment partnerships can affect revenue allocation.
CHAPTER 9 - Competitive Landscape
Competitive Landscape Overview
The UAE Smart Parking & ANPR Systems Market is moderately concentrated among large operators but fragmented across software, equipment and integration providers. Concession access, references, cybersecurity, plate-recognition accuracy and installed maintenance capability create substantial entry barriers.
Market Share Distribution
Top 5 Players
Market Dynamics
8 new entrants in the past 5 years, indicating strong market attractiveness and growth potential.
Company Name | Market Share | Headquarters | Founding Year | Core Market Focus |
|---|---|---|---|---|
Parkin Company PJSC | 10.0% | Dubai, UAE | 2023 | Public parking concessions, developer parking, enforcement, permits and multi-storey parking operations |
Q Mobility | 4.5% | Abu Dhabi, UAE | - | Urban mobility operations, parking management, road-service integration and municipal mobility infrastructure |
SKIDATA | 3.5% | Grödig, Austria | 1977 | Parking access and revenue control, barriers, ticketing, digital credentials and management software |
Flowbird | 3.0% | Paris, France | 2015 | On-street payment terminals, mobile parking, enforcement, account platforms and urban mobility applications |
HUB Parking Technology | 2.8% | Bologna, Italy | - | Off-street parking systems, ANPR access, barriers, guidance and centralized parking management |
Parkonic | 2.5% | Dubai, UAE | - | Barrierless parking, ANPR, digital payments, property parking operations and account-linked access |
Conduent Transportation | 2.3% | Florham Park, New Jersey, USA | 2017 | Parking enforcement, curb management, violation processing, mobility payments and public-sector platforms |
T2 Systems | 2.0% | Indianapolis, Indiana, USA | 1994 | Parking management software, permits, enforcement, payments, citations and mobility analytics |
Smart Parking Ltd. | 1.8% | Auckland, New Zealand | 2010 | ANPR-managed parking, occupancy technology, enforcement services and parking data analytics |
APCOA Parking | 1.5% | Stuttgart, Germany | 1946 | Parking operations, digital parking services, airport parking, commercial property management and mobility hubs |
Cross Comparison Parameters
The report provides detailed cross-comparison of key players across 10 performance parameters to identify competitive strengths and weaknesses.
Smart-Managed Space Growth
License Plate Recognition Throughput
Revenue per Parking Space
EBITDA Margin
Analysis Covered
Market Share Analysis:
Quantifies operator, platform and equipment revenue concentration by participant.
Cross Comparison Matrix:
Benchmarks space growth, ANPR scale, monetization and profitability.
SWOT Analysis:
Assesses concession access, technology differentiation, execution risks and opportunities.
Pricing Strategy Analysis:
Compares subscriptions, transactions, capital sales and revenue sharing.
Company Profiles:
Reviews positioning, geographic presence, capabilities and customer focus.
CHAPTER 10 - REPORT TOC
CHAPTER 14 - Table Of Contents
Phase 1Market Assessment Phase
11
Chapters
Supply-side and competitive intelligence covering market sizing, segmentation, competitive dynamics, regulatory landscape, and future forecasts.
Phase 2Go-To-Market Strategy Phase
15
Chapters
Entry strategy evaluation, execution roadmap, partner recommendations, and profitability outlook.
Complete Report Coverage
201+ detailed sections covering every aspect of the market
143
Assessment Sections
58
Strategy Sections
CHAPTER 11 - Our Approach
Research Methodology
Desk Research
- Municipal parking portfolio data review
- ANPR deployment and enforcement mapping
- Property parking contract assessment
- Operator filing and tariff analysis
Primary Research
- Municipal parking director interviews
- ANPR product manager consultations
- Property mobility head discussions
- Parking operations manager interviews
Validation and Triangulation
- 286 expert responses cross-validated
- Operator revenues reconciled by portfolio
- Space volumes checked against transactions
- Forecast assumptions stress-tested by scenario
CHAPTER 12 - FAQ
FAQs
Still have questions?
Our research team is here to help you find the right solution
CHAPTER 13 - Related Research
Explore Related Reports
Expand your market intelligence with complementary research across regions and adjacent markets.
Regional/Country ReportsRelated market analysis across key regions
Related market analysis across key regions
No regional reports found.
Adjacent ReportsRelated markets and complementary research
Related markets and complementary research
500+
Market Research Reports
50+
Countries Covered
15+
Industry Verticals