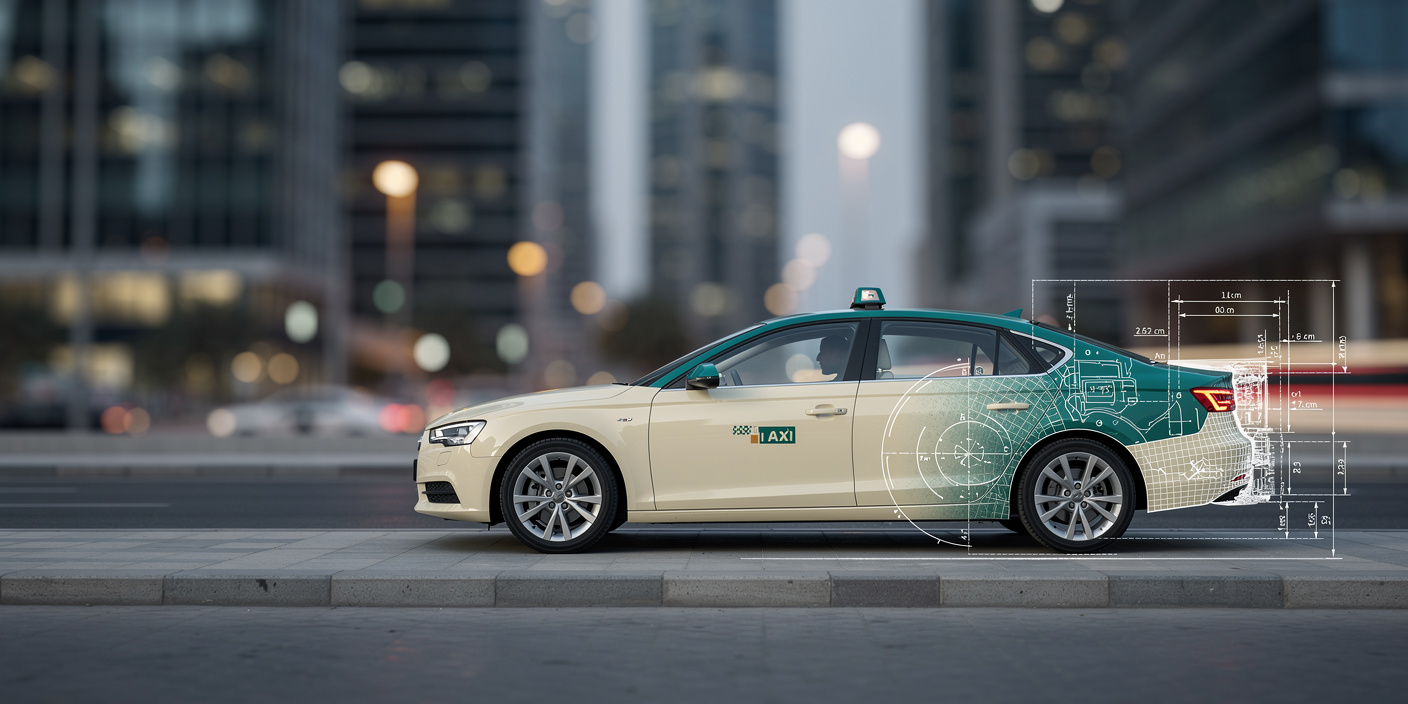
CHAPTER 1 - MARKET SUMMARY
Market Overview
The UAE Taxi Market operates through regulated fleet concessions, metered street taxis, licensed limousine fleets, and app-based dispatch partnerships. Demand is structurally dense because Dubai recorded 5.94 million active individuals during peak hours in 2024, versus 4.25 million usual residents. This daytime population uplift creates recurring commuter, airport, hospitality, and event mobility requirements with high trip frequency, predictable peaks, and strong utilization.
Dubai is the dominant commercial hub, supported by more than 115 million taxi trips in 2024. Abu Dhabi provides the second demand pool, where the fleet reached 6,168 taxis in 2025 and served more than 99 million passengers during 2024. These two emirates concentrate airport throughput, tourism accommodation, business districts, and licensed operator capacity, yielding vehicle productivity and fare realization.
Market Value
USD 2,000 million
2025
Dominant Region
Dubai
Dominant Segment
E-Hail Taxi
fastest growing
Total Number of Players
38
Future Outlook
The UAE Taxi Market is projected to advance from USD 2,000 million in 2025 to USD 3,018 million by 2031, representing a 7.1% forecast CAGR. This outlook follows a 7.6% historical CAGR during 2020-2025, when pandemic recovery, tourism normalization, population expansion, and higher digital booking penetration lifted trips. Growth should remain volume-led through 2028, with regulated tariff revisions, premium airport journeys, and app-booking surcharges adding measured value growth. Dubai will remain the principal profit pool, while Abu Dhabi will sustain high digital-dispatch intensity and Northern Emirates will benefit from broader platform coverage and tourism-oriented fleet expansion.
Projected growth depends on three structural shifts. First, the e-hail share of bookings is expected to rise from 62% in 2025 to 88% in 2031, improving dispatch density and reducing idle time. Second, the licensed fleet is forecast to expand from 25,800 vehicles to 34,500, with hybrid and electric models capturing most additions. Third, autonomous taxi deployment should move from pilot fleets toward commercial corridors after 2026, supporting higher utilization but requiring technology partnerships and regulatory approvals. The base forecast assumes stable regulated fares, continued visitor growth, and no severe capacity restrictions across Dubai and Abu Dhabi.
7.1%
Forecast CAGR
$3,018 Mn
2030 Projection
Base Year
2025
Historical Period
2020-2025
Forecast Period
2026-2031
Historical CAGR
7.6%
CHAPTER 2 - SCOPE OF REPORT
Scope of the Market
CHAPTER 3 - Key Stakeholders
Key Target Audience
Key stakeholders who can leverage from this market analysis for investment, strategy, and operational planning.
Investors
CAGR, fleet returns, utilization, EBITDA margin, regulatory risk
Corporates
mobility spend, service levels, account pricing, airport coverage
Government
licensing, electrification, congestion, accessibility, autonomous safety, compliance
Operators
fleet productivity, dispatch density, driver economics, charging readiness
Financial institutions
vehicle finance, residual values, covenants, cash-flow stability
CHAPTER 4 - Market Size & Growth
Market Size, Growth Forecast and Trends
This section evaluates the historical market size, analyzes year-over-year growth dynamics, and presents forecast projections supported by market performance indicators and demand-side drivers.
Historical & Projected Market Size ($ Million)
Year-over-Year Growth Rate (%)
Market Value vs Volume Growth (%)
Historical Market Performance (2020-2025)
Historical performance was shaped by a low 2020 utilization base followed by a strong 2022 recovery, when market value increased 12.6% and passenger trips rose 12.5%. Growth moderated to 5.2% in 2025 as the market normalized, despite 221 million estimated trips. The key inflection was digital dispatch: e-hail booking penetration rose from 18% in 2020 to 62% in 2025. Dubai accounted for an estimated 67% of value, reflecting its higher fare realization, tourism density, airport traffic, and larger regulated fleet. The historical period therefore combined volume recovery with improving fleet productivity rather than broad tariff inflation.
Forecast Market Outlook (2026-2031)
Forecast growth is expected to accelerate gradually from 6.5% in 2026 to 8.2% in 2031 as autonomous deployment, app-booking penetration, and premium airport mobility expand. Passenger trips are projected to reach 304 million by 2031, while the average fare per trip increases from USD 9.05 in 2025 to USD 9.93. The e-hail channel should capture 88% of bookings and the licensed fleet should reach 34,500 vehicles. Value growth is expected to exceed volume growth after 2027 because app surcharges, premium vehicle mix, and regulated tariff adjustments improve revenue per trip without relying solely on new fleet additions.
CHAPTER 5 - Market Data
Market Breakdown
The UAE Taxi Market is moving from a fleet-capacity model toward a digitally orchestrated mobility network. For CEOs and investors, the critical levers are trip density, fare realization, e-hail conversion, and the capital efficiency of low-emission fleet expansion.
Year | Market Size (USD Mn) | YoY Growth (%) | Licensed Taxi Fleet (Units) | Passenger Trips (Mn) | E-Hail Booking Share (%) | Period |
|---|---|---|---|---|---|---|
| 2020 | $1,387 Mn | +- | 20,200 | 150.0 | Forecast | |
| 2021 | $1,476 Mn | +6.4% | 20,700 | 160.0 | Forecast | |
| 2022 | $1,662 Mn | +12.6% | 22,000 | 180.0 | Forecast | |
| 2023 | $1,798 Mn | +8.2% | 23,200 | 194.0 | Forecast | |
| 2024 | $1,901 Mn | +5.7% | 24,600 | 208.0 | Forecast | |
| 2025 | $2,000 Mn | +5.2% | 25,800 | 221.0 | Forecast | |
| 2026 | $2,130 Mn | +6.5% | 27,000 | 233.0 | Forecast | |
| 2027 | $2,270 Mn | +6.6% | 28,300 | 246.0 | Forecast | |
| 2028 | $2,425 Mn | +6.8% | 29,700 | 259.0 | Forecast | |
| 2029 | $2,595 Mn | +7.0% | 31,200 | 273.0 | Forecast | |
| 2030 | $2,790 Mn | +7.5% | 32,800 | 288.0 | Forecast | |
| 2031 | $3,018 Mn | +8.2% | 34,500 | 304.0 | Forecast |
Licensed Taxi Fleet
25,800 vehicles, 2025, UAE. Fleet scale determines service availability and capital intensity. Dubai added 600 taxis during 2025, increasing its fleet by 6% while moving 90% of operational taxis to hybrid or electric powertrains.
Passenger Trips
221 million trips, 2025, UAE. Trip density is the principal revenue and utilization lever. Dubai recorded 59.5 million taxi trips in H1 2025, 7% above H1 2024, indicating that demand growth exceeded mature-market population growth.
E-Hail Booking Share
62%, 2025, UAE. Digital dispatch improves matching, reduces dead kilometres, and strengthens platform bargaining power. Abu Dhabi already recorded 88% of trips through smart platforms in 2024, demonstrating the achievable ceiling for countrywide adoption.
CHAPTER 6 - Segmentation
Market Segmentation Framework
Comprehensive analysis across key dimensions providing insights into market structure, consumer preferences, and distribution patterns.
No of Segments
7
Dominant Segment
Service Type
Fastest Growing Segment
Booking Channel
Service Type
Customer Type
Application
Operating Model
Revenue Model
Booking Channel
Geography
Key Segmentation Takeaways
Comprehensive analysis across all extracted segmentation dimensions providing insights into market structure, consumer preferences, and distribution patterns.
Service Type
Service Type is the dominant dimension because fare realization, licensing requirements, vehicle standards, and customer expectations differ materially across e-hail taxi, metered street taxi, airport taxi, and limousine services. E-Hail Taxi is the largest Level-2 pool, supported by smart-platform booking penetration, regulated fleet integration, digital payments, and shorter customer waiting times.
Booking Channel
Booking Channel is the fastest-growing dimension as operators migrate from roadside demand capture toward mobile application dispatch. Mobile Application bookings expand utilization visibility, enable peak pricing or booking fees, improve customer retention, and support fleet-wide data analytics. Bolt, Zed, Careem, and Hala integration will accelerate app-led share gains across Dubai and adjacent emirates.
CHAPTER 7 - Regional Analysis
Regional Analysis
The UAE ranks second among selected GCC taxi markets by estimated 2025 gross passenger fare revenue, behind Saudi Arabia but ahead of Qatar, Kuwait, Oman, and Bahrain. Its position reflects concentrated urban demand, high visitor throughput, regulated fleet capacity, and advanced smart-platform penetration.
Focus Country Ranking
2nd
Focus Country Market Size
USD 2,000 Mn (2025)
UAE CAGR (2026-2031)
7.1%
Focus Country Ranking
2nd
Focus Country Market Size
USD 2,000 Mn (2025)
UAE CAGR (2026-2031)
7.1%
Regional Analysis (Current Year)
Market Position
The UAE holds second position with USD 2,000 million in 2025, supported by Dubai and Abu Dhabi, which together account for about 90% of national value.
Growth Advantage
The UAE forecast CAGR of 7.1% exceeds Qatar at 3.1% and Bahrain at 4.8%, but trails Saudi Arabia as tourism and platform liberalization accelerate there.
Competitive Strengths
Dubai recorded 115 million taxi trips in 2024, Abu Dhabi achieved 88% smart booking, and Dubai reached 90% hybrid or electric fleet penetration in 2025.
CHAPTER 8 - INDUSTRY ANALYSIS
Growth Drivers, Market Challenges & Market Opportunities
Comprehensive analysis of key factors shaping the UAE Taxi Market, including growth catalysts, operational challenges, and emerging opportunities across production, distribution, and consumer segments.
Growth Drivers
Tourism and Airport Mobility Intensity
- Dubai tourism increased 9% (2024, Dubai), expanding fare pools around hotels, malls, beaches, and visitor attractions where taxis retain high convenience value.
- Dubai International handled 46 million passengers (H1 2025, Dubai), creating recurring airport queue demand and supporting higher-yield terminal trips for licensed operators.
- Dubai Taxi Company completed 5.5 million airport taxi trips (2025, Dubai), confirming that airport concessions form a defensible profit pool for scaled fleets.
Population Density and Daily Commuter Inflow
- Dubai had 4.25 million usual residents (2024, Dubai), creating a large base for commuting, retail, healthcare, education, and leisure mobility.
- External workers and temporary residents added 1.69 million active individuals (2024, Dubai), increasing weekday demand beyond resident-only transport planning.
- The UAE population reached 11.51 million (2025, UAE), supporting national fleet expansion and extending platform economics beyond Dubai and Abu Dhabi.
Digital Dispatch and Platform Integration
- Hala peak-hour share reached 50% (2024, Dubai), demonstrating customer migration from roadside hailing toward predictable app-based pickup.
- DTC and Kabi integrated 9,880 taxis (2025, Dubai) into Bolt and Zed, increasing platform liquidity and reducing customer search friction.
- DTC average revenue per trip reached AED 41 (2025, Dubai), showing that digital mix and tariff discipline can lift monetization without equivalent fleet growth.
Market Challenges
Regulated Tariffs Limit Cost Pass-Through
- Abu Dhabi applied AED 1.82 per kilometre (2025, Abu Dhabi), making utilization and route efficiency more important than discretionary fare increases.
- DTC taxi gross margin was 25% (2025, Dubai), leaving operators exposed when labour, financing, maintenance, or platform acquisition costs rise faster than regulated fares.
- DTC taxi utilization measured 81.2% (2025, Dubai), indicating that idle capacity management remains a direct margin lever under controlled pricing.
Peak-Demand Imbalance and Congestion Exposure
- Dubai carried 103.5 million taxi passengers (H1 2025, Dubai), creating strong peaks around flight banks, events, weekends, and evening leisure demand.
- Dubai had 1.69 million non-resident active individuals (2024, Dubai), increasing cross-emirate commuting and empty repositioning risk outside peak directions.
- Hala reduced average waiting time from 11.4 to 3.7 minutes (reported 2022, Dubai), setting a demanding service benchmark that smaller fleets must match.
Fleet Transition Capital and Technology Risk
- Dubai targets 100% eco-friendly taxis by 2040 (Dubai), requiring sustained vehicle renewal, charging access, battery management, and residual-value planning.
- DTC operated 401 fully electric taxis (September 2025, Dubai), showing that early scale remains modest relative to the full regulated fleet.
- Autonomous deployment depends on permits and technology partners, while Dubai targets 25% autonomous transport by 2030 (Dubai), creating execution and cybersecurity exposure.
Market Opportunities
Cross-Emirate E-Hail Network Expansion
- platform commissions, booking fees, and data-led fleet services become scalable when 62% of UAE bookings (2025 estimate) are digitally dispatched.
- fleet operators, aggregators, and drivers gain from higher booking density, while Hala already serves Dubai and Ras Al Khaimah (2025, UAE).
- interoperable licensing and data standards are needed to extend app coverage beyond the two largest emirates and reduce fragmented dispatch systems.
Airport and Hospitality Mobility Products
- airport queues, advance booking, multi-passenger vehicles, and hotel partnerships can exceed standard fare yields as DXB handled 46 million passengers (H1 2025).
- operators with airport concessions, hospitality alliances, and premium fleets can capture tourists, executives, and families during 19.6 million visitor arrivals (2025, Dubai).
- capacity planning must align with flight banks, terminal expansion, and pre-booking rules to preserve service levels during record passenger throughput.
Autonomous and Electric Taxi Platforms
- higher operating hours and lower driver dependence can improve unit economics as commercial fleets scale toward over 1,000 vehicles (planned, Dubai).
- licensed operators, autonomous technology providers, charging companies, insurers, and fleet financiers can participate in a new mobility asset class.
- safety certification, geofenced operating domains, remote supervision, liability rules, and charging availability must mature before the 25% autonomous target (2030, Dubai).
CHAPTER 9 - Competitive Landscape
Competitive Landscape Overview
The market is moderately concentrated by licensed fleet capacity, with high regulatory entry barriers and intensifying competition through e-hail partnerships, airport concessions, low-emission fleets, and autonomous technology alliances.
Market Share Distribution
Top 5 Players
Market Dynamics
8 new entrants in the past 5 years, indicating strong market attractiveness and growth potential.
Company Name | Market Share | Headquarters | Founding Year | Core Market Focus |
|---|---|---|---|---|
Dubai Taxi Company PJSC | 44% of Dubai taxi fleet (2023) | Dubai, UAE | 1994 | Regulated taxis, airport taxis, limousines, e-hail integration |
Kabi by Al Ghurair | - | Dubai, UAE | - | Taxi fleet operations, digital mobility, Bolt and Zed integration |
National Taxi LLC | - | Dubai, UAE | 2000 | Licensed taxi operations across Dubai, Abu Dhabi, and Al Ain |
Arabia Taxi LLC | - | Dubai, UAE | 2005 | Regulated taxi fleet operations in Dubai and Abu Dhabi |
Cars Taxi | - | Dubai, UAE | - | Dubai taxi franchise operations and app-dispatched trips |
Metro Taxi | - | Dubai, UAE | - | Regulated metered taxi operations in Dubai |
City Taxi | - | Dubai, UAE | - | Dubai franchise taxi fleet and rank-based services |
Tawasul Transport | - | Abu Dhabi, UAE | 2007 | Abu Dhabi taxis, limousines, and autonomous mobility operations |
Hala | - | Dubai, UAE | 2019 | E-hail taxi dispatch through the Careem platform |
Uber UAE | - | San Francisco, United States | 2009 | Ride-hailing, licensed limousine dispatch, and autonomous partnerships |
Cross Comparison Parameters
The report provides detailed cross-comparison of key players across 10 performance parameters to identify competitive strengths and weaknesses.
Taxi Fleet Size
Trips per Vehicle per Day
Revenue per Trip
EBITDA Margin
Analysis Covered
Market Share Analysis:
Compares licensed fleet scale, trip volumes, and geographic operating concentration.
Cross Comparison Matrix:
Benchmarks utilization, digital reach, revenue quality, and fleet sustainability.
SWOT Analysis:
Assesses regulatory advantages, operating gaps, technology risks, and expansion options.
Pricing Strategy Analysis:
Evaluates regulated fares, booking surcharges, premium tiers, and contracts.
Company Profiles:
Reviews ownership, service focus, fleet capabilities, partnerships, and positioning.
CHAPTER 10 - REPORT TOC
CHAPTER 14 - Table Of Contents
Phase 1Market Assessment Phase
11
Chapters
Supply-side and competitive intelligence covering market sizing, segmentation, competitive dynamics, regulatory landscape, and future forecasts.
Phase 2Go-To-Market Strategy Phase
15
Chapters
Entry strategy evaluation, execution roadmap, partner recommendations, and profitability outlook.
Complete Report Coverage
201+ detailed sections covering every aspect of the market
143
Assessment Sections
58
Strategy Sections
CHAPTER 11 - Our Approach
Research Methodology
Desk Research
- Compile emirate taxi fleet statistics
- Review regulated fare and licensing rules
- Extract operator trip and revenue disclosures
- Map tourism and airport demand indicators
Primary Research
- Interview taxi fleet operations directors
- Consult e-hail platform country managers
- Survey taxi drivers and dispatch supervisors
- Engage airport mobility procurement managers
Validation and Triangulation
- Validate assumptions across 372 respondents
- Reconcile trip volumes with fleet productivity
- Cross-check fares against operator revenue
- Test emirate shares with demand proxies
CHAPTER 12 - FAQ
FAQs
Still have questions?
Our research team is here to help you find the right solution
CHAPTER 13 - Related Research
Explore Related Reports
Expand your market intelligence with complementary research across regions and adjacent markets.
Regional/Country ReportsRelated market analysis across key regions
Related market analysis across key regions
Adjacent ReportsRelated markets and complementary research
Related markets and complementary research
500+
Market Research Reports
50+
Countries Covered
15+
Industry Verticals