CHAPTER 1 - MARKET SUMMARY
Market Overview
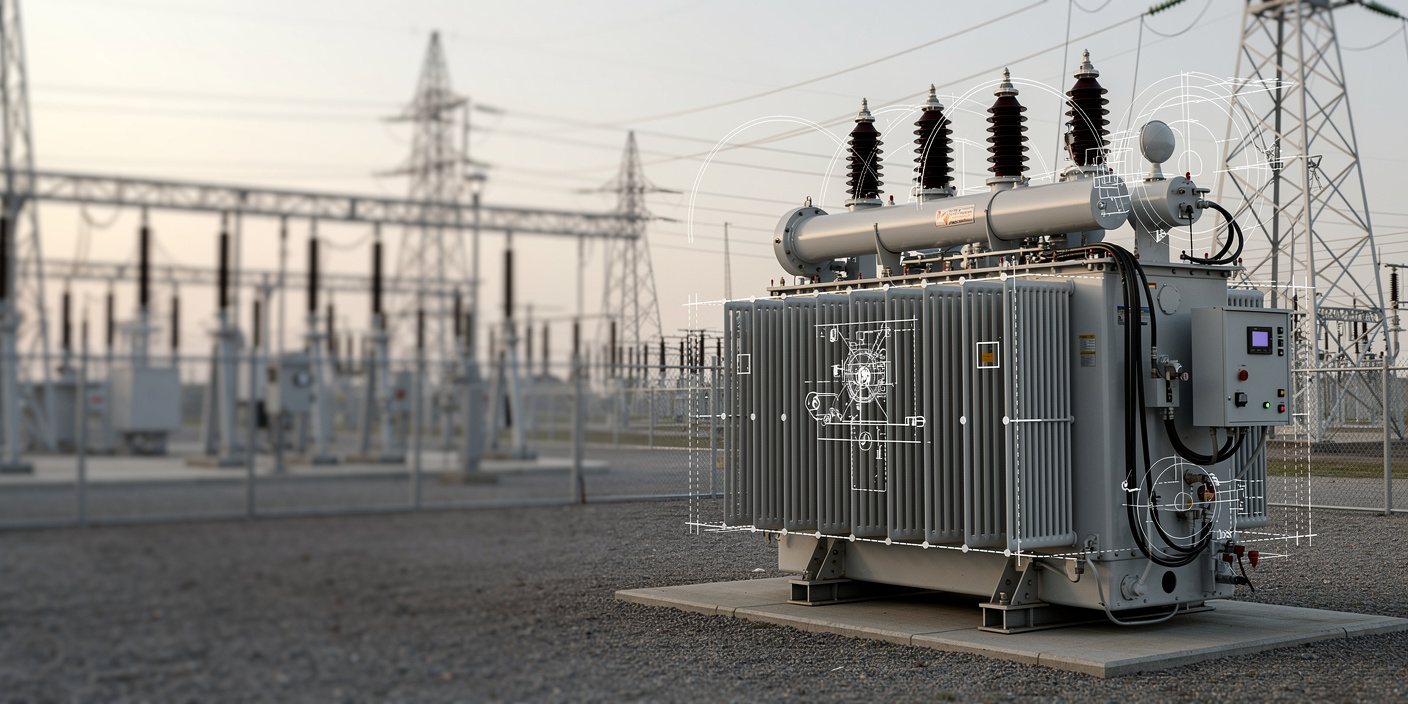
The United States Large Power Transformer Market connects generation assets, transmission networks and high-load consumption centers through generator step-up, autotransformer and substation units rated above 100 MVA. Approximately 90% of U.S. electricity consumption passes through at least one large power transformer, making procurement availability directly relevant to generation commissioning, congestion management and grid reliability.
The South is the largest demand and manufacturing hub, supported by ERCOT load growth, Southeast utility investment, Gulf Coast industrial expansion and transformer plants in Virginia, North Carolina, Alabama, Georgia, Tennessee and Missouri. U.S. utility transmission spending reached USD 27.7 billion in 2023, almost three times the 2003 level, increasing order flow for transmission station equipment and high-voltage transformers.
Market Value
USD 2,110 million
2025
Dominant Region
South
2025
Dominant Segment
Generator Step-Up Transformers
fastest growing, 2026-2031
Total Number of Players
61
Future Outlook
The United States Large Power Transformer Market is projected to increase from USD 2,110 million in 2025 to USD 3,244 million by 2031. The historical market expanded at 10.55% annually during 2020-2025 as raw-material inflation, constrained factory capacity and higher utility procurement raised both unit demand and average selling prices. Forecast growth moderates to 7.43% during 2026-2031 as domestic manufacturing additions gradually improve availability. Generator step-up transformers, autotransformers and extra-high-voltage substation units will capture the largest incremental demand from new generation, regional transmission plans, industrial electrification and high-density data-center clusters.
Market volume is forecast to increase from approximately 1,060 large power transformer equivalent units in 2025 to 1,470 units by 2031, representing a 5.60% volume CAGR. Average selling prices are expected to rise more slowly, from USD 1.99 million per equivalent unit to USD 2.21 million, as copper, grain-oriented electrical steel, bushings, testing and logistics costs remain elevated. Domestic supply could rise from about 20% of requirements in 2025 to 35% by 2031 if announced factories reach schedule. Investors should prioritize manufacturers with qualified utility relationships, testing capacity, skilled winding labor and secured materials.
7.43%
Forecast CAGR
$3,244 Mn
2030 Projection
Base Year
2025
Historical Period
2020-2025
Forecast Period
2026-2031
Historical CAGR
10.55%
CHAPTER 2 - SCOPE OF REPORT
Scope of the Market
CHAPTER 3 - Key Stakeholders
Key Target Audience
Key stakeholders who can leverage from this market analysis for investment, strategy and operational planning.
Investors
CAGR, backlog conversion, capex intensity, margin, localization risk
Corporates
factory slots, escalation clauses, qualification, testing, supplier concentration
Government
domestic capacity, grid resilience, employment, trade exposure, reliability
Operators
lead times, spares, asset health, outages, refurbishment economics
Financial institutions
project finance, cancellation risk, covenants, backlog quality, cash flow
CHAPTER 4 - Market Size & Growth
Market Size, Growth Forecast and Trends
This section evaluates the historical market size, analyzes year-over-year growth dynamics, and presents forecast projections supported by market performance indicators and demand-side drivers.
Historical & Projected Market Size ($ Million)
Year-over-Year Growth Rate (%)
Market Value vs Volume Growth (%)
Historical Market Performance (2020-2025)
Historical market value increased by USD 832 million between 2020 and 2025. Growth peaked at 11.7% in 2024 as imported transformer values, copper-intensive equipment prices and utility station investment increased concurrently. Equivalent unit demand rose from approximately 830 units to 1,060 units, but value growth exceeded volume growth because average selling prices increased from USD 1.54 million to USD 1.99 million. The strongest inflection occurred during 2022-2024, when qualified factory slots became scarce and utilities extended procurement horizons to secure delivery capacity.
Forecast Market Outlook (2026-2031)
Forecast growth remains above the expected expansion of general utility capital expenditure because LPT procurement is concentrated in transmission expansion, generator interconnections and large-load projects. Market value is projected to reach USD 3,244 million by 2031, supported by 1,470 equivalent units and a forecast ASP of USD 2.21 million. Growth gradually moderates from 7.8% in 2026 to 6.9% in 2031 as new domestic plants, refurbishment capacity and international suppliers reduce the extreme scarcity premium. Generator step-up and extra-high-voltage units retain the strongest pricing power.
CHAPTER 5 - Market Data
Market Breakdown
The market combines a rising volume of grid and generation projects with elevated pricing caused by long qualification cycles and constrained factory capacity. CEOs and investors should monitor unit deliveries, average selling prices and import dependence because these indicators determine revenue conversion, margins and project execution risk.
Year | Market Size (USD Mn) | YoY Growth (%) | LPT Equivalent Units | Average Selling Price (USD Mn/Unit) | Import Dependence (%) | Period |
|---|---|---|---|---|---|---|
| 2020 | $1,278 Mn | +- | 830 | 1.54 | Forecast | |
| 2021 | $1,389 Mn | +8.7% | 860 | 1.62 | Forecast | |
| 2022 | $1,547 Mn | +11.4% | 905 | 1.71 | Forecast | |
| 2023 | $1,723 Mn | +11.4% | 950 | 1.81 | Forecast | |
| 2024 | $1,925 Mn | +11.7% | 1,000 | 1.93 | Forecast | |
| 2025 | $2,110 Mn | +9.6% | 1,060 | 1.99 | Forecast | |
| 2026 | $2,275 Mn | +7.8% | 1,125 | 2.02 | Forecast | |
| 2027 | $2,450 Mn | +7.7% | 1,192 | 2.06 | Forecast | |
| 2028 | $2,636 Mn | +7.6% | 1,260 | 2.09 | Forecast | |
| 2029 | $2,831 Mn | +7.4% | 1,330 | 2.13 | Forecast | |
| 2030 | $3,035 Mn | +7.2% | 1,400 | 2.17 | Forecast | |
| 2031 | $3,244 Mn | +6.9% | 1,470 | 2.21 | Forecast |
LPT Equivalent Units
1,060 units, 2025, United States. Volume growth indicates physical factory loading and installation demand. DOE previously identified 750 units above 60 MVA in 2019 and expected demand near 900 units by 2027, before recent data-center acceleration.
Average Selling Price
USD 1.99 million per unit, 2025, United States. Pricing reflects a weighted mix of substation, generator step-up, autotransformer and high-voltage units. Transformer prices increased approximately 70%-100% from 2020 amid material inflation and manufacturing scarcity.
Import Dependence
80%, 2025, United States. High import dependence increases tariff, currency and shipping exposure while supporting premium economics for localized production. Siemens Energy reported that domestic supply met only 20% of U.S. LPT demand.
CHAPTER 6 - Segmentation
Market Segmentation Framework
Comprehensive analysis across key dimensions providing insights into market structure, customer requirements, technical specifications and procurement patterns.
No of Segments
7
Dominant Segment
Application
Fastest Growing Segment
End-Use Industry
Power Rating
Cooling Type
Application
End-Use Industry
Customer Type
Sales Channel
Geography
Key Segmentation Takeaways
Comprehensive analysis across all extracted segmentation dimensions providing insights into market structure, technical requirements, customer behavior and procurement patterns.
Application
Application is the dominant segmentation dimension because generator step-up, substation step-down and autotransformer units have materially different voltage, cooling, testing and procurement requirements. Substation step-down transformers currently represent the broadest installed demand base, while generator step-up units command higher project-specific prices and longer engineering cycles.
End-Use Industry
End-Use Industry is the fastest-growing dimension as data centers, renewable power projects and advanced manufacturing generate new load and interconnection requirements. Data centers are the fastest-growing Level-2 sub-segment because large campuses require dedicated substations, redundant feeds and utility system upgrades that pull forward transformer procurement several years before commissioning.
CHAPTER 7 - Regional Analysis
Regional Analysis
The United States ranks first among selected adjacent and manufacturing-peer markets by large power transformer revenue. Its position reflects the scale of electricity consumption, extensive transmission infrastructure, data-center investment and elevated replacement demand, although import dependence remains materially higher than in Germany and South Korea.
Focus Country Ranking
1st
Focus Country Market Size
USD 2.11 Bn (2025)
United States CAGR (2026-2031)
7.43%
Focus Country Ranking
1st
Focus Country Market Size
USD 2.11 Bn (2025)
United States CAGR (2026-2031)
7.43%
Regional Analysis (Current Year)
Regional Analysis Comparison
Market Position
The United States ranks first with a USD 2.11 billion market, supported by approximately 4,300 TWh of annual generation and the world's largest concentration of utility and data-center capital projects.
Growth Advantage
The 7.43% U.S. CAGR exceeds Germany's 5.80% and Canada's 5.40%, reflecting faster load growth, higher replacement requirements and a larger pipeline of generation interconnection and transmission projects.
Competitive Strengths
Strengths include USD 27.7 billion of annual transmission spending, a 20-year FERC planning horizon and multiple announced factories, although domestic producers currently satisfy only about 20% of LPT demand.
CHAPTER 8 - INDUSTRY ANALYSIS
Growth Drivers, Market Challenges & Market Opportunities
Comprehensive analysis of key factors shaping the United States Large Power Transformer Market, including growth catalysts, operational challenges and emerging opportunities across production, distribution and end-user segments.
Growth Drivers
Transmission Expansion and Grid Modernization
- Transmission capital investment increased 11% in 2023 (EIA, United States), with USD 1.0 billion of the increase allocated to station equipment, directly supporting transformer, breaker and control-system procurement.
- Independent estimates indicate transmission capacity may need to expand 60% by 2030 (DOE, United States), increasing the number and rating of autotransformers, phase-shifting transformers and bulk-power substations.
- The DOE Transmission Facilitation Program has a USD 2.5 billion revolving fund (2024, United States), reducing financing barriers for large transmission projects that require multiple high-value LPTs.
Data Centers and Large-Load Interconnections
- Data-center electrical capacity is projected to increase from approximately 24 GW to 110 GW by 2030 (Wood Mackenzie, United States), requiring high-capacity substations, redundant utility feeds and grid reinforcements.
- Generator step-up transformer demand increased 274% since 2019 (industry survey, United States), strengthening the order books of OEMs serving utility-scale generation and behind-the-meter power projects.
- Substation transformer demand increased 116% since 2019 (industry survey, United States), shifting procurement toward multi-year framework contracts and advance reservation of testing and production slots.
Aging Installed Base and Reliability Requirements
- DOE estimated an installed base of 4,900-6,799 LPTs in 2022 (United States), giving utilities a substantial population requiring condition monitoring, refurbishment, spares and eventual replacement.
- The average large-transformer service age is approximately 40 years (DOE, United States), while some units have operated for more than 70 years, increasing failure and maintenance risk.
- Approximately 90% of consumed U.S. electricity (DOE) flows through at least one LPT, supporting regulatory and utility willingness to fund spares, resilience designs and accelerated replacement programs.
Market Challenges
Import Dependence and Extended Lead Times
- Domestic manufacturing currently meets only 20% of U.S. requirements (Siemens Energy, 2024), limiting utilities' ability to substitute suppliers when international production slots become constrained.
- Large power transformer lead times can reach up to five years (2024, United States), requiring procurement before final project engineering and increasing cancellation, specification and financing risks.
- Generator step-up transformer lead times exceeded 160 weeks in early 2026 (United States), delaying power-plant, renewable and data-center energization when equipment is not reserved during early development.
Raw-Material and Tariff Exposure
- The United States has only one domestic producer of grain-oriented electrical steel (DOE, 2024), creating concentration risk for a material essential to transformer efficiency and core performance.
- Potential tariffs on metals and imported equipment could add 8%-9% to transformer prices (Wood Mackenzie, 2025), challenging fixed-price EPC contracts and regulated utility cost recovery.
- Imported GOES historically represented about 20% market penetration (DOE, United States), while transformer cores and laminations create additional indirect foreign-material exposure.
Manufacturing, Testing and Skilled-Labor Constraints
- Siemens Energy's Charlotte factory will create almost 600 direct jobs (2024 announcement), illustrating the labor intensity of localized large-transformer production and testing.
- Hitachi Energy's South Boston expansion is expected to create more than 800 jobs by 2028 (Virginia, United States), increasing competition for engineers, winders, welders and high-voltage technicians.
- Siemens Energy's initial production plan reaches only 57 LPTs annually at full capacity (Charlotte), indicating that even large investments add supply gradually relative to national requirements.
Market Opportunities
Domestic Manufacturing Capacity Expansion
- Siemens Energy is investing USD 150 million in Charlotte (2024), offering suppliers and investors exposure to a facility designed for 57 LPTs and 24 refurbishments annually at maturity.
- Hitachi allocated USD 457 million to a Virginia LPT factory (2025), strengthening domestic production and creating opportunities in cores, tanks, bushings, copper conductors and testing systems.
- HD Hyundai Electric announced approximately USD 200 million of U.S. expansion investment (2026) to raise extra-high-voltage transformer capacity by 50% and add 765 kV capability.
Refurbishment, Life Extension and Spare Programs
- Siemens Energy plans refurbishment capacity of up to 24 LPTs annually (Charlotte), demonstrating monetizable demand for repair, oil processing, rewinding, testing and upgrade services.
- DOE reported spare inventories at 116% of LPTs located in the most crucial substations (2016 assessment), supporting structured spare-pool management, transport readiness and shared inventory services.
- Asset owners can defer replacement by using diagnostics and refurbishment on equipment with an average age near 40 years (DOE, United States), provided insulation, bushings and windings remain technically recoverable.
Advanced, Flexible and Standardized Transformer Designs
- Flexible designs can reduce replacement delays by enabling common interfaces across voltage classes, improving the utilization of emergency units and shared spares across multiple utilities. The FITT program selected nine projects in 2024.
- Digital dissolved-gas analysis, bushing monitoring and thermal analytics can extend service life and prevent failures across an installed base of 4,900-6,799 units (DOE, 2022).
- FERC's 20-year regional planning requirement (Order No. 1920) creates earlier visibility into equipment specifications, allowing OEMs to standardize platforms and utilities to aggregate demand.
CHAPTER 9 - Competitive Landscape
Competitive Landscape Overview
The market is moderately concentrated, with the top ten suppliers representing an estimated 82% of 2025 revenue. Utility qualification requirements, testing infrastructure, engineering capability and multi-year lead times create substantial entry barriers.
Market Share Distribution
Top 5 Players
Market Dynamics
8 new entrants in the past 5 years, indicating strong market attractiveness and growth potential.
Company Name | Market Share | Headquarters | Founding Year | Core Market Focus |
|---|---|---|---|---|
Hitachi Energy | 16.0% estimated | Zurich, Switzerland | 2020 | Large power transformers, generator step-up units, grid integration and lifecycle services |
GE Vernova | 14.0% estimated | Cambridge, United States | 2024 | Prolec GE transformer portfolio, utility transformers and North American manufacturing |
Siemens Energy | 11.0% estimated | Munich, Germany | 2020 | Large power transformers, generator transformers, repair and refurbishment |
HD Hyundai Electric | 10.0% estimated | Seongnam, South Korea | 2017 | Extra-high-voltage transformers, 765 kV systems and utility applications |
Virginia Transformer | 9.0% estimated | Roanoke, United States | 1971 | Custom power transformers for utilities, data centers, renewables and industry |
Hyosung HICO | 7.0% estimated | Memphis, United States | - | Large and extra-high-voltage power transformers for utility substations |
Mitsubishi Electric Power Products | 6.0% estimated | Warrendale, United States | 1985 | High-voltage transformers, grid equipment and power-system solutions |
WEG Transformers USA | 4.0% estimated | Washington, United States | 1961 | Power and specialty transformers for utility, renewable and industrial projects |
Delta Star | 3.0% estimated | Lynchburg, United States | 1908 | Power transformers, mobile substations, field services and emergency response |
Pennsylvania Transformer Technology | 2.0% estimated | Canonsburg, United States | 1929 | Utility power transformers, generator step-up transformers and custom designs |
Cross Comparison Parameters
The report provides detailed cross-comparison of key players across 10 performance parameters to identify competitive strengths and weaknesses.
Annual LPT Production Capacity
Average Order Lead Time
U.S. Transformer Revenue Growth
Transformer Segment EBITDA Margin
Analysis Covered
Market Share Analysis:
Compares estimated supplier revenue concentration across United States customer groups
Cross Comparison Matrix:
Benchmarks capacity, lead times, revenue growth and operating margins
SWOT Analysis:
Assesses manufacturing depth, qualification access, supply risks and expansion
Pricing Strategy Analysis:
Reviews specification premiums, escalation clauses and reserved production slots
Company Profiles:
Evaluates portfolios, factories, customer focus and current investment programs
CHAPTER 10 - REPORT TOC
Table of Contents
Market Assessment Phase
Supply-side and competitive intelligence covering market sizing, segmentation, competitive dynamics, regulatory landscape and future forecasts.
Go-To-Market Strategy Phase
15 chapters
Entry strategy evaluation, execution roadmap, partner recommendations and profitability outlook.
Survey Phase
8 chapters
Demand-side primary research conducted through structured interviews and online surveys with end users across priority metros and Tier 2/3 cities to capture consumption behavior, unmet needs and purchase drivers.
Complete Report Coverage
201+ detailed sections covering every aspect of the market
143
Assessment Sections
58
Strategy Sections
CHAPTER 11 - Our Approach
Research Methodology
Desk Research
- Reviewed utility transmission capital expenditure
- Analyzed transformer import and export flows
- Mapped domestic manufacturing and testing capacity
- Assessed grid policy and project pipelines
Primary Research
- Interviewed transformer plant operations directors
- Consulted utility transmission planning executives
- Engaged substation engineering and procurement managers
- Interviewed heavy-haul logistics project leaders
Validation and Triangulation
- Validated findings across 390 respondents
- Reconciled revenue, units and pricing
- Cross-checked imports against supplier capacity
- Stress-tested base and forecast scenarios
CHAPTER 12 - FAQ
FAQs
Still have questions?
Our research team is here to help you find the right solution
CHAPTER 13 - Related Research
Explore Related Reports
Expand your market intelligence with complementary research across regions and adjacent markets.
Regional/Country ReportsRelated market analysis across key regions
Related market analysis across key regions
- Indonesia Large Power Transformer Market
- Vietnam Large Power Transformer Market
- Thailand Large Power Transformer Market
- Malaysia Large Power Transformer Market
- Philippines Large Power Transformer Market
Adjacent ReportsRelated markets and complementary research
Related markets and complementary research
- South Africa High-Voltage Switchgear Market
- Vietnam Power Grid Upgrades Market
- Qatar Transmission Station Equipment Market
- KSA Copper Market
- South Korea Grain-Oriented Electrical Steel Market
500+
Market Research Reports
50+
Countries Covered
15+
Industry Verticals