CHAPTER 1 - MARKET SUMMARY
Market Overview
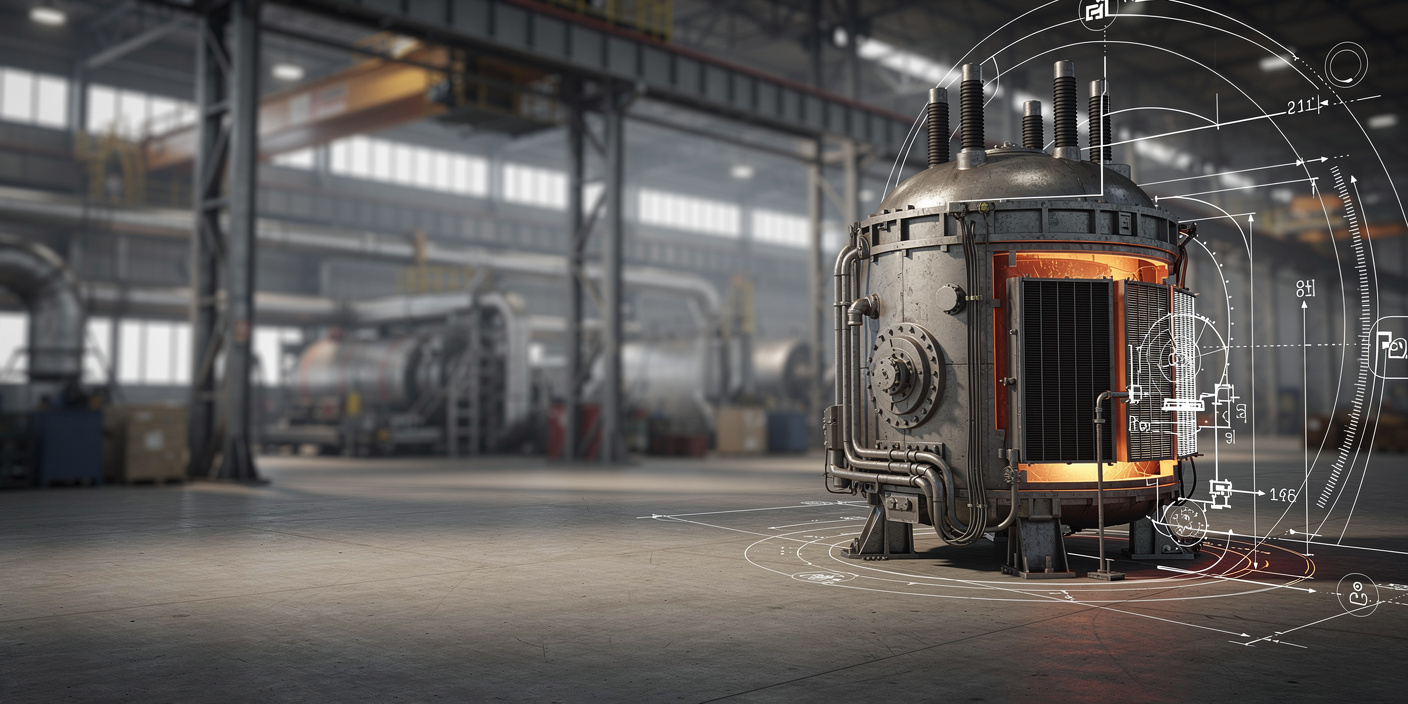
The USA Electric Arc Furnace Market serves steel producers through furnace vessels, transformers, electrode regulation, off-gas systems, automation, engineering, rebuilds, and lifecycle services. Electric furnaces produced 71.8% of 79.5 million metric tons of U.S. crude steel in 2024. This high process penetration creates recurring demand for upgrades and maintenance even when greenfield mill construction slows.
Demand is concentrated across the Midwest and South, where steelmaking clusters combine scrap availability, rail access, industrial power, and downstream manufacturing. Indiana generated 19% of U.S. raw steel output in 2025, followed by Ohio at 8%, Texas at 5%, and Pennsylvania at 4%. Suppliers with regional field-service coverage can reduce outage duration and capture higher-value modernization contracts.
Market Value
USD 1,520 Mn
2025
Dominant Region
Midwest and South Industrial Belt
Dominant Segment
Product Type
AC Electric Arc Furnaces
Total Number of Players
38
Future Outlook
The USA Electric Arc Furnace Market is projected to expand from USD 1,520 Mn in 2025 to USD 2,449 Mn by 2031, representing an 8.3% forecast CAGR versus 7.8% during 2020-2025. Growth will be supported by large sheet-mill projects, furnace replacement cycles, power-system upgrades, scrap preheating, off-gas recovery, and advanced automation. Annual EAF steel output is modeled to increase from 59.0 million metric tons in 2025 to 74.5 million metric tons by 2031 as additional capacity enters service and existing facilities raise throughput.
Profit pools should shift toward integrated technology packages that combine furnace hardware, electrical systems, emissions capture, dynamic process control, and long-term service agreements. The strongest opportunities will arise where suppliers can document lower tap-to-tap time, reduced electricity consumption, higher metallic yield, lower electrode use, and improved availability. Investors should prioritize vendors with U.S. service infrastructure, proven references in high-power AC furnaces, digital optimization capability, and exposure to both greenfield installations and recurring brownfield modernization programs.
8.3%
Forecast CAGR
$2,449 Mn
2030 Projection
Base Year
2025
Historical Period
2020-2025
Forecast Period
2026-2031
Historical CAGR
7.8%
CHAPTER 2 - SCOPE OF REPORT
Scope of the Market
CHAPTER 3 - Key Stakeholders
Key Target Audience
Key stakeholders who can leverage from this market analysis for investment, strategy, and operational planning.
Investors
CAGR, backlog conversion, capex cycles, technology risk
Corporates
furnace productivity, energy cost, yield, maintenance economics
Government
industrial capacity, emissions, grid load, trade resilience
Operators
tap time, electrode use, uptime, metallic yield
Financial institutions
project finance, covenants, utilization, counterparty strength
CHAPTER 4 - Market Size & Growth
Market Size, Growth Forecast and Trends
This section evaluates the historical market size, analyzes year-over-year growth dynamics, and presents forecast projections supported by market performance indicators and demand-side drivers.
Historical & Projected Market Size ($ Million)
Year-over-Year Growth Rate (%)
Market Value vs Volume Growth (%)
Historical Market Performance (2020-2025)
Market revenue expanded at a 7.8% CAGR through 2025. The strongest annual increase was 10.4% in 2022, even as EAF steel output declined 4.8%, because project mix shifted toward higher-value power, automation, and modernization packages amid elevated equipment and construction costs. Growth moderated to 4.7% in 2024 and 4.5% in 2025 as major projects moved between procurement phases. Recurring lifecycle demand remained resilient because the U.S. operated more than 100 minimills and EAFs represented roughly 72% of domestic crude steel production.
Forecast Market Outlook (2026-2031)
The forecast assumes revenue growth accelerates from 7.9% in 2026 to 8.7% in 2031, closing at USD 2,449 Mn. Value growth is expected to exceed steel-output growth because buyers will allocate more spending to digital controls, electrical optimization, off-gas treatment, scrap preheating, and integrated service contracts. EAF steel output is projected to reach 74.5 million metric tons by 2031, while installed capacity approaches 130 million metric tons. The base case depends on timely completion of announced sheet mills and continued modernization of existing minimills.
CHAPTER 5 - Market Data
Market Breakdown
The market combines cyclical greenfield project revenue with a recurring installed-base opportunity spanning furnace rebuilds, power systems, automation, emissions control, and lifecycle services. The operating KPI trajectory indicates increasing equipment intensity per ton of EAF steel produced.
Year | Market Size (USD Mn) | YoY Growth (%) | EAF Steel Output (Mn Metric Tons) | EAF Share of Raw Steel (%) | EAF Capacity (Mn Metric Tons/Year) | Period |
|---|---|---|---|---|---|---|
| 2020 | $1,045 Mn | +- | 51.6 | 71.0% | Forecast | |
| 2021 | $1,150 Mn | +10.0% | 60.1 | 70.0% | Forecast | |
| 2022 | $1,270 Mn | +10.4% | 57.2 | 71.0% | Forecast | |
| 2023 | $1,390 Mn | +9.4% | 58.6 | 72.0% | Forecast | |
| 2024 | $1,455 Mn | +4.7% | 57.1 | 71.8% | Forecast | |
| 2025 | $1,520 Mn | +4.5% | 59.0 | 72.0% | Forecast | |
| 2026 | $1,640 Mn | +7.9% | 61.0 | 73.0% | Forecast | |
| 2027 | $1,772 Mn | +8.0% | 63.2 | 74.0% | Forecast | |
| 2028 | $1,918 Mn | +8.2% | 65.7 | 75.0% | Forecast | |
| 2029 | $2,078 Mn | +8.3% | 68.4 | 76.0% | Forecast | |
| 2030 | $2,254 Mn | +8.5% | 71.3 | 77.0% | Forecast | |
| 2031 | $2,449 Mn | +8.7% | 74.5 | 78.0% | Forecast |
EAF Steel Output
59.0 million metric tons, 2025, United States. Output supports a broad aftermarket for refractory systems, electrodes, controls, cooling, and maintenance. Total U.S. raw steel production was estimated at 82 million metric tons in 2025.
EAF Share of Raw Steel
71.8%, 2024, United States. The dominant process share makes EAF technology the primary addressable steelmaking equipment platform. Worldsteel reported a global EAF share of only 29.1% in 2024.
EAF Capacity
105 million metric tons per year, 2025, United States. Capacity additions should restore growth after near-term idling. Nucor's West Virginia sheet mill alone is designed for 3 million tons of annual capacity.
CHAPTER 6 - Segmentation
Market Segmentation Framework
Comprehensive analysis across key dimensions providing insights into market structure, buyer requirements, technology adoption, and route-to-market patterns.
No of Segments
7
Dominant Segment
Product Type
Fastest Growing Segment
Technology
Product Type
End-Use Industry
Application
Customer Type
Sales Channel
Technology
Geography
Key Segmentation Takeaways
Comprehensive analysis across all extracted segmentation dimensions provides a structured view of demand pools, procurement routes, technical differentiation, installed-base service requirements, and regional investment concentration.
Product Type
Product Type is the dominant segmentation dimension because furnace configuration establishes the core capital value, electrical architecture, operating envelope, and aftermarket requirement. AC Electric Arc Furnaces represent the broadest installed base across U.S. carbon-steel minimills. Auxiliary Melt-Shop Systems add substantial revenue through transformers, off-gas capture, material handling, water cooling, and ladle-refining packages.
Technology
Technology is the fastest growing segmentation dimension as operators prioritize energy efficiency, tap-to-tap reduction, metallic yield, predictive maintenance, and emissions visibility. AI Process Control is the strongest growth pocket because software and sensor upgrades can be deployed across existing furnaces with lower shutdown requirements than vessel replacement, while scrap preheating supports both productivity and electricity-cost reduction.
CHAPTER 7 - Regional Analysis
Regional Analysis
The United States is the largest EAF equipment and lifecycle-services market among its selected industrial peers because it combines a high EAF process share, more than 100 minimills, large brownfield requirements, and multiple multibillion-dollar greenfield projects. Japan is the closest growth challenger as high-grade steel producers begin replacing blast-furnace capacity with large EAF installations.
Focus Country Ranking
1st
Focus Country Market Size
USD 1.52 Bn
Focus Country CAGR (2026-2031)
8.3%
Focus Country Ranking
1st
Focus Country Market Size
USD 1.52 Bn
Focus Country CAGR (2026-2031)
8.3%
Regional Analysis (Current Year)
Market Position
The United States ranks first at USD 1.52 Bn, supported by 71.8% EAF penetration and a 107-million-ton capacity base in 2024.
Growth Advantage
The U.S. forecast CAGR of 8.3% exceeds Canada at 6.5% and Mexico at 7.4%, while Japan leads narrowly at 8.8% on blast-furnace conversion investment.
Competitive Strengths
The United States combines 102 minimills, 105 million tons of capacity, domestic scrap depth, and active projects exceeding USD 7 billion across Nucor and U.S. Steel.
CHAPTER 8 - INDUSTRY ANALYSIS
Growth Drivers, Market Challenges, Market Opportunities & Decision Support Phase
Comprehensive analysis of key factors shaping the USA Electric Arc Furnace Market, including growth catalysts, operational challenges, and emerging opportunities across production, distribution, and industrial technology segments.
Growth Drivers
Dominant Domestic EAF Installed Base
- U.S. EAF production was distributed across 102 minimills with 105 million metric tons of capacity (2025, United States), supporting replacement demand for furnace shells, transformers, automation, off-gas systems, and water-cooling assets.
- Domestic raw steel output reached 82 million metric tons with estimated sales of USD 149 billion (2025, United States), giving suppliers a broad revenue base for equipment, spares, digital controls, and lifecycle services.
- Construction, service centers, and automotive represented 31%, 26%, and 15% of steel demand (2025, United States), respectively, diversifying the end-market exposure supporting EAF investment decisions.
Multibillion-Dollar Melt-Shop Investment
- U.S. Steel's Big River 2 includes two EAFs and 3 million tons of annual capacity (United States), creating demand for complete melt-shop packages, electrical systems, material handling, and process automation.
- The wider Big River expansion represents more than USD 3 billion and four EAFs across the complex (United States), strengthening the market for commissioning, optimization, maintenance, and spare-parts contracts.
- A federal award of up to USD 500 million supports two electric melting furnaces and about 1 million tons of annual GHG reduction (United States), lowering transition risk for first-wave integrated-mill conversions.
Digital and Environmental Modernization
- Iron and steel facilities report EAF emissions under 40 CFR Part 98, Subpart Q (United States), increasing demand for auditable metering, data historians, emissions controls, and digital compliance workflows.
- Off-gas heat recovery and control can provide approximately 100 kWh per ton of energy opportunity (industry benchmark), improving the investment case for scrap preheating, furnace sealing, and intelligent combustion systems.
- Eccentric bottom tapping can save about 13.6 kWh per ton, with a USD 3.3 million reference modification for a 760,000-ton furnace, illustrating monetizable brownfield efficiency economics.
Market Challenges
Electricity and Grid Exposure
- At an estimated 59 million metric tons of EAF output in 2025, direct furnace electricity demand is approximately 26.6 TWh before auxiliary loads, creating strong incentives for power-quality systems and energy optimization.
- The national EAF fleet has 105 million metric tons of annual capacity (2025, United States), so simultaneous expansion can strain interconnection queues and require substation, transformer, and transmission upgrades beyond the furnace package.
- Energy savings of about 100 kWh per ton from advanced off-gas control remain site dependent, requiring stable scrap charging, sensors, and operating discipline before projected savings translate into bankable cash flow.
Scrap Quality and Metallic Cost Volatility
- With 71.8% of U.S. crude steel produced through EAFs in 2024, competition for prime scrap can compress margins and increase the value of DRI, pig iron, sorting, and chemistry-control solutions.
- The United States imported 24 million metric tons of steel products with 13% net import reliance in 2025, so trade actions can shift domestic production, scrap demand, and melt-shop utilization rapidly.
- Finished steel imports totaled 18.665 million net tons in 2025, meaning domestic utilization remains exposed to product-level trade flows that influence furnace schedules and aftermarket spending.
Project Cyclicality and Execution Risk
- A single greenfield mill can require USD 4 billion of capital and 3 million tons of annual capacity, concentrating supplier revenue in long procurement, construction, and commissioning schedules.
- Big River's expansion exceeds USD 3 billion, so schedule slippage, equipment integration, workforce availability, and ramp-up performance can materially affect OEM backlog conversion and cash collection.
- EAF operations face at least two federal compliance workstreams, hazardous-air-pollutant controls and greenhouse-gas reporting, which can extend brownfield modernization timelines and documentation requirements.
Market Opportunities
Greenfield and Capacity Expansion Packages
- OEMs and EPC providers can monetize complete melt-shop packages for at least 6 million tons of announced annual capacity across Nucor West Virginia and Big River 2.
- Power-equipment, automation, and environmental-system suppliers benefit because each 3-million-ton mill implies roughly 1.35 TWh of annual furnace electricity at a 450 kWh-per-ton benchmark.
- Opportunity realization requires reliable utility interconnection and coordinated permitting because a 3-million-ton EAF mill can require about 1.35 TWh of direct annual furnace electricity, excluding auxiliary loads.
AI-Enabled Furnace Optimization
- Software vendors can capture recurring subscription and performance-service revenue across 102 U.S. minimills in 2025, avoiding the long replacement cycle associated with complete furnace vessels.
- Steelmakers benefit from combining off-gas analysis, scrap imaging, power regulation, and predictive maintenance to pursue approximately 100 kWh per ton of identified efficiency potential.
- Scaled adoption requires interoperable sensors, clean historical data, cybersecurity, and operator trust across a fleet producing approximately 59 million metric tons of EAF steel in 2025.
DRI-EAF and Advanced Grade Conversion
- Furnace OEMs can sell high-productivity melting, ladle metallurgy, and chemistry-control systems designed for mixed scrap and DRI feeds, with the reference project targeting about 1 million tons of annual GHG reduction.
- Integrated steelmakers and automotive buyers benefit as EAF routes expand into higher-grade flat products; U.S. Steel reported 38% of production from EAFs in 2024.
- Commercial scale requires dependable low-carbon metallics and renewable power, while Big River is developing a first-of-its-kind U.S. DRI facility linked to four EAFs.
8. Growth Drivers, Challenges and Opportunities
9. Competitive Landscape Overview
CHAPTER 9 - Competitive Landscape
Competitive Landscape Overview
The supplier landscape is concentrated among global furnace OEMs, automation groups, and engineering specialists. Competitive advantage depends on reference installations, complete melt-shop integration, U.S. service coverage, energy performance, and long-term lifecycle support.
Market Share Distribution
Top 5 Players
Market Dynamics
8 new entrants in the past 5 years, indicating strong market attractiveness and growth potential.
Company Name | Market Share | Headquarters | Founding Year | Core Market Focus |
|---|---|---|---|---|
Danieli & C. Officine Meccaniche S.p.A. | - | Buttrio, Italy | 1914 | Complete EAF melt shops, digital controls, rolling and lifecycle services |
SMS group GmbH | - | Düsseldorf, Germany | 1871 | EAF systems, power technology, automation, environmental and modernization packages |
Tenova S.p.A. | - | Castellanza, Italy | 2007 | EAF technology, Consteel charging, off-gas systems and process optimization |
Primetals Technologies Limited | - | London, United Kingdom | 2015 | EAF melt-shop engineering, electrics, automation, digitalization and service |
ABB Ltd. | - | Zurich, Switzerland | 1988 | Power systems, furnace control, drives, electrification and industrial automation |
Siemens AG | - | Munich and Berlin, Germany | 1847 | Industrial electrification, automation, digital twins and energy management |
Fives Group | - | Paris, France | 1812 | Combustion, thermal, environmental and melt-shop process equipment |
Sarralle | - | Azpeitia, Spain | 1965 | Turnkey melt shops, EAF equipment, material handling and environmental systems |
TMEIC Corporation | - | Tokyo, Japan | 2003 | Medium-voltage drives, power electronics, motors and process automation |
AMI Automation | - | Monterrey, Mexico | 1987 | EAF automation, electrode regulation, off-gas control and optimization software |
Cross Comparison Parameters
The report provides detailed cross-comparison of key players across 10 performance parameters to identify competitive strengths and weaknesses.
Installed Base References
EAF Capacity Delivered
Energy Efficiency Improvement
U.S. Lifecycle Service Coverage
Analysis Covered
Market Share Analysis:
Assesses supplier concentration using disclosed projects and installed references
Cross Comparison Matrix:
Benchmarks capacity, technology breadth, services, and domestic execution
SWOT Analysis:
Evaluates engineering depth, installed base, partnerships, and exposure
Pricing Strategy Analysis:
Compares turnkey, equipment-only, software, and service contracting models
Company Profiles:
Reviews ownership, headquarters, capabilities, references, and strategic positioning
CHAPTER 10 - REPORT TOC
CHAPTER 14 - Table Of Contents
Phase 1Market Assessment Phase
11
Chapters
Supply-side and competitive intelligence covering market sizing, segmentation, competitive dynamics, regulatory landscape, and future forecasts.
Phase 2Go-To-Market Strategy Phase
15
Chapters
Entry strategy evaluation, execution roadmap, partner recommendations, and profitability outlook.
Complete Report Coverage
201+ detailed sections covering every aspect of the market
143
Assessment Sections
58
Strategy Sections
CHAPTER 11 - Our Approach
Research Methodology
Desk Research
- Mapped U.S. EAF installed capacity
- Reviewed steel output and process shares
- Tracked announced melt-shop capital projects
- Assessed energy and emissions regulations
Primary Research
- Interviewed melt-shop operations directors
- Consulted furnace OEM sales leaders
- Engaged steel plant maintenance managers
- Validated automation procurement decision criteria
Validation and Triangulation
- Triangulated findings across 282 respondents
- Reconciled capacity with production utilization
- Cross-checked project values and timing
- Validated unit economics with benchmarks
CHAPTER 12 - FAQ
FAQs
Still have questions?
Our research team is here to help you find the right solution
CHAPTER 13 - Related Research
Explore Related Reports
Expand your market intelligence with complementary research across regions and adjacent markets.
Regional/Country ReportsRelated market analysis across key regions
Related market analysis across key regions
No regional reports found.
Adjacent ReportsRelated markets and complementary research
Related markets and complementary research
500+
Market Research Reports
50+
Countries Covered
15+
Industry Verticals