USA Syngas Market Outlook to 2030

Region:North America

Author(s):Abhinav Kumar

Product Code:KROD683

Published On

July 2024

Total pages

95

About the Report

USA Syngas Market Overview

  • The USA Syngas Market has experienced notable growth, this is reflected by the Global Syngas Market reaching a valuation of 227 million metric normal cubic meters per hour (mm nm³/h), driven by increasing demand for alternative energy sources, advancements in gasification technology, and the use of syngas in producing chemicals and fuels. The market's growth reflects the broader trend toward cleaner and more efficient energy solutions.
  • Key players in the USA Syngas market include Air Liquide, Air Products & Chemicals, Linde, Praxair, and Sasol. These companies are recognized for their technological innovations, extensive production capabilities, and robust distribution networks, positioning them as leaders in the industry.
  • In May 2024, Linde announced the doubling of the merchant liquid production capacity at its air separation facility in La Porte, Texas. Additionally, Linde has been involved in large-scale hydrogen projects, such as investing $1.8 billion to supply clean hydrogen to OCI's blue ammonia project in the U.S. Gulf Coast, expected to start up in 2025​.
  • Houston and Baton Rouge are key cities dominating the USA syngas market due to their strategic locations near abundant natural gas reserves and major petrochemical industries. Houston, as a hub for energy companies, benefits from extensive infrastructure and skilled labor, making it a prime location for syngas production and distribution.

USA Syngas Market Size

USA Syngas Market Segmentation

The USA Syngas Market can be segmented by various factors like Production Method, Application, and Region.

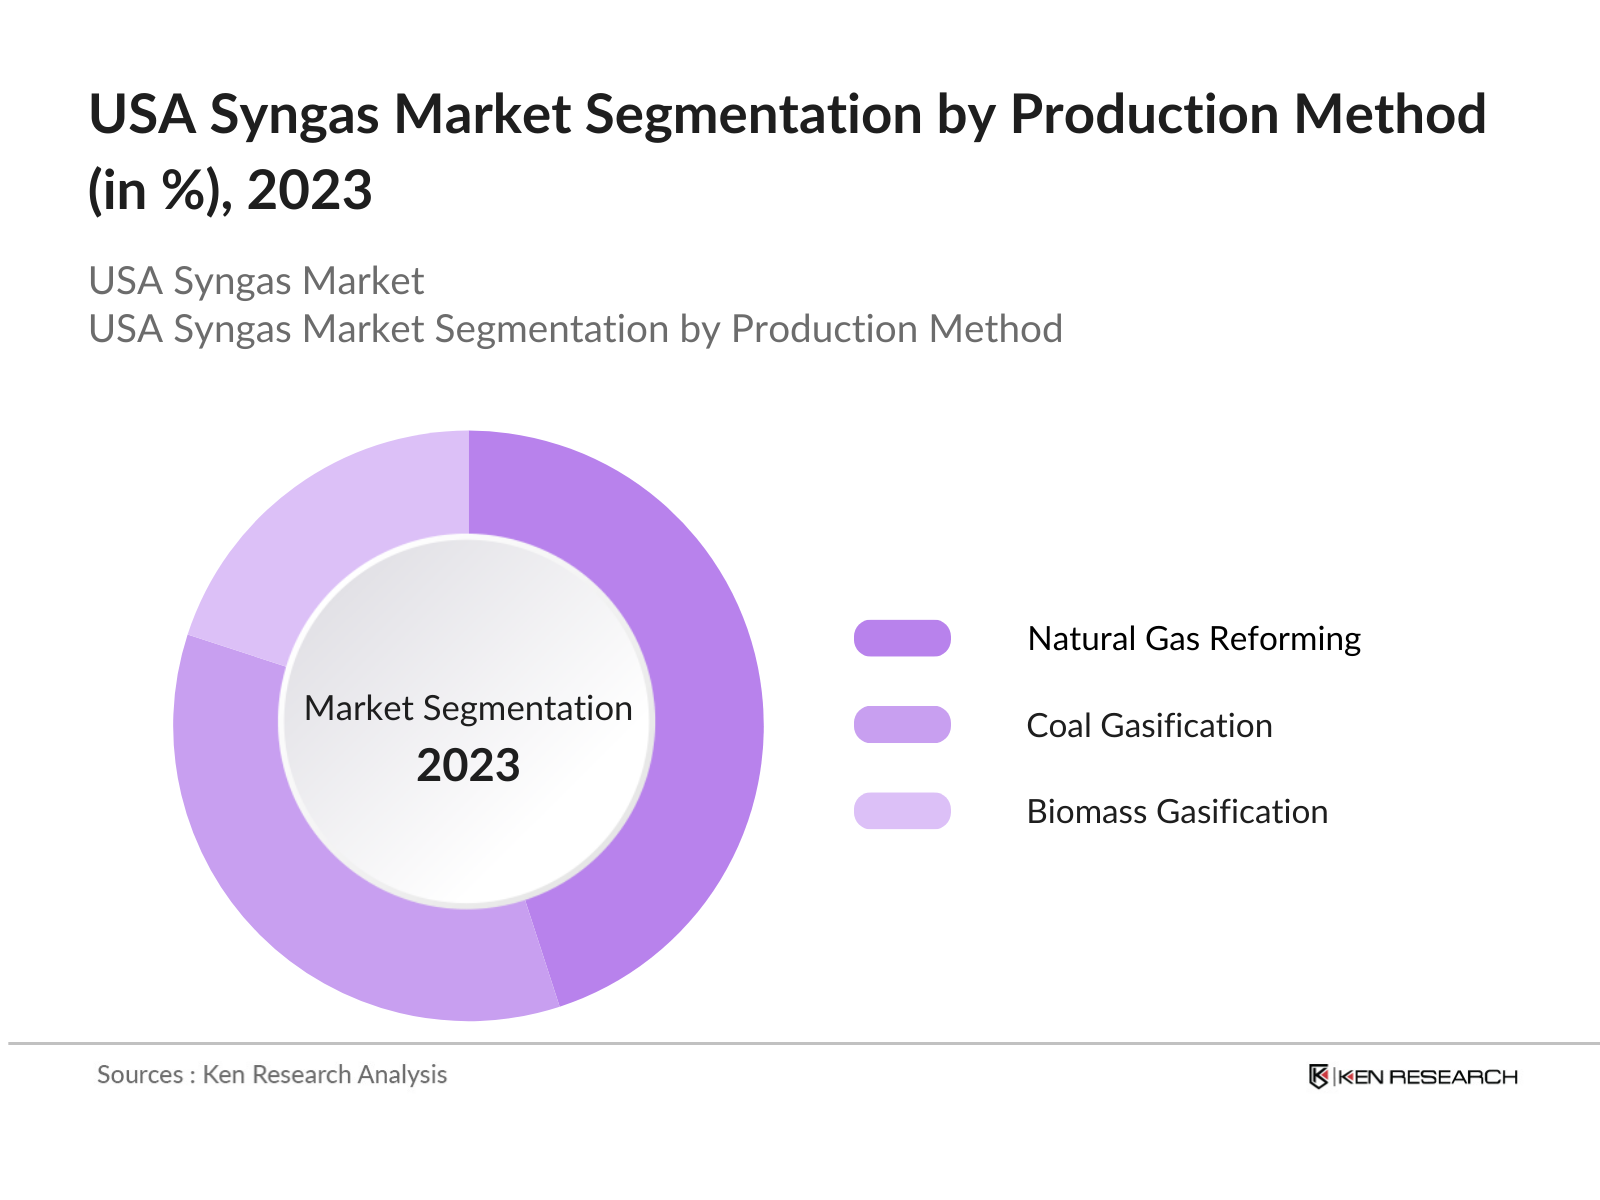
By Production Method: The USA syngas market is segmented by production method into gasification of coal, natural gas reforming, and biomass gasification. In 2023, natural gas reforming held a dominant market share due to the abundant availability of natural gas and its relatively lower cost compared to other feedstocks. The established infrastructure for natural gas distribution and the increasing demand for hydrogen as a clean fuel further bolster this segment's dominance.

USA Syngas Market Segmentation by Production Method

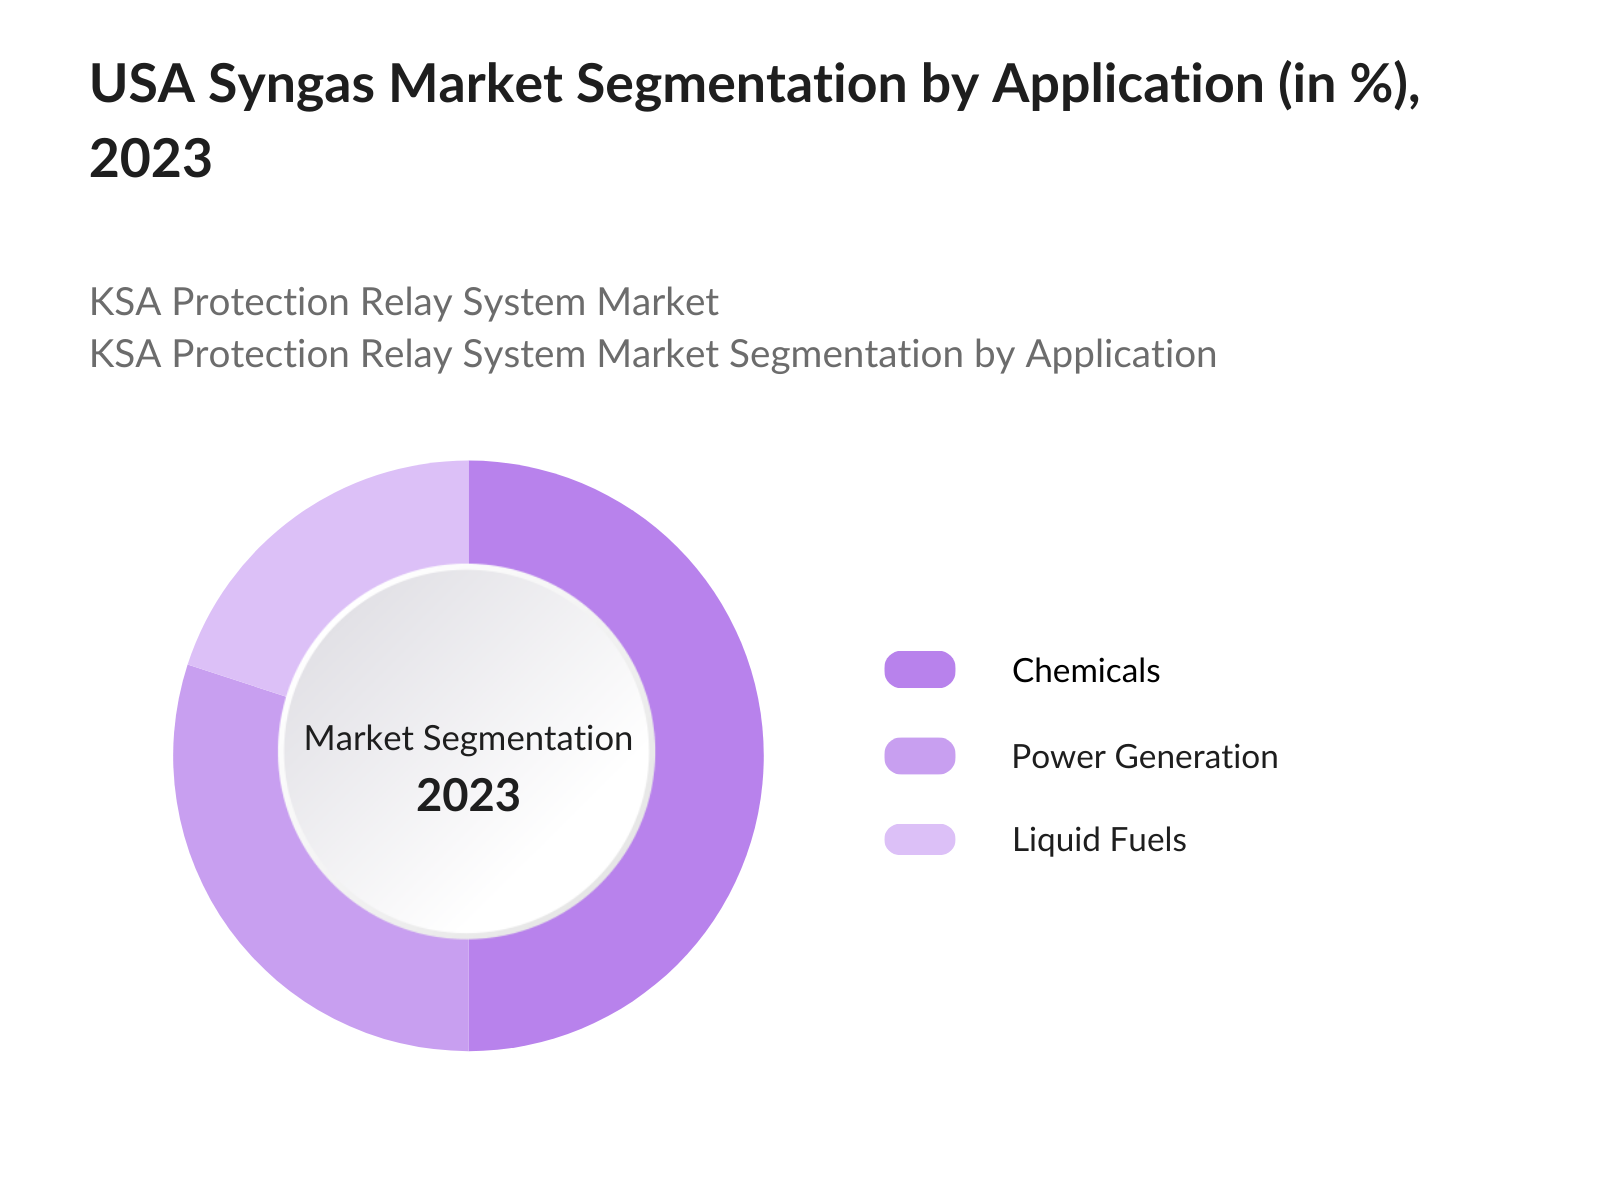
By Application: The market is divided by application into chemicals, power generation, and liquid fuels. In 2023, chemicals led the market, driven by the extensive use of syngas as a feedstock in producing ammonia, methanol, and other chemical intermediates. The chemical industry's demand for syngas is fueled by its versatility and efficiency in various synthesis processes, essential for manufacturing fertilizers, plastics, and other materials.

USA Syngas Market Segmentation by Application

By Region: Regionally, the market is segmented into North, South, East, and West. In 2023, Southern region, encompassing states like Texas and Louisiana, dominated the market share. This dominance is attributed to the region's vast reserves of natural gas, well-established industrial base, and significant investment in energy infrastructure. The presence of major refineries and chemical plants also contributes to the high demand for syngas in this region.

USA Syngas Market Competitive Landscape

USA Syngas Market Competitive Landscape

  • In 2024, Air Products announced a significant 15-year agreement with TotalEnergies to supply 70,000 tons of green hydrogen annually in Europe, beginning in 2030. This landmark deal underscores the growing emphasis on green hydrogen as a key component in Europe’s energy transition. By securing such a large and long-term supply commitment, both companies aim to advance the decarbonization of industrial processes and contribute to the continent's climate goals.
  • Sasol has been focusing on optimizing its existing syngas production facilities in the USA. In 2023, the company completed a major upgrade to its Louisiana plant, enhancing efficiency and capacity. This upgrade is part of Sasol's broader strategy to improve operational performance and reduce environmental impact, supporting its goals of sustainable growth and market expansion.

USA Syngas Industry Analysis

USA Syngas Market Growth Drivers

  • Increasing Demand for Hydrogen Production: The demand for hydrogen as a clean energy source is significantly driving the syngas market. In 2024, the global hydrogen production is expected to reach approximately 90 million metric tons, with syngas being a primary method for hydrogen generation. The U.S. Department of Energy has identified syngas as a key pathway for producing hydrogen.
  • Rising Adoption of Carbon Capture and Storage (CCS) Technologies: The implementation of CCS technologies is becoming crucial in the syngas market, particularly in the context of environmental regulations. In 2024, investments in CCS are projected to exceed $2 billion in the United States, driven by federal incentives and state-level mandates aimed at reducing greenhouse gas emissions. This trend supports the syngas market by enabling cleaner production processes and aligning with climate goals.
  • Government Support for Renewable Energy Initiatives: In 2024, the U.S. government is expected to allocate over $1 billion towards renewable energy projects, including those utilizing syngas for energy production. The Inflation Reduction Act has provisions that specifically encourage the development of syngas technologies, providing tax credits for projects that reduce carbon emissions. 

USA Syngas Market Challenges

  • High Capital Investment Requirements: The syngas production process often requires substantial initial capital investment, which can deter potential entrants into the market. In 2024, the average capital cost for setting up a syngas plant is estimated to be around $500 million, making it a significant barrier for smaller companies. This financial hurdle can limit market competition and slow down the adoption of syngas technologies.
  • Volatility in Feedstock Prices: Fluctuations in the prices of feedstocks such as coal, natural gas, and biomass pose a challenge to the syngas market. In 2024, natural gas prices are projected to average $3.50 per MMBtu, while coal prices may rise to $150 per ton, impacting the overall cost structure of syngas production. This volatility can lead to uncertainty in profit margins and may affect long-term investment decisions.

USA Syngas Market Government Initiatives

  • Reduction Act (2022): The IRA indeed allocates approximately $369 billion towards energy security and climate change initiatives. This includes significant investments in clean hydrogen production technologies, including those based on syngas. The Act provides various tax credits aimed at promoting hydrogen production and use, such as the Clean Hydrogen Production Tax Credit (H2PTC), which can offer up to $3.00 per kilogram of hydrogen produced, depending on the carbon intensity of the production process.
  • Department of Energy's Hydrogen Program: The U.S. Department of Energy (DOE) has been actively supporting research and development in hydrogen production from syngas and other methods. For 2024, the funding for the DOE's Hydrogen Program is projected to exceed $200 million, focusing on improving production efficiency and reducing costs associated with syngas-derived hydrogen​

USA Syngas Future Market Outlook

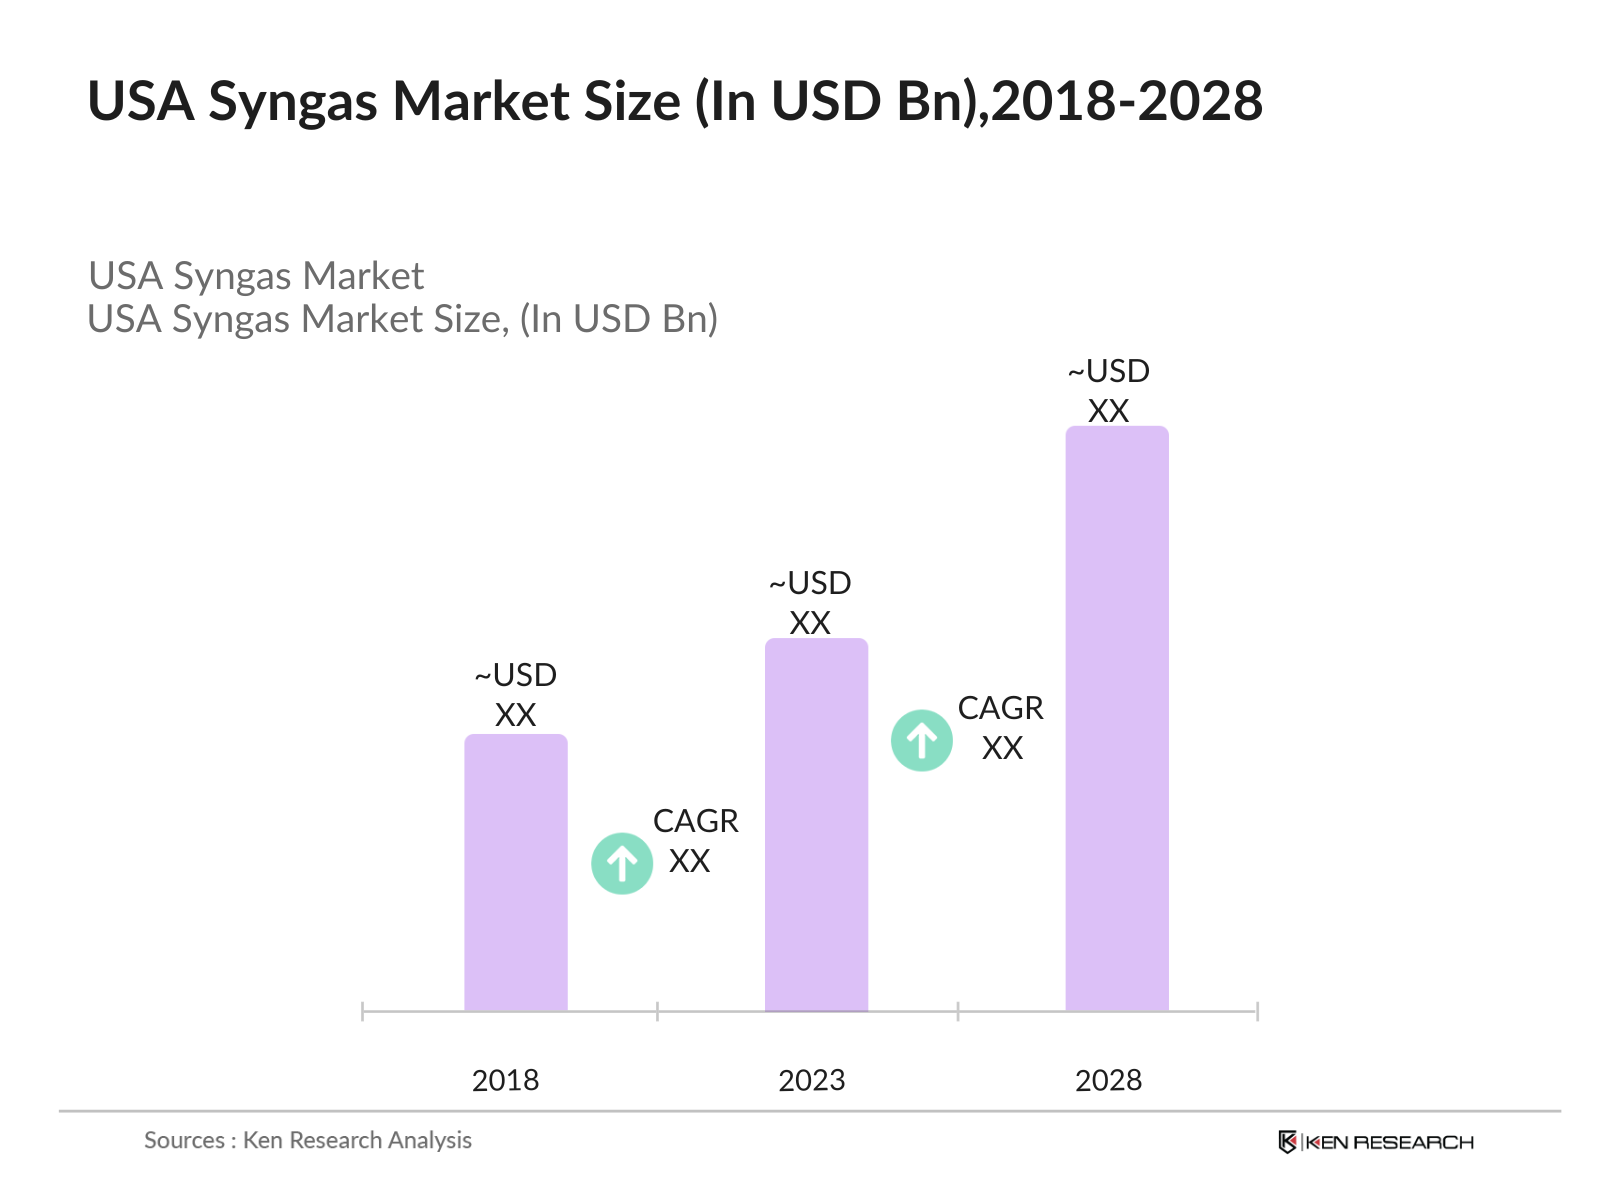
The USA Syngas Market is expected to grow significantly by 2028, with a respectable CAGR from 2023 to 2028, driven by technological advancements and the increasing adoption of syngas in various applications, including hydrogen production and chemical manufacturing.

Future Trends

    • Expansion of Hydrogen Production Facilities: By 2028, it is anticipated that the number of hydrogen production facilities utilizing syngas will double, as industries seek to meet the rising demand for hydrogen in various applications, including fuel cells and industrial processes. This expansion will be supported by government incentives and advancements in production technologies.
    • Integration of Renewable Energy Sources: The integration of renewable energy sources into syngas production processes is projected to become a standard practice by 2028. Companies are expected to adopt hybrid systems that combine syngas production with renewable energy inputs, leading to a more sustainable and resilient energy system.

Scope of the Report

By Production Method

Natural Gas Reforming

Coal Gasification

Biomass Gasification

By Application

Chemicals

Power Generation

Liquid Fuels

By Region 

North 

South 

East 

West 

Products

Key Target Audience – Organizations and Entities who can benefit by Subscribing This Report:  

  • Chemical Manufacturers

  • Power Generation Companies

  • Petroleum Refiners

  • Industrial Gas Producers

  • Environmental Agencies (e.g., EPA)

  • Energy Infrastructure Companies

  • Government & Regulatory Bodies (e.g., DOE)

  • Investments and Venture Capitalist Firms

  • Renewable Energy Companies

  • Hydrogen Fuel Cell Manufacturers

  • Syngas Technology Providers

Time Period Captured in the Report

  • Historical Period: 2018-2023
  • Base Year: 2023
  • Forecast Period: 2023-2028

Companies

Players Mentioned in the Report

  • Air Liquide
  • Air Products & Chemicals
  • Linde
  • Praxair
  • Sasol
  • GE Power
  • Mitsubishi Heavy Industries
  • Siemens AG
  • Royal Dutch Shell
  • Eastman Chemical Company
  • ConocoPhillips
  • Dow Chemical
  • ExxonMobil
  • BP
  • Chevron

Table of Contents

1. USA Syngas Market Overview 

1.1 USA Syngas Market Taxonomy 

2. USA Syngas Market Size (in USD Mn), 2018-2023 

3. USA Syngas Market Analysis 

3.1 USA Syngas Market Growth Drivers 

3.2 USA Syngas Market Challenges and Issues 

3.3 USA Syngas Market Trends and Development 

3.4 USA Syngas Market Government Regulation 

3.5 USA Syngas Market SWOT Analysis 

3.6 USA Syngas Market Stake Ecosystem 

3.7 USA Syngas Market Competition Ecosystem 

4. USA Syngas Market Segmentation, 2023 

4.1 USA Syngas Market Segmentation by Production Method (in value %), 2023 

4.2 USA Syngas Market Segmentation by Application (in value %), 2023 

4.3 USA Syngas Market Segmentation by Region (in value %), 2023 

5. USA Syngas Market Competition Benchmarking 

5.1 USA Syngas Market Cross-Comparison (no. of employees, company overview, business strategy, USP, recent development, operational parameters, financial parameters and advanced analytics) 

6. USA Syngas Market Future Market Size (in USD Mn), 2023-2028 

7. USA Syngas Market Future Market Segmentation, 2028 

7.1 USA Syngas Market Segmentation by Production Method (in value %), 2028 

7.2 USA Syngas Market Segmentation by Application (in value %), 2028 

7.3 USA Syngas Market Segmentation by Region (in value %), 2028 

8. USA Syngas Market Analysts’ Recommendations 

8.1 USA Syngas Market TAM/SAM/SOM Analysis 

8.2 USA Syngas Market Customer Cohort Analysis 

8.3 USA Syngas Market Marketing Initiatives 

8.4 USA Syngas Market White Space Opportunity Analysis

Disclaimer

Contact Us

Research Methodology

Step 1: Identifying Key Variables

Ecosystem creation for all the major entities and referring to multiple secondary and proprietary databases to perform desk research around market to collate industry level information. 

Step 2: Market Building

Collating statistics on USA Syngas Market over the years, penetration of marketplaces and service providers ratio to compute revenue generated for USA Syngas Market. We will also review service quality statistics to understand revenue generated which can ensure accuracy behind the data points shared. 

Step 3: Validating and Finalizing

Building market hypothesis and conducting CATIs with industry experts belonging to different companies to validate statistics and seek operational and financial information from company representatives. 

Step 4: Research Output

Our team will approach multiple syngas companies and understand nature of product segments and sales, consumer preference and other parameters, which will support us validate statistics derived through bottom to top approach from syngas companies.

Frequently Asked Questions

01 How big is the USA Syngas Market?

The USA Syngas Market has experienced notable growth, this is reflected by the Global Syngas Market reaching a valuation of 227 million metric normal cubic meters per hour (mm nm³/h), driven by increasing demand for alternative energy sources, advancements in gasification technology, and the use of syngas in producing chemicals and fuels.

02 What are the challenges in the USA Syngas Market?

The USA syngas market faces challenges such as high capital investment costs, technical complexities in gasification processes, and stringent environmental regulations. Additionally, competition from other cleaner energy sources like solar and wind poses a threat to the market's growth.

03 Who are the major players in the USA Syngas Market?

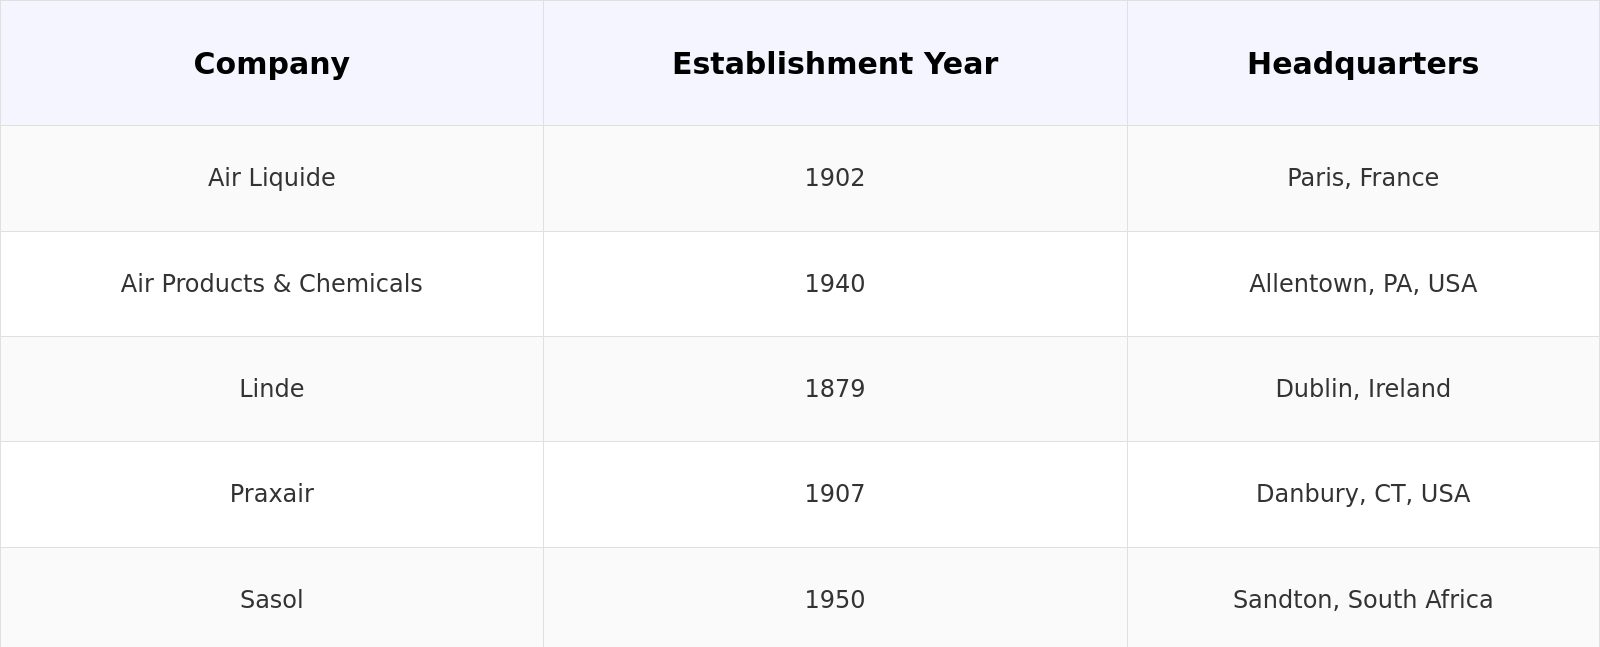
Major players in the USA syngas market include Air Liquide, Air Products & Chemicals, Linde, Praxair, and Sasol. These companies are prominent due to their advanced technologies, extensive distribution networks, and large-scale production capabilities.

04 What are the growth drivers of the USA Syngas Market?

The USA syngas market is driven by the increasing focus on reducing greenhouse gas emissions and the growing demand for clean energy alternatives. Technological advancements in gasification and the use of syngas for producing chemicals and fuels are also significant growth drivers.

Why Buy From Us?

RRR
Refine Robust Result (RRR) Framework

What makes us stand out is that our consultants follows Robust, Refine and Result (RRR) methodology. i.e. Robust for clear definitions, approaches and sanity checking, Refine for differentiating respondents facts and opinions and Result for presenting data with story

Our Reach Is Unmatched

We have set a benchmark in the industry by offering our clients with syndicated and customized market research reports featuring coverage of entire market as well as meticulous research and analyst insights.

Research
Shifting the Research Paradigm

While we don't replace traditional research, we flip the method upside down. Our dual approach of Top Bottom & Bottom Top ensures quality deliverable by not just verifying company fundamentals but also looking at the sector and macroeconomic factors.

Insite
More Insights-Better Decisions

With one step in the future, our research team constantly tries to show you the bigger picture. We help with some of the tough questions you may encounter along the way: How is the industry positioned? Best marketing channel? KPI's of competitors? By aligning every element, we help maximize success.

Trust
Transparency and Trust

Our report gives you instant access to the answers and sources that other companies might choose to hide. We elaborate each steps of research methodology we have used and showcase you the sample size to earn your trust.

support
Round the Clock Support

If you need any support, we are here! We pride ourselves on universe strength, data quality, and quick, friendly, and professional service.

Why Client Choose Us?

400000+ Reports in repository
150+ Consulting project a year
100+ Analysts
8000+ Client Queries in 2022