CHAPTER 1 - MARKET SUMMARY
Market Overview
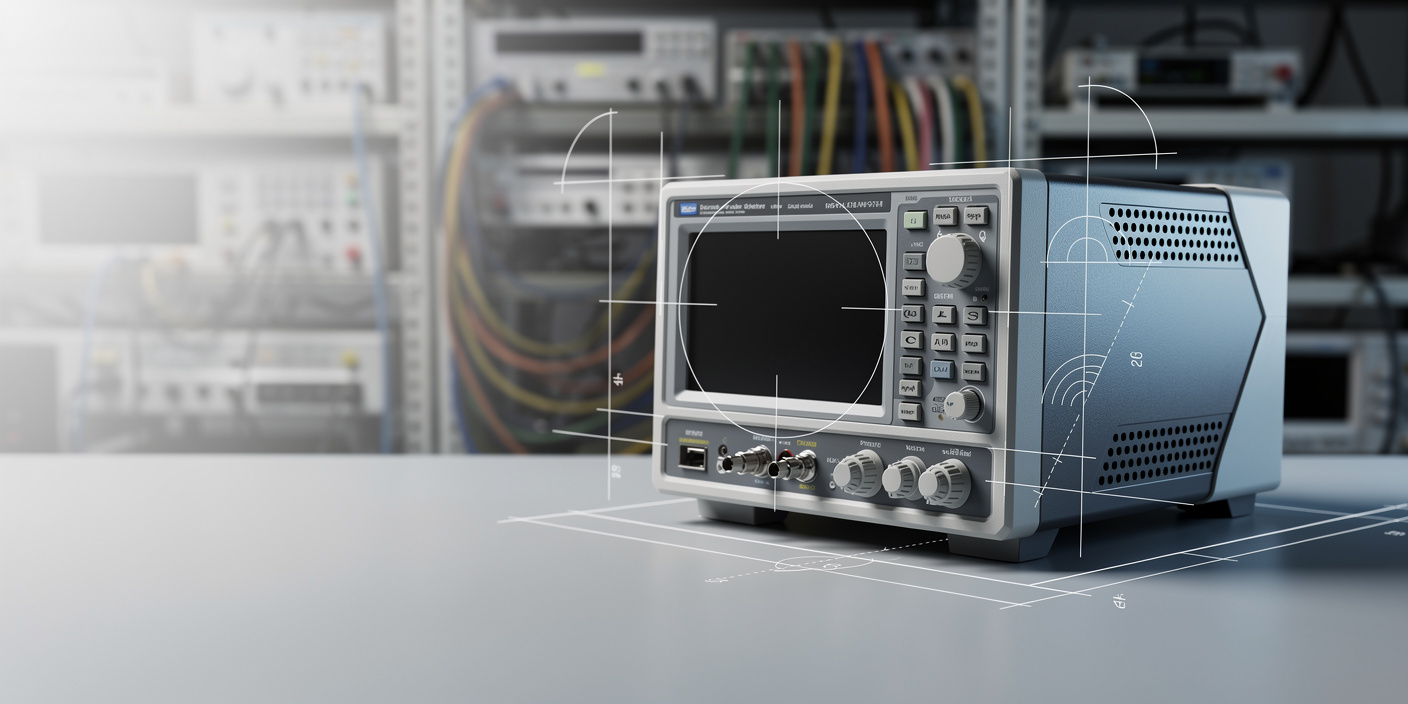
The USA Test and Measurement Equipment Market converts engineering complexity into recurring demand for oscilloscopes, spectrum analyzers, power analyzers, automated test systems, software and calibration services. Global semiconductor sales reached USD 791.7 billion in 2025, increasing the volume and technical intensity of chip characterization, production screening and system validation performed by U.S. technology companies. This supports premium pricing for high-bandwidth and application-specific platforms.
Demand is concentrated around California, Texas, Arizona, Massachusetts and other electronics, aerospace and semiconductor clusters. The western United States accounted for an estimated 32% of domestic market revenue in 2025, led by semiconductor design, cloud infrastructure and defense electronics. U.S. private construction for computer, electronic and electrical manufacturing exceeded an annualized USD 75 billion during 2025, expanding the installed base requiring production-test capacity.
Market Value
USD 6,520 million
2025
Dominant Region
Western United States
2025
Dominant Segment
Automated and Modular Test Platforms
fastest growing, 2025
Total Number of Players
760
Future Outlook
The USA Test and Measurement Equipment Market is projected to increase from USD 6,520 million in 2025 to USD 9,210 million by 2031, representing a forecast CAGR of 5.9%. This follows a 2020-2025 historical CAGR of 5.7%. Near-term growth is supported by AI accelerators, advanced packaging, defense modernization, electric powertrains and data-center interconnect testing. The 2026 growth rate is moderated by procurement normalization and trade uncertainty, but spending is expected to accelerate from 2027 as semiconductor facilities move from construction into equipment installation, process qualification and production ramp-up.
Revenue growth is expected to exceed equipment-volume growth as customers adopt higher-frequency instruments, multi-domain platforms and subscription-based analysis software. Equipment-equivalent shipments are projected to rise from approximately 1,205 thousand units in 2025 to 1,575 thousand units in 2031, a volume CAGR of 4.6%. The blended revenue per equipment-equivalent unit is forecast to increase from USD 5,411 to USD 5,848. Software-defined and recurring service revenue is expected to reach 47% of market value by 2031, improving vendor visibility while increasing interoperability and cybersecurity requirements.
5.9%
Forecast CAGR
$9,210 Mn
2030 Projection
Base Year
2025
Historical Period
2020-2025
Forecast Period
2026-2031
Historical CAGR
5.7%
CHAPTER 2 - SCOPE OF REPORT
Scope of the Market
CHAPTER 3 - Key Stakeholders
Key Target Audience
Key stakeholders who can leverage from this market analysis for investment, strategy, and operational planning.
Investors
CAGR, recurring revenue, R&D intensity, margin resilience
Corporates
test coverage, procurement cost, utilization, lifecycle support
Government
metrology, semiconductor capacity, compliance, supply resilience
Operators
throughput, calibration, interoperability, engineering productivity
Financial institutions
capex cycles, cash flow, concentration, credit risk
CHAPTER 4 - Market Size & Growth
Market Size, Growth Forecast and Trends
This section evaluates the historical market size, analyzes year-over-year growth dynamics, and presents forecast projections supported by market performance indicators and demand-side drivers.
Historical & Projected Market Size ($ Million)
Year-over-Year Growth Rate (%)
Market Value vs Volume Growth (%)
Historical Market Performance (2020-2025)
The market's lowest annual growth occurred in 2021 at 3.5%, reflecting deferred laboratory access, constrained component availability and extended delivery cycles. Growth improved through 2024 as communications, aerospace and automotive engineering activity normalized. The strongest historical expansion occurred in 2025 at 8.6%, supported by AI semiconductor test demand, higher bandwidth requirements and increased acquisition of automated production platforms. Equipment-equivalent shipments increased from approximately 980 thousand units in 2020 to 1,205 thousand units in 2025, while price and product mix added 2.6 percentage points to 2025 value growth.
Forecast Market Outlook (2026-2031)
The market is forecast to expand at a 5.9% CAGR from 2025 to 2031. Growth is expected to moderate to 4.6% in 2026 as customers absorb 2025 purchases, then accelerate as new semiconductor, data-center and defense programs enter validation and production. Market value is projected to exceed USD 8,000 million in 2029 and reach USD 9,210 million in 2031. Software, calibration and recurring services are expected to contribute 47% of terminal-year revenue, supporting higher retention and reducing vendor exposure to stand-alone instrument replacement cycles.
CHAPTER 5 - Market Data
Market Breakdown
The market's growth trajectory is increasingly determined by instrument performance, equipment-equivalent deployment and software-enabled revenue. These indicators help executives distinguish sustainable recurring growth from cyclical hardware replacement.
Year | Market Size (USD Mn) | YoY Growth (%) | Equipment Volume (000 Units) | Blended Revenue per Unit (USD) | Software and Service Share (%) | Period |
|---|---|---|---|---|---|---|
| 2020 | $4,934 Mn | +- | 980 | 5,035 | Forecast | |
| 2021 | $5,105 Mn | +3.5% | 1,002 | 5,095 | Forecast | |
| 2022 | $5,356 Mn | +4.9% | 1,035 | 5,175 | Forecast | |
| 2023 | $5,648 Mn | +5.5% | 1,080 | 5,230 | Forecast | |
| 2024 | $6,001 Mn | +6.3% | 1,138 | 5,273 | Forecast | |
| 2025 | $6,520 Mn | +8.6% | 1,205 | 5,411 | Forecast | |
| 2026 | $6,820 Mn | +4.6% | 1,250 | 5,456 | Forecast | |
| 2027 | $7,215 Mn | +5.8% | 1,305 | 5,529 | Forecast | |
| 2028 | $7,645 Mn | +6.0% | 1,365 | 5,601 | Forecast | |
| 2029 | $8,124 Mn | +6.3% | 1,430 | 5,681 | Forecast | |
| 2030 | $8,652 Mn | +6.5% | 1,500 | 5,768 | Forecast | |
| 2031 | $9,210 Mn | +6.4% | 1,575 | 5,848 | Forecast |
Equipment Volume
1,205 thousand equipment-equivalent units, 2025, USA. Volume growth indicates capacity expansion across laboratories and production environments. U.S. electric car sales reached 1.6 million units in 2024, increasing battery, inverter and charging-system test requirements.
Blended Revenue per Unit
USD 5,411 per equipment-equivalent unit, 2025, USA. The metric rises as customers purchase greater bandwidth, channel density and automation. Keysight reported USD 5.37 billion in global fiscal 2025 revenue, up from USD 4.98 billion in fiscal 2024.
Software and Service Share
41%, 2025, USA. Recurring software, calibration and support improve retention and lifecycle economics. Teradyne reported USD 524.9 million of service revenue in 2024, demonstrating the material service pool surrounding installed automated-test platforms.
CHAPTER 6 - Segmentation
Market Segmentation Framework
Comprehensive analysis across key dimensions providing insights into market structure, customer requirements and distribution patterns.
No of Segments
7
Dominant Segment
Product Type
Fastest Growing Segment
Technology
Product Type
End-Use Industry
Application
Customer Type
Sales Channel
Technology
Geography
Key Segmentation Takeaways
Comprehensive analysis across all extracted segmentation dimensions providing insights into market structure, customer requirements and distribution patterns.
Product Type
Product configuration remains the primary revenue-allocation dimension because performance requirements create large pricing differences. Automated and Modular Test Platforms are the dominant Level-2 segment, supported by semiconductor production, defense system integration and high-throughput electronics manufacturing. Vendors compete through test coverage, throughput, parallelism, switching density, measurement accuracy and integration with customers' engineering software environments.
Technology
Technology is the fastest-growing dimension as customers migrate from isolated benchtop instruments toward modular, software-defined and remotely orchestrated systems. Cloud-Connected and AI-Assisted Test is the fastest-growing Level-2 segment, benefiting from centralized test-data management, predictive maintenance, adaptive test sequences and shared instrument access. Commercial success depends on open APIs, cybersecurity, instrument interoperability and measurable reductions in engineering time.
CHAPTER 7 - Regional Analysis
Regional Analysis
The United States ranks first among the selected advanced-economy peers by test and measurement equipment revenue. Its position is supported by a large semiconductor design base, defense R&D, hyperscale computing, aerospace manufacturing and geographically diversified industrial demand. The market remains larger than China, Japan, Germany, South Korea and Canada on a comparable domestic-revenue basis.
Focus Country Ranking
1st
Focus Country Market Size
USD 6,520 Mn (2025)
Focus Country CAGR (2026-2031)
5.9%
Focus Country Ranking
1st
Focus Country Market Size
USD 6,520 Mn (2025)
Focus Country CAGR (2026-2031)
5.9%
Regional Analysis (Current Year)
Regional Analysis Comparison
Market Position
The United States ranks 1st among the selected peers with a USD 6,520 million market in 2025, supported by U.S.-based semiconductor companies holding 50.4% of global chip revenue.
Growth Advantage
The U.S. forecast CAGR of 5.9% exceeds Japan's 4.2% and Germany's 4.5%, although it remains below China and South Korea due to their faster manufacturing-capacity expansion.
Competitive Strengths
Competitive strengths include USD 62.7 billion of semiconductor R&D in 2024, a USD 143.2 billion FY2025 defense RDT&E request and extensive ISO/IEC 17025 laboratory infrastructure.
CHAPTER 8 - INDUSTRY ANALYSIS
Growth Drivers, Market Challenges & Market Opportunities
Comprehensive analysis of key factors shaping the USA Test and Measurement Equipment Market, including growth catalysts, operational challenges and emerging opportunities across production, distribution and customer segments.
Growth Drivers
AI, Semiconductor and Advanced Packaging Investment
- U.S.-headquartered semiconductor companies generated USD 318.2 billion (2024, USA), creating a large customer base for wafer, packaged-device and system-level validation platforms. Instrument vendors capture value through higher channel counts, bandwidth and automated test throughput.
- U.S. semiconductor R&D totaled USD 62.7 billion (2024, USA). High R&D intensity increases demand for characterization tools before devices reach volume production, benefiting high-end oscilloscopes, RF analyzers, source-measure units and protocol-validation software.
- U.S. advanced-logic capacity below 10 nanometers is projected to reach 28% of global capacity by 2032, compared with 0% in 2022. New fabs require production test, calibration, environmental monitoring and failure-analysis ecosystems before commercial ramp-up.
Defense, Aerospace and Space-System Modernization
- The defense budget also included USD 167.5 billion for procurement (FY2025, USA). Radar, communications, avionics and electronic-warfare programs require long qualification cycles, secure test environments and traceable calibration, favoring established vendors with government-approved support networks.
- FY2025 enacted defense RDT&E reached approximately USD 141.4 billion (2025, USA). Recurring upgrades and sustainment create demand for field-deployable instruments, automated regression testing and long-term instrument support beyond initial platform development.
- NASA operates specialized aeronautics test facilities supporting next-generation aviation systems. Expanding electrified aircraft, autonomous flight and space communications require higher-fidelity power, RF and environmental testing, allowing instrument suppliers and integrators to participate in multi-year programs.
Electrification, Data Centers and Communications
- Electric cars represented more than 10% of U.S. vehicle sales (2024, USA). Each platform requires battery-cell characterization, inverter efficiency measurement, charging interoperability and electromagnetic-compliance testing, creating equipment and recurring software demand.
- Computer, electronic and electrical manufacturing construction operated above an annualized USD 75 billion during 2025. New facilities convert construction spending into production-test racks, power-quality instruments, network analyzers and accredited calibration demand during commissioning.
- U.S. semiconductor exports reached USD 57.0 billion (2024, USA). Export-oriented electronics require internationally recognized measurement traceability and product certification, increasing the commercial value of ISO/IEC 17025-compliant workflows and globally supported instrument platforms.
Market Challenges
High Capital Cost and Procurement Cyclicality
- High-frequency analyzers, semiconductor testers and integrated production cells can require multi-year capital approval. The market's blended revenue per equipment-equivalent unit reached USD 5,411 in 2025, while advanced configurations cost substantially more, extending evaluation and tender cycles.
- Semiconductor and electronics capital spending remains cyclical. Global semiconductor sales fell 8.2% in 2023 before rebounding, which demonstrates how inventory corrections can delay test-capacity additions despite positive long-term technology trends.
- Customers increasingly demand utilization improvements before approving new hardware. This shifts vendor economics toward rentals, software subscriptions, shared platforms and lifecycle services, but can defer instrument replacement and pressure hardware-only suppliers.
Trade Controls and Global Supply-Chain Exposure
- Approximately 75% of global semiconductor manufacturing capacity has been concentrated in China and East Asia. Test-equipment manufacturers depend on specialized semiconductors, displays, RF components and precision assemblies, making continuity planning commercially important.
- A fully duplicated regional semiconductor supply chain could require at least USD 1 trillion of incremental investment and raise chip prices by 35% to 65%. Input-cost inflation can therefore affect instrument pricing, lead times and gross margins.
- Changing export controls can restrict sales of high-performance RF, semiconductor and computing test equipment. Vendors must maintain product classification, end-user screening and geographic revenue controls, increasing compliance costs and potentially limiting access to high-growth international programs.
Skills, Calibration and Interoperability Constraints
- High-frequency, multi-domain and automated test platforms require RF engineers, metrologists, software developers and application specialists. U.S. semiconductor companies directly employ more than 345,000 people, intensifying competition for overlapping technical talent.
- FCC equipment-certification laboratories must maintain ISO/IEC 17025 accreditation for applicable testing. Compliance protects measurement integrity but adds proficiency testing, documentation and audit costs that can constrain smaller laboratories and service providers.
- Software-defined environments create interoperability risk across instruments, test languages and customer data systems. With software and services representing an estimated 41% of 2025 revenue, weak APIs or proprietary data formats can increase switching costs and slow customer adoption.
Market Opportunities
Software-Defined and Recurring Test Platforms
- Vendors can bundle instrument control, waveform analysis, test orchestration, data management and cybersecurity into annual subscriptions. Raising software and service share toward 47% by 2031 supports higher customer lifetime value and improved revenue visibility.
- Instrument manufacturers, test integrators and customers benefit from reusable test sequences and centralized analytics. Keysight's fiscal 2025 revenue increased to USD 5.37 billion, illustrating demand for integrated hardware and software portfolios.
- Suppliers must provide open APIs, secure remote access and cross-vendor data compatibility. Adoption accelerates when software reduces test-development time, improves utilization and allows customers to update capabilities without replacing complete hardware systems.
AI Semiconductor and Advanced-Packaging Test
- High-compute devices require greater test parallelism, thermal management and high-speed interface coverage. Suppliers can monetize semiconductor testers, handlers, probe interfaces, signal-integrity tools and optimization software across design and production stages.
- Automated-test-equipment vendors, component suppliers and engineering-service firms benefit as AI compute, networking and memory programs expand. Teradyne reported USD 883 million of semiconductor-test revenue in Q4 2025.
- Test architectures must support chiplets, advanced packaging, high-bandwidth memory and silicon photonics. Customers will prioritize platforms that reduce test cost per device while preserving fault coverage, yield learning and traceability.
Calibration-as-a-Service and Installed-Base Monetization
- Multi-year calibration, repair, asset-management and compliance contracts convert installed instruments into recurring revenue. Premium service can include onsite calibration, uncertainty reporting, equipment loans and automated certificate management.
- Manufacturers with national service networks, accredited laboratories and specialized metrology providers can capture recurring spend. NVLAP accreditation verifies technical competence for specified calibrations and tests.
- Service providers need digitized asset records, traceable standards and rapid turnaround. A reference standard is typically expected to be substantially more accurate than the device under test, requiring continuing investment in laboratory capability.
CHAPTER 9 - Competitive Landscape
Competitive Landscape Overview
The market is moderately concentrated in high-performance platforms but fragmented in handheld instruments, integration and calibration services. Entry barriers include metrology expertise, software ecosystems, global support networks, intellectual property and long customer qualification cycles.
Market Share Distribution
Top 5 Players
Market Dynamics
8 new entrants in the past 5 years, indicating strong market attractiveness and growth potential.
Company Name | Market Share | Headquarters | Founding Year | Core Market Focus |
|---|---|---|---|---|
Keysight Technologies, Inc. | 17.8% | Santa Rosa, California, USA | 2014 | Electronic design, RF, network, semiconductor and communications test |
Fortive Corporation | 10.4% | Everett, Washington, USA | 2016 | Fluke electrical measurement, Tektronix oscilloscopes and calibration |
Emerson Electric Co. | 8.3% | St. Louis, Missouri, USA | 1890 | National Instruments modular test, automation software and data acquisition |
Rohde & Schwarz GmbH & Co. KG | 7.6% | Munich, Germany | 1933 | RF, microwave, wireless communications and electromagnetic compatibility testing |
Teradyne, Inc. | 6.5% | North Reading, Massachusetts, USA | 1960 | Semiconductor automated test equipment and production test systems |
AMETEK, Inc. | 5.4% | Berwyn, Pennsylvania, USA | 1930 | Precision instruments, power testing, dimensional measurement and calibration |
Anritsu Corporation | 4.2% | Atsugi, Japan | 1931 | Wireless, optical, network and field communications testing |
Advantest Corporation | 3.8% | Tokyo, Japan | 1954 | Semiconductor automated test equipment and device-interface solutions |
Yokogawa Electric Corporation | 2.9% | Tokyo, Japan | 1915 | Power analyzers, oscilloscopes, data acquisition and precision measurement |
VIAVI Solutions Inc. | 2.5% | Chandler, Arizona, USA | 2015 | Network, fiber, wireless and communications service assurance testing |
Cross Comparison Parameters
The report provides detailed cross-comparison of key players across 10 performance parameters to identify competitive strengths and weaknesses.
Measurement Bandwidth and Frequency Coverage
Automated Test Throughput
Test and Measurement Revenue Growth
Gross Margin
Analysis Covered
Market Share Analysis:
Quantifies competitive concentration across principal instrument and test-platform suppliers
Cross Comparison Matrix:
Benchmarks technical coverage, throughput, growth and margin performance systematically
SWOT Analysis:
Assesses portfolio depth, ecosystem lock-in, exposure and execution risks
Pricing Strategy Analysis:
Compares hardware premiums, subscriptions, services and lifecycle contract structures
Company Profiles:
Reviews positioning, product specialization, headquarters and strategic market focus
CHAPTER 10 - REPORT TOC
CHAPTER 14 - Table Of Contents
Phase 1Market Assessment Phase
11
Chapters
Supply-side and competitive intelligence covering market sizing, segmentation, competitive dynamics, regulatory landscape, and future forecasts.
Phase 2Go-To-Market Strategy Phase
15
Chapters
Entry strategy evaluation, execution roadmap, partner recommendations, and profitability outlook.
Complete Report Coverage
201+ detailed sections covering every aspect of the market
143
Assessment Sections
58
Strategy Sections
CHAPTER 11 - Our Approach
Research Methodology
Desk Research
- Reviewed instrument manufacturer financial disclosures
- Mapped electronic measurement industry statistics
- Assessed semiconductor and defense investment
- Evaluated calibration and certification standards
Primary Research
- Test engineering directors and managers
- Semiconductor product-test engineering leaders
- Calibration laboratory operations managers
- Instrument distributors and systems integrators
Validation and Triangulation
- Validated through 312 industry respondents
- Reconciled supplier and customer estimates
- Cross-checked volume and pricing assumptions
- Tested historical and forecast consistency
CHAPTER 12 - FAQ
FAQs
Still have questions?
Our research team is here to help you find the right solution
CHAPTER 13 - Related Research
Explore Related Reports
Expand your market intelligence with complementary research across regions and adjacent markets.
Regional/Country ReportsRelated market analysis across key regions
Related market analysis across key regions
No regional reports found.
Adjacent ReportsRelated markets and complementary research
Related markets and complementary research
No adjacent reports found.
500+
Market Research Reports
50+
Countries Covered
15+
Industry Verticals