CHAPTER 1 - MARKET SUMMARY
Market Overview
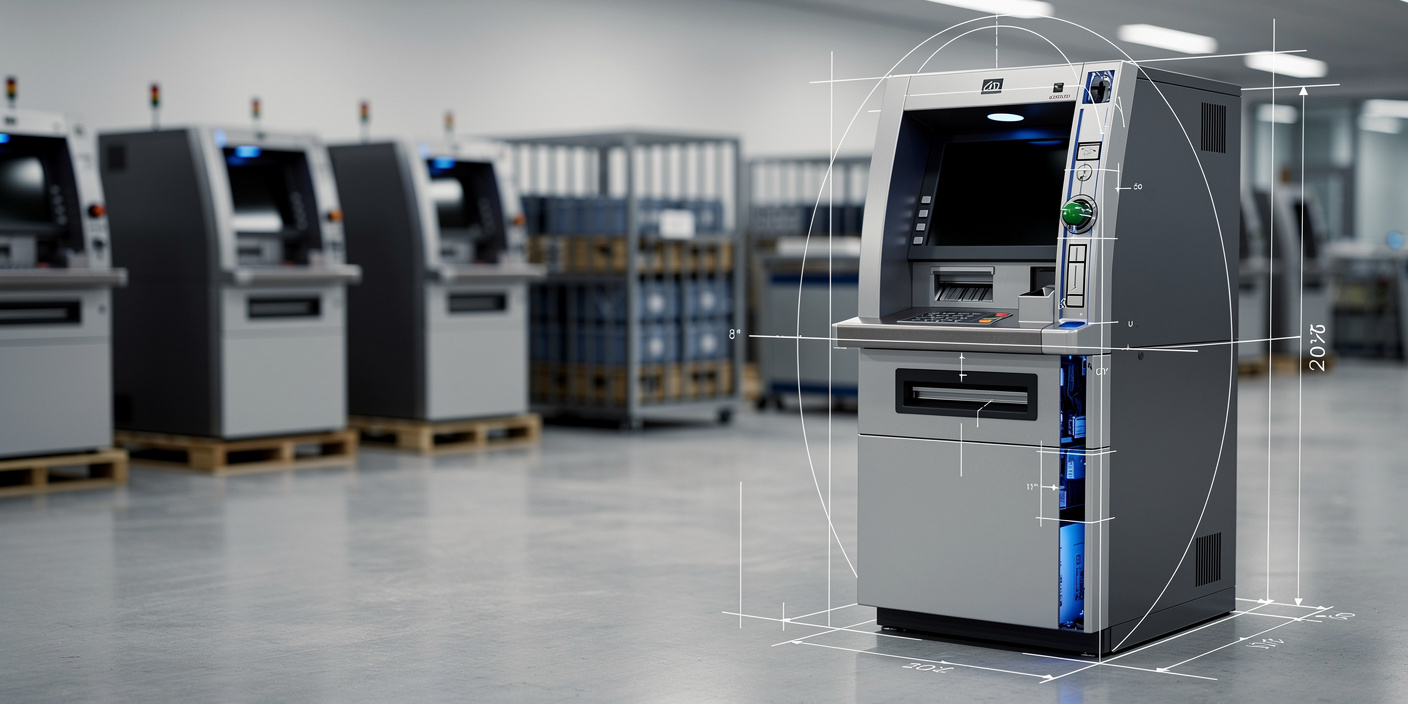
The Vietnam ATM Managed Services & Cash Ops Market coordinates ATM monitoring, cash replenishment, field maintenance, cash processing, reconciliation, security, and service-level management for banks and cash-intensive enterprises. Vietnam operated more than 20,000 ATMs nationally in 2023, creating recurring demand for uptime management, route planning, cash forecasting, incident response, and secure handling across geographically dispersed banking networks.
Ho Chi Minh City, Hanoi, and their surrounding economic corridors represented an estimated 57% of managed ATM and cash-service revenue in 2025. These hubs concentrate large bank headquarters, corporate treasury operations, retail networks, airports, tourism activity, and high transaction-density locations. Route density improves vehicle utilization and technician productivity, making urban contracts more profitable than fragmented provincial deployments with comparable service-level commitments.
Market Value
USD 1.284 billion
2025
Dominant Region
Ho Chi Minh City and Southern Key Economic Region
2025
Dominant Segment
End-to-End ATM Management
fastest growing service segment, 2025
Total Number of Players
35
Future Outlook
The Vietnam ATM Managed Services & Cash Ops Market is projected to increase from USD 1.284 billion in 2025 to USD 1.874 billion by 2031. The 2020-2025 historical CAGR of 8.0% reflected ATM-network modernization, increased outsourcing, higher cash-security requirements, and expansion of integrated service contracts. Growth will moderate but remain positive as banks consolidate suppliers and transfer responsibility for monitoring, maintenance, cash logistics, reconciliation, and regulatory reporting to specialized providers. Revenue growth will increasingly depend on broader contract scope and performance-linked pricing rather than rapid expansion in conventional cash-dispensing terminals.
During 2026-2031, the market is forecast to grow at a 6.5% CAGR. Cash-recycler penetration is expected to rise from 18% of managed endpoints in 2025 to 36% by 2031, reducing basic replenishment frequency but increasing software, preventive maintenance, deposit processing, and reconciliation revenue. ATM-as-a-Service, predictive cash forecasting, remote device management, and shared cash-utility models will gain importance. Providers capable of maintaining high availability across secondary provinces should capture premium contracts, while operators dependent on labor-intensive routes may face margin compression from wages, fuel, security, and compliance expenditure.
6.5%
Forecast CAGR
$1,874 Mn
2030 Projection
Base Year
2025
Historical Period
2020-2025
Forecast Period
2026-2031
Historical CAGR
8.0%
CHAPTER 2 - SCOPE OF REPORT
Scope of the Market
CHAPTER 3 - Key Stakeholders
Key Target Audience
Key stakeholders who can leverage from this market analysis for investment, strategy, and operational planning.
Investors
CAGR, recurring revenue, contract duration, margin resilience, consolidation
Corporates
cash visibility, deposit automation, security, reconciliation, service costs
Government
financial access, payment resilience, cybersecurity, cash integrity, compliance
Operators
fleet uptime, route density, recycler mix, SLA performance
Financial institutions
outsourcing economics, capex avoidance, liquidity optimization, vendor risk
CHAPTER 4 - Market Size & Growth
Market Size, Growth Forecast and Trends
This section evaluates the historical market size, analyzes year-over-year growth dynamics, and presents forecast projections supported by market performance indicators and demand-side drivers.
Historical & Projected Market Size ($ Million)
Year-over-Year Growth Rate (%)
Market Value vs Volume Growth (%)
Historical Market Performance (2020-2025)
Historical performance was strongest in 2024, when market revenue expanded 9.1% as banks resumed modernization programs, upgraded security controls, and enlarged the scope of outsourced cash and maintenance contracts. Growth was lowest in 2021 at 6.5%, reflecting pandemic-related access restrictions and reduced location activity. A material inflection occurred during 2022-2024 as customers shifted from isolated maintenance agreements toward integrated monitoring, cash logistics, and reconciliation. By 2025, managed endpoints reached 16,900, while cash-recycler penetration increased to 18%, supporting higher revenue per endpoint despite slower ATM transaction volume.
Forecast Market Outlook (2026-2031)
The forecast reflects 6.5% annual value growth, taking the market to USD 1.874 billion by 2031. Growth will increasingly exceed service-event volume as contracts incorporate remote monitoring, predictive maintenance, cybersecurity, recycler software, deposit automation, and availability guarantees. Managed endpoints are projected to reach 20,200, while annual cash-service events rise only modestly to 2.04 million. Revenue acceleration will therefore depend on premium service mix and wider outsourcing penetration rather than cash-withdrawal growth. ATM-as-a-Service and outcome-based contracts should gain share among mid-tier banks seeking predictable expenditure and reduced internal operating complexity.
CHAPTER 5 - Market Data
Market Breakdown
The market is moving from labor-intensive cash replenishment toward integrated endpoint management, cash optimization, remote diagnostics, and recycler support. This shift creates recurring technology and service revenue while allowing banks to convert fragmented operating expenditure into measurable service-level commitments.
Year | Market Size (USD Mn) | YoY Growth (%) | Managed ATM Endpoints (000) | Cash Service Events (Mn) | Cash Recycler Share (%) | Period |
|---|---|---|---|---|---|---|
| 2020 | $872 Mn | +- | 13.2 | 1.51 | Forecast | |
| 2021 | $929 Mn | +6.5 | 13.9 | 1.59 | Forecast | |
| 2022 | $1,011 Mn | +8.8 | 14.7 | 1.69 | Forecast | |
| 2023 | $1,100 Mn | +8.8 | 15.6 | 1.80 | Forecast | |
| 2024 | $1,200 Mn | +9.1 | 16.4 | 1.91 | Forecast | |
| 2025 | $1,284 Mn | +7.0 | 16.9 | 1.94 | Forecast | |
| 2026 | $1,367 Mn | +6.5 | 17.5 | 1.96 | Forecast | |
| 2027 | $1,456 Mn | +6.5 | 18.1 | 1.98 | Forecast | |
| 2028 | $1,551 Mn | +6.5 | 18.7 | 2.00 | Forecast | |
| 2029 | $1,652 Mn | +6.5 | 19.2 | 2.02 | Forecast | |
| 2030 | $1,759 Mn | +6.5 | 19.7 | 2.03 | Forecast | |
| 2031 | $1,874 Mn | +6.5 | 20.2 | 2.04 | Forecast |
Managed ATM Endpoints
16,900 endpoints, 2025, Vietnam. Scale improves command-center economics but raises the importance of nationwide technician coverage. Vietnam had more than 20,000 ATMs nationally in 2023.
Cash Service Events
1.94 million events, 2025, Vietnam. Stable event volume places pressure on providers to raise revenue through broader service scope. ATM transaction volume declined 17.30% in 2025.
Cash Recycler Share
18%, 2025, Vietnam. Recycler adoption reduces emergency replenishment while increasing software, reconciliation, and preventive-maintenance requirements. Optimized cash-planning platforms can reduce CIT departures by two to three times.
CHAPTER 6 - Segmentation
Market Segmentation Framework
Comprehensive analysis across key dimensions providing insights into market structure, consumer preferences, and distribution patterns.
No of Segments
7
Dominant Segment
Service Type
Fastest Growing Segment
Delivery Model
Service Type
Customer Type
End-Use Industry
Delivery Model
Business Model
Channel
Geography
Key Segmentation Takeaways
Comprehensive analysis across all extracted segmentation dimensions providing insights into market structure, consumer preferences, and distribution patterns.
Service Type
Service Type is the dominant segmentation dimension because procurement budgets are allocated according to operational responsibility. End-to-End ATM Management captures the broadest revenue pool by combining command-center monitoring, vendor coordination, availability reporting, field support, and cash operations. Providers offering an integrated service stack obtain stronger contract retention and greater control over incident resolution than single-service vendors.
Delivery Model
Delivery Model is the fastest-growing dimension as banks seek to reduce internal coordination, capital requirements, and fragmented accountability. ATM-as-a-Service is expanding from a low base among mid-tier and digital-first institutions because it converts infrastructure ownership into predictable operating expenditure. Adoption depends on measurable uptime, flexible endpoint deployment, cybersecurity controls, and transparent transaction or subscription pricing.
CHAPTER 7 - Regional Analysis
Regional Analysis
Vietnam ranks first among the selected Southeast Asian peer markets by broad ATM managed-services and cash-operations revenue. Its position reflects a large banking system, more than 20,000 national ATMs, dense urban cash routes, and a comparatively broad service scope that includes cash logistics, maintenance, monitoring, and processing.
Focus Country Ranking
1st
Focus Country Market Size
USD 1.284 Bn (2025)
Vietnam CAGR (2026-2031)
6.5%
Focus Country Ranking
1st
Focus Country Market Size
USD 1.284 Bn (2025)
Vietnam CAGR (2026-2031)
6.5%
Regional Analysis (Current Year)
Market Position
Vietnam ranks first among the five peers with USD 1.284 billion in 2025 revenue, supported by a broad cash-service scope and more than 20,000 national ATMs.
Growth Advantage
Vietnam's 6.5% forecast CAGR is near Thailand's 6.8% and above Malaysia's 5.9%, positioning it as a scaled market with moderate, service-mix-led growth.
Competitive Strengths
Dense urban corridors, 16,900 managed endpoints, and rising recycler penetration create scale for centralized monitoring, predictive maintenance, route optimization, and integrated cash-processing contracts.
CHAPTER 8 - INDUSTRY ANALYSIS
Growth Drivers, Market Challenges & Market Opportunities
Comprehensive analysis of key factors shaping the Vietnam ATM Managed Services & Cash Ops Market, including growth catalysts, operational challenges, and emerging opportunities across production, distribution, and consumer segments.
Growth Drivers
Large Installed ATM Base and Financial Access Requirements
- Each geographically distributed endpoint requires cash forecasting, incident response, preventive maintenance, telecommunications support, and reconciliation, creating a recurring service pool across more than 20,000 machines (2023, Vietnam). Providers with national technician and logistics coverage capture multi-region contracts.
- Vietnam's population exceeded 100 million people (2023, Vietnam), supporting continued demand for accessible cash services outside dense digital-payment ecosystems. Banks require mixed physical and digital distribution models, particularly in secondary provinces and cash-intensive commercial clusters.
- Managed endpoint penetration reached an estimated 16,900 ATMs (2025, Vietnam), allowing providers to spread command-center, software, and supervisory costs across larger fleets. Scale improves tender competitiveness and enables tighter availability guarantees.
Expansion of Outsourced and Integrated Service Contracts
- Integrated contracts combine monitoring, cash operations, maintenance, reconciliation, and vendor control under one service-level framework, reducing internal coordination across four major operating workstreams (2025, Vietnam). Large providers can cross-sell software and field services.
- Vietnam has more than 30 commercial banks (2025, Vietnam), creating a sizeable procurement base with varied fleet sizes and outsourcing maturity. Mid-tier banks offer whitespace for standardized managed-service packages and pooled regional support.
- Outcome-based agreements link compensation to uptime, incident closure, and cash availability, allowing banks to compare performance across three primary SLA categories (2025, Vietnam). Providers with remote diagnostics and nationwide field coverage can protect margins through lower repeat visits.
Cash Recycler, Automation, and Predictive Analytics Adoption
- Recycler terminals reuse deposited notes for subsequent withdrawals, lowering cash immobilization and reducing transport requirements across an estimated 3,000 managed recycler endpoints (2025, Vietnam). OEMs and service partners benefit from higher technical complexity and maintenance value.
- Advanced cash-planning software can reduce collection departures by two to three times (industry benchmark), improving vehicle productivity and decreasing emergency cash-outs. Providers can monetize forecasting modules through subscription and performance-linked contracts.
- Remote monitoring detects device faults before service disruption, supporting availability commitments above 98% for premium contracts (2025 benchmark). Banks gain lower downtime, while providers reduce unnecessary dispatches and improve technician scheduling.
Market Challenges
Digital Payments Reduce Withdrawal-Led Service Activity
- Non-cash payments increased 43.32% by volume (first nine months of 2025, Vietnam), accelerating substitution of routine withdrawals and balance inquiries. Providers must replace transaction-linked revenue with monitoring, security, recycler, and deposit-automation services.
- Internet transaction volume increased 40.41% (Q1 2025, Vietnam), enabling customers to conduct transfers, bill payments, and account management without visiting terminals. Conventional cash-dispensing locations face weaker utilization and greater pressure on unit economics.
- QR-code transaction volume increased 81.64% (Q1 2025, Vietnam), particularly affecting low-value retail cash usage. ATM providers require multifunction deployment strategies focused on deposits, identity services, account onboarding, and cash recycling.
Route Costs and Fragmented Provincial Economics
- Fuel, wages, security staffing, insurance, and vehicle costs create high fixed expenditure for routes serving low-density provinces. An indicative monthly operating cost of USD 63 per basic ATM activity component (2025, Vietnam) can become uneconomic when visits are fragmented.
- The Central Urban Corridor and secondary provinces account for about 43% of market revenue (2025, Vietnam) but span longer travel distances than Hanoi and Ho Chi Minh City clusters. Providers need regional depots, technicians, and secure cash facilities before achieving efficient route density.
- Fixed-fee contracts expose providers when labor and logistics inflation exceed tender assumptions over agreements commonly lasting three to five years (2025 benchmark). Indexation clauses and activity bands are necessary to protect margins.
Cybersecurity, Fraud, and Physical Cash Risk
- ATM environments connect payment switching, bank cores, telecommunications, endpoint software, and maintenance access, creating multiple attack surfaces across five critical technology layers (2025, Vietnam). Providers must invest in patching, encryption, privileged-access control, and real-time alerts.
- Personal-data requirements under Decree 13/2023 apply to identity, transaction, surveillance, and service records, increasing documentation and access-control obligations from July 2023 onward (Vietnam). Non-compliant subcontractors can create bank-level regulatory exposure.
- Physical cash operations require dual control, secure vehicles, route confidentiality, vault reconciliation, and incident response across approximately 1.94 million annual service events (2025, Vietnam). A single control failure can create financial loss and reputational damage.
Market Opportunities
ATM-as-a-Service for Mid-Tier and Digital-First Banks
- Monthly endpoint subscriptions combine hardware access, software, maintenance, security, and monitoring into recurring revenue, supporting contract periods of five to seven years (2031 model, Vietnam). Providers gain predictable cash flows and cross-selling opportunities.
- Mid-tier banks avoid upfront terminal investment and can expand or relocate fleets through variable capacity. A target pool of more than 20 smaller and mid-sized institutions (2025, Vietnam) supports standardized service packages.
- Contracts require clear asset ownership, cybersecurity accountability, interoperability, and exit provisions, with performance measured against at least 98% endpoint availability (future premium SLA). Transparent data access will determine bank acceptance.
Cash Recycler Retrofit and Deposit Automation
- Retrofit programs generate hardware integration, software licensing, preventive maintenance, note-validation, and reconciliation fees across an incremental 4,200 recycler endpoints by 2031 (Vietnam). Lifecycle services create more value than basic cash loading.
- Banks reduce idle cash and emergency visits, cash-logistics providers gain more predictable schedules, and retailers obtain convenient deposit access. Optimized planning can reduce CIT departures by two to three times (industry benchmark).
- Banks must integrate recycler balances with treasury forecasting, core banking, dispute systems, and cash centers through real-time data interfaces (2031 requirement). Standardized note-quality and settlement controls are also required.
Shared Cash Utility and Network Consolidation
- A neutral utility can charge participating banks for pooled cash forecasting, route execution, settlement, and shared command-center capacity across four core service modules (2031 model, Vietnam). Scale supports stronger margins than isolated routes.
- Smaller banks gain national coverage without building proprietary depots, while established providers increase route density and asset utilization. Initial deployment could prioritize the two largest economic hubs representing 57% of revenue (2025, Vietnam).
- Participating institutions need common settlement rules, data segregation, liability allocation, and service-priority protocols covering 100% of pooled transactions and cash movements (future requirement). Regulatory approval and independent governance are central to adoption.
CHAPTER 9 - Competitive Landscape
Competitive Landscape Overview
The market is moderately concentrated, with large operator banks controlling the highest service-demand pools while OEMs, technology integrators, cash processors, and security-logistics specialists compete for outsourced contracts.
Market Share Distribution
Top 5 Players
Market Dynamics
8 new entrants in the past 5 years, indicating strong market attractiveness and growth potential.
Company Name | Market Share | Headquarters | Founding Year | Core Market Focus |
|---|---|---|---|---|
Agribank | 12.5% | Hanoi, Vietnam | 1988 | Nationwide ATM operations, provincial cash distribution, and financial-access infrastructure |
Vietcombank | 10.8% | Hanoi, Vietnam | 1963 | High-volume urban ATM fleet, card services, and integrated cash operations |
BIDV | 10.5% | Hanoi, Vietnam | 1957 | Large retail banking network, ATM management, and cash-service procurement |
VietinBank | 9.8% | Hanoi, Vietnam | 1988 | National self-service network, cash processing, monitoring, and maintenance |
Techcombank | 6.4% | Hanoi, Vietnam | 1993 | Digital-led banking, high-availability terminals, and modernized service operations |
MB Bank | 5.8% | Hanoi, Vietnam | 1994 | Integrated digital and physical banking, ATM monitoring, and cash optimization |
Sacombank | 5.4% | Ho Chi Minh City, Vietnam | 1991 | Southern retail network, cash services, and provincial ATM operations |
VPBank | 4.9% | Hanoi, Vietnam | 1993 | Consumer-banking terminals, outsourced support, and service-level management |
ACB | 4.7% | Ho Chi Minh City, Vietnam | 1993 | Urban retail ATM network, cash availability, and preventive maintenance |
HDBank | 3.8% | Ho Chi Minh City, Vietnam | 1990 | Retail and consumer-finance ATM services, monitoring, and cash operations |
Cross Comparison Parameters
The report provides detailed cross-comparison of key players across 10 performance parameters to identify competitive strengths and weaknesses.
Managed ATM Endpoints
Fleet Uptime
Service Revenue Growth
EBITDA Margin
Analysis Covered
Market Share Analysis:
Quantifies operator spending concentration and outsourced service demand by fleet
Cross Comparison Matrix:
Benchmarks uptime, endpoint scale, growth, and profitability across operators nationally
SWOT Analysis:
Assesses technology depth, route economics, security exposure, and client access
Pricing Strategy Analysis:
Compares fixed-fee, transaction-linked, activity-based, and outcome-based commercial structures across contracts
Company Profiles:
Reviews ownership, fleet footprint, service focus, and expansion priorities nationally
CHAPTER 10 - REPORT TOC
CHAPTER 14 - Table Of Contents
Phase 1Market Assessment Phase
11
Chapters
Supply-side and competitive intelligence covering market sizing, segmentation, competitive dynamics, regulatory landscape, and future forecasts.
Phase 2Go-To-Market Strategy Phase
15
Chapters
Entry strategy evaluation, execution roadmap, partner recommendations, and profitability outlook.
Complete Report Coverage
201+ detailed sections covering every aspect of the market
143
Assessment Sections
58
Strategy Sections
CHAPTER 11 - Our Approach
Research Methodology
Desk Research
- State Bank ATM statistics review
- Bank fleet disclosures and tenders
- OEM service portfolio mapping
- Cash logistics cost benchmarking
Primary Research
- ATM channel directors and operations heads
- Cash center managers and treasury officers
- Field maintenance managers and OEM leads
- Bank procurement directors and risk officers
Validation and Triangulation
- 312 interviews across operator cohorts
- Fleet counts reconciled against disclosures
- Prices normalized by contract scope
- Cash events checked against volumes
CHAPTER 12 - FAQ
FAQs
Still have questions?
Our research team is here to help you find the right solution
CHAPTER 13 - Related Research
Explore Related Reports
Expand your market intelligence with complementary research across regions and adjacent markets.
Regional/Country ReportsRelated market analysis across key regions
Related market analysis across key regions
No regional reports found.
Adjacent ReportsRelated markets and complementary research
Related markets and complementary research
No adjacent reports found.
500+
Market Research Reports
50+
Countries Covered
15+
Industry Verticals