CHAPTER 1 - MARKET SUMMARY
Market Overview
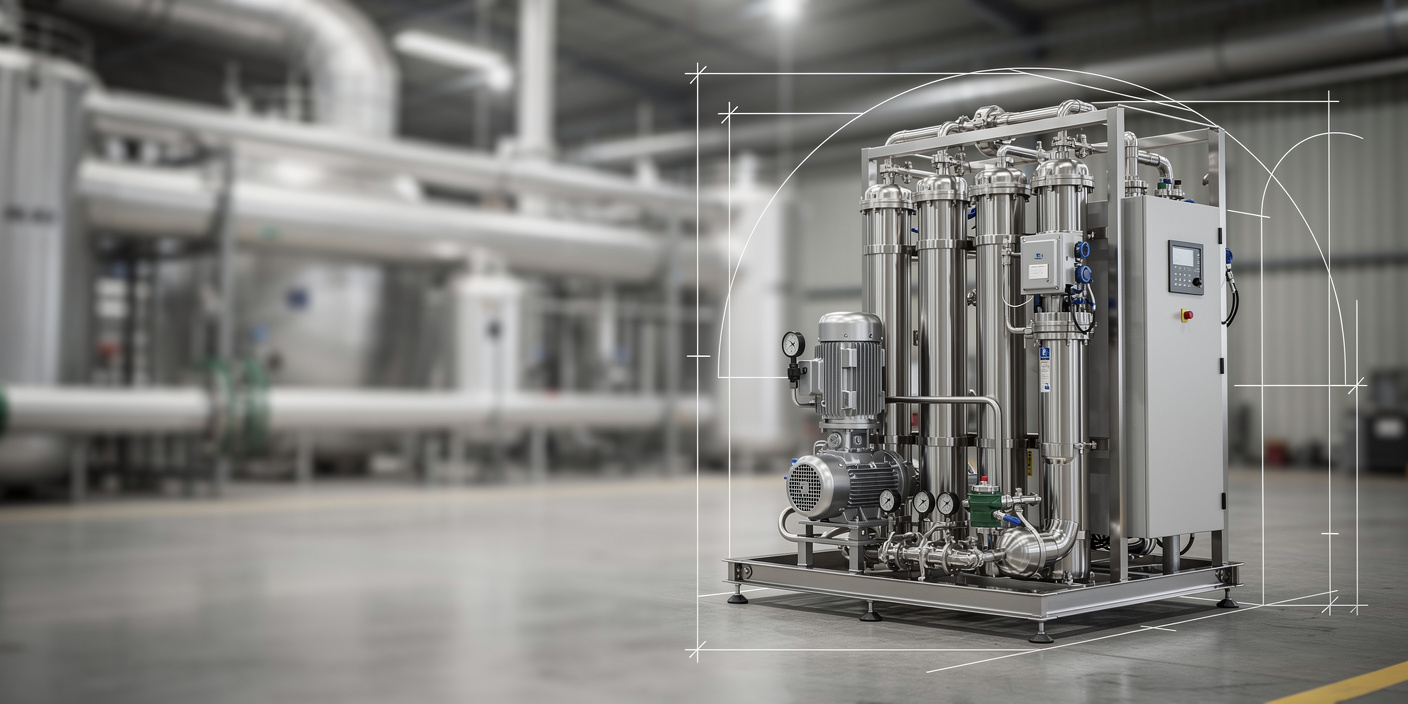
The Watermaker Market comprises packaged systems that convert seawater or brackish water into freshwater aboard commercial ships, yachts, naval vessels, offshore platforms, aquaculture assets, and remote facilities. Demand is structurally linked to the global merchant fleet, which included approximately 112,500 vessels and 2.44 billion deadweight tons in 2025. This installed base creates recurring equipment, membrane, pump, consumable, and service demand.
Europe remains the largest revenue region because it combines yacht construction, cruise operations, marine equipment manufacturing, specialized distributors, and an extensive installed fleet requiring technical support. Asia Pacific is the principal newbuild integration hub, with China, South Korea, and Japan accounting for approximately 91% of ships completed in 2025. OEM access in these clusters materially influences supplier scale and specification wins.
Market Value
USD 790 Mn
2025
Dominant Region
Europe
2025
Dominant Segment
Commercial Shipping
Application, 2025
Total Number of Players
140
Future Outlook
The Watermaker Market is projected to increase from USD 790 Mn in 2025 to USD 1,197 Mn by 2031, representing a forecast CAGR of 7.2%. Expansion will be driven by commercial fleet additions, yacht and cruise demand, offshore energy projects, naval modernization, aquaculture installations, and replacement of older freshwater generators. Revenue growth is expected to outpace shipment growth because buyers increasingly specify energy-recovery devices, automated salinity monitoring, variable-frequency drives, corrosion-resistant materials, remote diagnostics, and extended service coverage. Asia Pacific will lead incremental OEM installations, while Europe and North America will remain important retrofit and aftermarket pools.
Historical growth averaged 5.7% between 2020 and 2025, reflecting pandemic-related marine disruption followed by recovery in ship utilization, leisure boating, passenger cruising, and shipyard activity. Between 2026 and 2031, system-equivalent shipments are expected to rise from 19.8 thousand to 26.0 thousand units, while the blended selling price increases from USD 42.6 thousand to USD 46.0 thousand. Reverse osmosis revenue share is forecast to reach 74.0% by 2031 as energy-recovery configurations gain adoption. Commercial success will increasingly depend on OEM approvals, global service access, membrane availability, digital monitoring, and demonstrable energy savings.
7.2%
Forecast CAGR
$1,197 Mn
2030 Projection
Base Year
2025
Historical Period
2020-2025
Forecast Period
2026-2031
Historical CAGR
5.7%
CHAPTER 2 - SCOPE OF REPORT
Scope of the Market
CHAPTER 3 - Key Stakeholders
Key Target Audience
Key stakeholders who can leverage this market analysis for investment, strategy, procurement, product development, and operational planning.
Investors
CAGR, installed base, recurring revenue, margins, technology risk
Corporates
market entry, pricing, channel coverage, product portfolio, partnerships
Government
maritime safety, defense readiness, water resilience, localization, compliance
Operators
energy use, water output, downtime, maintenance, spare availability
Financial institutions
asset finance, retrofit payback, covenants, residual value, demand stability
CHAPTER 4 - Market Size & Growth
Market Size, Growth Forecast and Trends
This section evaluates the historical market size, analyzes year-over-year growth dynamics, and presents forecast projections supported by market performance indicators and demand-side drivers.
Historical & Projected Market Size ($ Million)
Year-over-Year Growth Rate (%)
Market Value vs Volume Growth (%)
Historical Market Performance (2020-2025)
Market value increased by USD 190 Mn between 2020 and 2025. The strongest historical annual expansion occurred in 2023 at 6.3%, following normalization of shipyard schedules, recreational boating activity, and cruise operations. System-equivalent shipments rose from 15.1 thousand to 18.8 thousand units, a 4.5% CAGR. The value growth premium over volume reflected improving product mix, higher component costs, greater automation, and increased adoption of energy-recovery configurations. Commercial shipping and recreational boating together generated approximately 65% of 2025 application revenue, making fleet utilization, yacht production, and retrofit budgets important demand indicators.
Forecast Market Outlook (2026-2031)
Forecast growth accelerates from 6.8% in 2026 to 7.5% in 2031 as energy-efficient reverse osmosis, digital controls, and retrofit replacement gain momentum. Shipments are projected to reach 26.0 thousand system equivalents by 2031, while blended ASP rises to USD 46.0 thousand. Reverse osmosis revenue share is forecast to expand by 2.5 percentage points from its 2025 level, supported by pump efficiency improvements and compact system architectures. Asia Pacific is expected to deliver the strongest regional growth, while European and North American installed fleets support recurring membrane, pump, filter, commissioning, and technical-service revenue.
CHAPTER 5 - Market Data
Market Breakdown
The Watermaker Market combines moderate shipment expansion with improving product mix and higher lifecycle value. For CEOs and investors, the principal indicators are system-equivalent shipments, blended selling price, and the revenue share of reverse osmosis technologies.
Year | Market Size (USD Mn) | YoY Growth (%) | System Shipments (000 Units) | Blended ASP (USD 000) | RO Revenue Share (%) | Period |
|---|---|---|---|---|---|---|
| 2020 | $600 Mn | +- | 15.1 | 39.7 | Forecast | |
| 2021 | $628 Mn | +4.7% | 15.6 | 40.3 | Forecast | |
| 2022 | $664 Mn | +5.7% | 16.3 | 40.7 | Forecast | |
| 2023 | $706 Mn | +6.3% | 17.1 | 41.3 | Forecast | |
| 2024 | $746 Mn | +5.7% | 18.0 | 41.4 | Forecast | |
| 2025 | $790 Mn | +5.9% | 18.8 | 42.0 | Forecast | |
| 2026F | $844 Mn | +6.8% | 19.8 | 42.6 | Forecast | |
| 2027F | $902 Mn | +6.9% | 20.9 | 43.2 | Forecast | |
| 2028F | $967 Mn | +7.2% | 22.0 | 44.0 | Forecast | |
| 2029F | $1,037 Mn | +7.2% | 23.2 | 44.7 | Forecast | |
| 2030F | $1,114 Mn | +7.4% | 24.5 | 45.5 | Forecast | |
| 2031F | $1,197 Mn | +7.5% | 26.0 | 46.0 | Forecast |
System Shipments
18.8 thousand units, 2025, global. Shipment growth determines manufacturing load, channel inventory, membrane consumption, and commissioning demand. The commercial fleet contained approximately 112,500 vessels in 2025, providing a broad installed base for replacement and retrofit activity.
Blended ASP
USD 42.0 thousand, 2025, global. ASP reflects substantial variation between compact leisure systems and engineered commercial packages. Available products span roughly 145 to 100,000 gallons per day, confirming that capacity, redundancy, automation, certification, and installation complexity materially influence transaction value.
RO Revenue Share
71.5%, 2025, global. Reverse osmosis leads because it supports compact modular configurations across leisure and commercial applications. Advanced high-pressure pumps can reach 92% efficiency, improving lifecycle economics where pumping represents a major operating-cost component.
CHAPTER 6 - Segmentation
Market Segmentation Framework
Comprehensive analysis across key dimensions providing insights into market structure, customer requirements, technology choices, pricing, and distribution patterns.
No of Segments
7
Dominant Segment
Application
Fastest Growing Segment
Technology
Product Type
Application
End User
Technology
Price Tier
Distribution Channel
Geography
Key Segmentation Takeaways
Comprehensive analysis across all extracted segmentation dimensions provides insight into market structure, procurement requirements, system economics, and route-to-market priorities.
Application
Application is the dominant commercial dimension because capacity, redundancy, materials, certification, and service requirements differ substantially between merchant vessels, yachts, naval platforms, and remote facilities. Commercial Shipping generates the largest revenue pool through fleet-scale demand, regulated crew requirements, long operating cycles, and repeatable replacement needs. Recreational Boats and Yachts support a broader unit base but typically purchase lower-capacity configurations.
Technology
Technology is the fastest-growing dimension as customers migrate from fixed-speed conventional equipment toward energy-recovery RO, variable-frequency pumping, automated flushing, remote diagnostics, and hybrid power integration. Energy-Recovery RO is expected to produce the strongest incremental revenue because fuel and electricity savings improve lifecycle economics. Automated Solar and Hybrid Systems create an additional growth pathway in yachts, aquaculture, islands, emergency response, and off-grid infrastructure.
CHAPTER 7 - Regional Analysis
Regional Analysis
Regional demand reflects differences in fleet ownership, shipbuilding activity, yacht manufacturing, cruise deployment, offshore investment, and availability of marine service networks. Europe leads current revenue, while Asia Pacific provides the strongest forecast expansion because new vessel construction and marine equipment integration are concentrated in major Asian shipbuilding economies.
Dominant Region
Europe
Fastest Growing Region
Asia Pacific
Regions Covered
5
Dominant Region
Europe
Fastest Growing Region
Asia Pacific
Regions Covered
5
Regional Analysis (Current Year)
Regional Analysis Comparison
Market Position
Europe ranks first at USD 253 Mn in 2025, supported by concentrated yacht building, cruise activity, marine engineering suppliers, and established retrofit networks serving commercial and leisure fleets.
Growth Advantage
Asia Pacific's 8.8% forecast CAGR exceeds Europe's 6.6%, supported by the fact that China, South Korea, and Japan completed approximately 91% of new ships in 2025.
Competitive Strengths
Europe combines installed-fleet service demand with specialized water-treatment engineering, while Asia Pacific provides scale through shipyard integration and a dominant share of global vessel construction.
CHAPTER 8 - INDUSTRY ANALYSIS
Growth Drivers, Market Challenges & Market Opportunities
Comprehensive analysis of key factors shaping the Watermaker Market, including growth catalysts, operational challenges, and emerging opportunities across production, distribution, and end-user segments.
Growth Drivers
Expanding Commercial Fleet and Cruise Activity
- Global carrying capacity reached approximately 2.44 billion deadweight tons (2025, global), increasing the number and scale of vessels requiring dependable freshwater-production systems and lifecycle support.
- Ocean-going cruise passenger volume was forecast at 37.7 million travelers (2025, global), strengthening high-capacity potable-water demand, redundancy requirements, and passenger-comfort specifications.
- The global cruise fleet comprised approximately 310 ocean-going vessels (2025, global), creating concentrated opportunities for engineered systems, spares, membranes, pumps, monitoring, and fleetwide service agreements.
Mandatory Potable-Water Compliance
- The WHO Guide to Ship Sanitation is in its third edition (global guidance), reinforcing preventive controls for water production, bunkering, storage, treatment, and onboard distribution.
- Current WHO guidance promotes one end-to-end Water Safety Plan framework, encouraging equipment suppliers to support monitoring, alarm, documentation, validation, and corrective-action functions.
- Commercial product capacity spans approximately 145 to 100,000 gallons per day, enabling vessel-specific compliance from small boats to passenger ships and offshore installations.
Energy-Efficient Reverse Osmosis Economics
- High-pressure pumping can represent about 65% of desalination plant operating expenditure, making energy recovery and pump selection financially material for fleets and remote operators.
- Danfoss high-pressure pumps are used in more than 20,000 seawater RO systems globally, demonstrating commercial maturity and reducing adoption risk for marine integrators.
- Two-stage freshwater-generation technology can reduce electrical consumption by approximately 50% compared with conventional arrangements, strengthening the investment case for fleet upgrades.
Market Challenges
Energy and Lifecycle Cost Exposure
- Average seawater salinity is approximately 35 parts per thousand, requiring substantial pressure, corrosion-resistant components, effective pretreatment, and disciplined membrane management.
- Energy-recovery systems can use up to 80% less power than conventional watermakers, indicating a significant operating-cost disadvantage for older installed equipment.
- High-capacity systems approaching 100,000 gallons per day magnify the financial impact of inefficient pumps, membrane fouling, unplanned downtime, and poor spare-parts availability.
Fouling, Corrosion and Feedwater Variability
- Water systems must control risks across at least 4 operational stages, production, storage, distribution, and point-of-use delivery, increasing commissioning and crew-training requirements.
- Membrane systems require pretreatment against suspended solids, biological growth, hydrocarbons, and scaling compounds, with failures potentially affecting 100% of produced-water quality.
- Output specifications below approximately 2 parts per million salinity require reliable separation, sensors, diversion controls, and maintenance, increasing system complexity and service dependence.
Concentrated Shipbuilding and Certification Cycles
- Asia and Europe controlled approximately 93% of global carrying capacity (2026), limiting addressable demand in regions without large shipowning or shipbuilding ecosystems.
- Asian owners represented approximately 56% of global fleet capacity, increasing the need for local technical sales, shipyard relationships, documentation, and spare-parts support.
- European owners represented approximately 34% of global fleet capacity, but procurement is fragmented across flags, vessel classes, ship managers, and national compliance practices.
Market Opportunities
Energy-Recovery Retrofit Programs
- Suppliers can monetize audits, replacement pumps, pressure-recovery modules, automation, commissioning, and service contracts across an installed fleet exceeding 112,500 vessels.
- Shipowners, yacht managers, offshore operators, and service yards benefit because pump efficiency approaching 92% can reduce energy use and improve freshwater availability.
- Opportunity realization requires standardized retrofit kits, verified energy baselines, remote monitoring, trained dealers, and warranties covering at least 4 critical subsystems, pumps, membranes, controls, and pretreatment.
Asia Pacific OEM Integration
- Revenue can be captured through shipyard-approved packages, local assembly, commissioning, documentation, and lifecycle contracts as the global fleet approaches 116,000 vessels of at least 100 GT in 2026.
- Manufacturers, pump suppliers, control vendors, membrane companies, and Asian distributors benefit from concentration across 3 leading shipbuilding economies, reducing project-acquisition dispersion.
- Success requires local engineering, class documentation, shipyard vendor registration, short lead times, regional inventories, and service coverage across at least 3 major Asian maritime clusters.
Cruise, Remote and Modular Water Supply
- Modular product families spanning 145 to 100,000 gallons per day support differentiated pricing across yachts, cruise ships, ferries, offshore assets, and emergency facilities.
- Operators and integrators benefit from platforms covering approximately 0.5 to 1,000 cubic meters per day, enabling common controls and parts across multiple capacity classes.
- Growth requires pre-engineered skids, solar and battery compatibility, remote diagnostics, potable-water validation, and dependable service for operations that may remain offshore for several consecutive months.
CHAPTER 9 - Competitive Landscape
Competitive Landscape Overview
The market is fragmented across global marine-equipment groups, specialist manufacturers, yacht-focused brands, and regional integrators. Entry barriers include engineering reliability, energy performance, vessel approvals, distribution access, commissioning expertise, and global aftermarket support.
Market Share Distribution
Top 5 Players
Market Dynamics
8 new entrants in the past 5 years, indicating strong market attractiveness and growth potential.
Company Name | Market Share | Headquarters | Founding Year | Core Market Focus |
|---|---|---|---|---|
Parker Hannifin (Village Marine) | - | Cleveland, United States | 1917 | Marine reverse-osmosis systems, pumps, controls, and high-capacity packaged watermakers |
Alfa Laval | - | Lund, Sweden | 1883 | Waste-heat freshwater generators, thermal separation, marine systems, and lifecycle services |
Wärtsilä | - | Helsinki, Finland | 1834 | Integrated marine freshwater systems, vessel technologies, automation, and lifecycle support |
Sasakura Engineering | - | Osaka, Japan | 1949 | Marine freshwater generators, evaporators, desalination engineering, and waste-heat systems |
Hatenboer-Water | - | Schiedam, Netherlands | 1906 | Marine potable-water systems, reverse osmosis, disinfection, testing, and service |
Schenker Watermakers | - | Naples, Italy | 1998 | Energy-recovery watermakers for sailing yachts, motor yachts, and compact marine applications |
Katadyn Group (Spectra Watermakers) | - | Kemptthal, Switzerland | 1928 | Energy-efficient yacht, expedition, military, and remote reverse-osmosis systems |
FCI Watermakers | - | Salt Lake City, United States | - | Yacht, commercial marine, offshore, industrial, and customized desalination systems |
Tecnicomar | - | Marsala, Italy | 1978 | Watermakers for yachting, naval, offshore, commercial, and remote applications |
Dessalator | - | Antibes, France | - | Compact and high-capacity yacht watermakers with automated control configurations |
Cross Comparison Parameters
The report provides detailed cross-comparison of key players across 10 performance parameters to identify competitive strengths and weaknesses.
Installed Production Range
Energy Consumption per Cubic Meter
Watermaker Revenue Growth
Aftermarket Service Margin
Analysis Covered
Market Share Analysis:
Estimates supplier positioning across marine, leisure, offshore, and defense demand.
Cross Comparison Matrix:
Compares capacity range, efficiency, growth, service economics, and channel reach.
SWOT Analysis:
Identifies technology, distribution, certification, sourcing, and lifecycle support advantages.
Pricing Strategy Analysis:
Benchmarks value drivers across compact, commercial, and customized systems.
Company Profiles:
Reviews portfolio, geographic presence, application focus, and competitive positioning.
CHAPTER 10 - REPORT TOC
CHAPTER 14 - Table Of Contents
Phase 1Market Assessment Phase
11
Chapters
Supply-side and competitive intelligence covering market sizing, segmentation, competitive dynamics, regulatory landscape, and future forecasts.
Phase 2Go-To-Market Strategy Phase
15
Chapters
Entry strategy evaluation, execution roadmap, partner recommendations, and profitability outlook.
Complete Report Coverage
201+ detailed sections covering every aspect of the market
143
Assessment Sections
58
Strategy Sections
CHAPTER 11 - Our Approach
Research Methodology
Desk Research
- Mapped global commercial vessel fleet
- Reviewed marine potable-water compliance standards
- Benchmarked watermaker product capacity ranges
- Assessed shipbuilding and boating indicators
Primary Research
- Interviewed marine equipment procurement directors
- Consulted shipyard systems integration managers
- Engaged watermaker product engineering leads
- Interviewed fleet technical superintendents globally
Validation and Triangulation
- Triangulated evidence from 328 respondents
- Reconciled value volume and ASP
- Tested regional shares against shipbuilding
- Stress-tested efficiency adoption assumptions
CHAPTER 12 - FAQ
FAQs
Still have questions?
Our research team is here to help you find the right solution
CHAPTER 13 - Related Research
Explore Related Reports
Expand your market intelligence with complementary research across regions and adjacent markets.
Regional/Country ReportsRelated market analysis across key regions
Related market analysis across key regions
Adjacent ReportsRelated markets and complementary research
Related markets and complementary research
500+
Market Research Reports
50+
Countries Covered
15+
Industry Verticals