CHAPTER 1 - MARKET SUMMARY
Market Overview
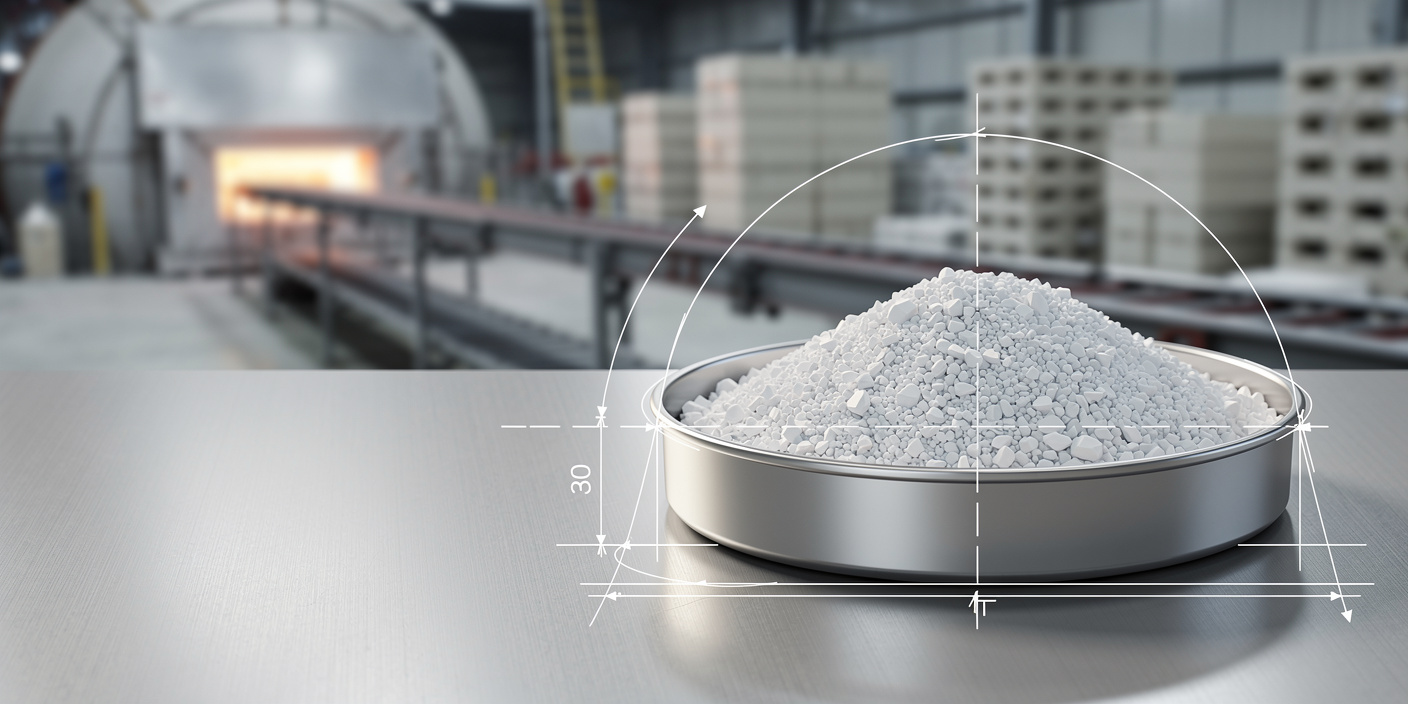
White Fused Alumina Market operates as a high purity synthetic alumina mineral market, where producers fuse calcined alumina above 2,000 degrees Celsius, crush it, classify it, and sell grits or powders by specification. Demand is anchored in steel, foundry, and precision metalworking users, with 2024 crude steel production reported across 71 countries representing about 98% of global output.
Asia Pacific is the operating center because China combines alumina availability, electric arc furnace clusters, and export logistics. In 2024, China exported artificial corundum worth USD 710.4 Mn with 918,913 tons shipped under HS 281810, creating a scale advantage in standard abrasive and refractory grades and setting the global spot price reference for many buyers.
Market Value
USD 842.0 Mn
2025
Dominant Region
Asia Pacific
2025
Dominant Segment
Micro Powder WFA
fastest growing
Total Number of Players
190
Future Outlook
White Fused Alumina Market is projected to expand from USD 842.0 Mn in 2025 to USD 1,115.6 Mn in 2031, implying a 4.8% forecast CAGR. The market recovered at a 4.7% historical CAGR during 2020-2025 after a 2020 trough caused by factory interruptions and buyer destocking. The 2026-2031 path assumes stable white alumina feedstock, continued export availability from China, and measured growth in high purity abrasive and refractory applications.
The projected forecast is volume-led but margin-sensitive. Total saleable WFA volume is estimated to move from 1.07 Mn tons in 2025 to 1.32 Mn tons in 2031, while average selling price moves from USD 790.6 per ton to USD 847.7 per ton. Faster growth is expected in micro powder, low sodium, and specialty grades because buyers in electronics, aerospace finishing, and advanced ceramics pay for impurity control rather than only hardness.
4.8%
Forecast CAGR
$1,115.6 Mn
2030 Projection
Base Year
2025
Historical Period
2020-2025
Forecast Period
2026-2031
Historical CAGR
4.7%
CHAPTER 2 - SCOPE OF REPORT
Scope of the Market
CHAPTER 3 - Key Stakeholders
Key Target Audience
Key stakeholders who can leverage from this market analysis for investment, strategy, and operational planning.
Investors
CAGR, furnace capex, ASP spread, purity premium
Corporates
procurement cost, qualification risk, grain consistency, inventory
Government
trade resilience, carbon compliance, industry capacity, exports
Operators
furnace yield, power cost, classification accuracy, QA
Financial institutions
project finance, collateral quality, offtake visibility, margins
CHAPTER 4 - Market Size & Growth
Market Size, Growth Forecast and Trends
This section evaluates the historical market size, analyzes year-over-year growth dynamics, and presents forecast projections supported by market performance indicators and demand-side drivers.
Historical & Projected Market Size ($ Million)
Year-over-Year Growth Rate (%)
Market Value vs Volume Growth (%)
Historical Market Performance (2020-2025)
Historical performance shows a 2020 trough, followed by rebuilding in 2021 and 2022 as abrasive tool producers restarted procurement. The peak historical YoY rate was 5.3% in 2022, while 2023 slowed to 2.9% as European energy costs and metalworking inventories compressed spot demand. Demand concentration remained high, with abrasive and refractory uses absorbing an estimated 85% of 2025 tonnage.
Forecast Market Outlook (2026-2031)
Forecast growth is expected to normalize around specification-led replacement demand rather than broad capacity expansion. The terminal 2031 base case reaches USD 1,115.6 Mn, with volume at 1.32 Mn tons and high purity micro powder mix moving toward 18.0% of market value. Growth acceleration is strongest where customers specify low sodium and low iron grades for electronics, aerospace finishing, and technical ceramics.
CHAPTER 5 - Market Data
Market Breakdown
The market breakdown highlights how WFA value creation depends on purity grade, particle-size consistency, and route-to-market resilience. CEOs and investors should treat the market as a specialty mineral system with commodity exposure at the base and premium pricing in micro powder and low sodium grades.
Year | Market Size (USD Mn) | YoY Growth (%) | Volume (000 tons) | ASP (USD per ton) | High Purity Mix (%) | Period |
|---|---|---|---|---|---|---|
| 2020 | $670.0 Mn | +- | 910 | 736.3 | Forecast | |
| 2021 | $700.8 Mn | +4.6% | 938 | 747.1 | Forecast | |
| 2022 | $738.2 Mn | +5.3% | 980 | 753.3 | Forecast | |
| 2023 | $759.9 Mn | +2.9% | 1,005 | 756.1 | Forecast | |
| 2024 | $800.0 Mn | +5.3% | 1,033 | 774.4 | Forecast | |
| 2025 | $842.0 Mn | +5.2% | 1,065 | 790.6 | Forecast | |
| 2026F | $882.4 Mn | +4.8% | 1,103 | 800.0 | Forecast | |
| 2027F | $924.8 Mn | +4.8% | 1,142 | 809.8 | Forecast | |
| 2028F | $969.2 Mn | +4.8% | 1,183 | 819.3 | Forecast | |
| 2029F | $1,015.7 Mn | +4.8% | 1,226 | 828.5 | Forecast | |
| 2030F | $1,064.5 Mn | +4.8% | 1,270 | 838.2 | Forecast | |
| 2031F | $1,115.6 Mn | +4.8% | 1,316 | 847.7 | Forecast |
Volume
918,913 tons, 2024, China exports under HS 281810. This anchors global tradeable supply and shows why Chinese producers remain the price reference. China exported USD 710.4 Mn of artificial corundum in 2024.
ASP
USD 600-1,000 per ton, 2025, standard abrasive-grade WFA. This price band supports the base-case unit economics and separates commodity grits from premium powders. High purity and micro powder grades can price above standard bulk lots.
High Purity Mix
99% plus Al2O3 specification, 2025, WFA product standard. Purity shifts procurement from lowest-price sourcing toward validated suppliers. CUMI describes WFA as controlled Bayer alumina fused in electric arc furnaces above 2,000 degrees Celsius.
CHAPTER 6 - Segmentation
Market Segmentation Framework
Comprehensive analysis across key dimensions providing insights into market structure, consumer preferences, and distribution patterns.
No of Segments
7
Dominant Segment
Product Type
Fastest Growing Segment
Technology
Product Type
Application
End-Use Industry
Customer Type
Sales Channel
Technology
Geography
Key Segmentation Takeaways
Comprehensive analysis across all extracted segmentation dimensions providing insights into market structure, consumer preferences, and distribution patterns.
Product Type
Product type is dominant because buyers specify WFA through grade, chemistry, grain size, and friability before price negotiation. Abrasive Grade WFA remains the largest Level-2 sub-segment because bonded and coated abrasive manufacturers buy standard FEPA ranges in repeat volumes, while specialty producers use tailored powders to defend margin.
Technology
Technology is fastest growing because buyers are moving from bulk fused alumina toward controlled impurity, consistent shape, and finer classification. Low Sodium Processing is the fastest-growing Level-2 sub-segment because electronics, high-performance ceramics, and premium refractory customers need predictable sintering behavior, low contamination risk, and audited quality management.
CHAPTER 7 - Regional Analysis
Regional Analysis
Asia Pacific leads the global comparison because China supplies the largest artificial corundum export base and India remains a major demand market for abrasive and refractory consumption. Europe and North America remain smaller but specification-heavy markets, supported by established producers and customers requiring traceability.
Regional Ranking
Asia Pacific 1st
Asia Pacific Market Size
USD 505.2 Mn
Asia Pacific CAGR (2026-2031)
5.2%
Regional Ranking
Asia Pacific 1st
Asia Pacific Market Size
USD 505.2 Mn
Asia Pacific CAGR (2026-2031)
5.2%
Regional Analysis (Current Year)
Regional Analysis Comparison
| Metric | Asia Pacific | Europe | North America | Middle East and Africa | Latin America |
|---|---|---|---|---|---|
| Market Size | USD 505.2 Mn | USD 176.8 Mn | USD 109.5 Mn | USD 33.7 Mn | USD 16.8 Mn |
| CAGR (%) | 5.2% | 3.8% | 3.5% | 4.4% | 3.9% |
Market Position
Asia Pacific ranks first, with USD 505.2 Mn in 2025 value and China exporting USD 710.4 Mn of artificial corundum in 2024, reinforcing supply scale.
Growth Advantage
Asia Pacific is positioned as the growth leader at 5.2% CAGR, ahead of Europe at 3.8% and North America at 3.5%, due to abrasive and steel-linked demand.
Competitive Strengths
Regional strengths include alumina access, China export logistics, and Indian refractory consumption, with China shipping 918,913 tons under HS 281810 in 2024.
CHAPTER 8 - INDUSTRY ANALYSIS
Growth Drivers, Market Challenges & Market Opportunities
Comprehensive analysis of key factors shaping the White Fused Alumina Market, including growth catalysts, operational challenges, and emerging opportunities across production, distribution, and consumer segments.
Growth Drivers
Steel and Foundry Refractory Replacement
- High alumina refractories consume WFA where slag resistance and dimensional stability matter, and steel output at about 1.89 Bn tons (2024, worldsteel) gives refractory suppliers a recurring replacement pool.
- WFA competes through purity and thermal stability, while USGS notes nonmetallurgical alumina use includes abrasives, ceramics, chemicals, and refractories (2023, USGS), supporting diversified demand capture.
- Integrated refractory producers capture value through formulation and application support because WFA is specified into castables, precast shapes, and repair mixes where failure costs exceed mineral cost.
Precision Abrasive Demand in Metalworking
- Bonded abrasive manufacturers use WFA in wheels and stones where clean cutting reduces heat damage, giving grain producers repeat demand through specification-driven contracts.
- FEPA standards cover macrogrits F4 to F220 and microgrits F230 to F2000 (2006, FEPA reference), enabling global buyers to compare quality and price across suppliers.
- Standard bulk WFA prices at USD 600-1,000 per ton (2025, WFA Abrasives) create an accessible input cost for tool manufacturers while premium grits protect producer margin.
High Purity Ceramics and Electronics Pull
- Electronics and ceramic component producers require narrow particle distribution and impurity control, shifting procurement from spot bulk grits toward validated powders and long-term supplier qualification.
- CUMI identifies WFA use in coated abrasives, ceramic tiles, anti-skid paints, fluidized bed furnaces, and dental care (2025, CUMI), broadening end-market resilience.
- Low sodium grades command premium pricing because buyers pay for lower contamination risk, better sintering consistency, and fewer rejects in precision ceramic and surface finishing operations.
Market Challenges
Feedstock and Energy Cost Exposure
- Electric arc furnace economics are sensitive to power tariffs, so producers without captive or stable power contracts face margin compression when spot electricity rises.
- High purity calcined alumina availability affects both cost and chemistry, and USGS notes bauxite and alumina supply underpins abrasive, refractory, and chemical use.
- Buyers can switch between WFA, brown fused alumina, tabular alumina, and ceramic grains in certain applications, limiting full pass-through during cost spikes.
China-Centric Supply Concentration
- Import-dependent buyers in India, the United States, Japan, and Korea face freight, tariff, and payment-cycle exposure when Chinese supply tightens or logistics costs rise.
- Price discovery is vulnerable to Chinese export offers because standard abrasive grades are often benchmarked against Chinese bulk shipments, narrowing margins for smaller regional producers.
- Regional diversification requires qualified alternative suppliers, but qualification cycles for abrasive grains and ceramic powders can take months due to grain size and impurity validation.
Carbon and Compliance Burden
- Even where WFA is not always directly captured as a named product, aluminium and steel-linked customers increasingly require embedded emissions data across mineral inputs.
- Compliance requires traceability of energy sources, furnace operations, and shipment documentation, raising administrative cost for exporters targeting EU customers.
- Producers using coal-heavy electricity risk buyer discounting, while low-carbon power access can become a commercial differentiator for premium WFA tenders.
Market Opportunities
Low Sodium and Micro Powder Premiumization
- Revenue upside comes from micro powder toll processing, classification, and chemistry guarantees, allowing producers to sell quality assurance rather than only tonnage.
- Ceramic component producers and precision abrasive buyers benefit from fewer rejects, tighter surface finishes, and lower contamination risk in high specification applications.
- Producers must invest in air classification, magnetic separation, and laboratory testing to convert fused lump capacity into premium powder revenue.
Regional Warehousing and Qualified Import Substitution
- Distributors can monetize buffer inventory, small lots, and technical documentation for buyers that cannot carry container-scale stock from China.
- Abrasive tool plants and refractory producers benefit from shorter lead times and reduced working capital exposure when qualified stock is held regionally.
- Opportunity requires local laboratories, application support, and multi-grade inventory discipline so alternative supply is accepted without production downtime.
Low Carbon Supplier Positioning
- Producers with renewable power contracts or cleaner grid access can market WFA as a lower-risk input for EU-facing refractory and abrasive customers.
- Investors benefit from defensible margins where carbon documentation supports supplier qualification and reduces substitution risk in regulated export markets.
- What must change is measurement discipline, including furnace-level energy records, shipment-level traceability, and customer-facing environmental data packs.
CHAPTER 9 - Competitive Landscape
Competitive Landscape Overview
The market is moderately concentrated at the global producer level, with entry barriers in electric arc furnace capacity, power contracts, impurity control, and customer qualification.
Market Share Distribution
Top 5 Players
Market Dynamics
8 new entrants in the past 5 years, indicating strong market attractiveness and growth potential.
Company Name | Market Share | Headquarters | Founding Year | Core Market Focus |
|---|---|---|---|---|
Imerys | 11.5% | Paris, France | 1880 | Fused alumina for abrasives, refractories, and specialty minerals |
RUSAL | 8.8% | Moscow, Russia | 2000 | White fused alumina from Boksitogorsk alumina operations |
Alteo Fused Alumina | 7.6% | La Bathie, France | 2024 | White fused alumina and specialty fused alumina products |
Washington Mills | 6.9% | North Grafton, United States | 1868 | Fused minerals and abrasive grains |
MOTIM Electrocorundum | 4.8% | Mosonmagyarovar, Hungary | 1934 | White fused alumina and electrocorundum products |
Carborundum Universal Limited | 4.4% | Chennai, India | 1954 | Brown fused alumina, white fused alumina, silicon carbide, micro grits |
Elfusa Geral de Eletrofusao | 4.0% | Sao Joao da Boa Vista, Brazil | 1961 | Fused aluminium oxides for abrasive and refractory markets |
Zhengzhou YUFA Abrasives Group | 3.8% | Zhengzhou, China | 1987 | Alumina series products and corundum grades |
Henan Ruishi Renewable Resources Group | 3.2% | Luoyang, China | 1992 | Abrasive materials, refractory materials, and fused alumina grades |
Shandong Luxintai | 2.8% | Shandong, China | - | White fused alumina and abrasive raw materials |
Cross Comparison Parameters
The report provides detailed cross-comparison of key players across 10 performance parameters to identify competitive strengths and weaknesses.
Electric Arc Furnace Capacity
Low Sodium Grade Capability
Sector-Specific Revenue Growth
EBITDA Margin
Analysis Covered
Market Share Analysis:
Assesses producer concentration by grade, region, and customer qualification.
Cross Comparison Matrix:
Benchmarks capacity, purity control, channel reach, and margins.
SWOT Analysis:
Maps supplier strengths, weaknesses, threats, and defensible opportunities.
Pricing Strategy Analysis:
Compares bulk grit, micro powder, and specialty grade pricing.
Company Profiles:
Summarizes verified producer focus, footprint, and competitive positioning.
CHAPTER 10 - REPORT TOC
CHAPTER 14 - Table Of Contents
Phase 1Market Assessment Phase
11
Chapters
Supply-side and competitive intelligence covering market sizing, segmentation, competitive dynamics, regulatory landscape, and future forecasts.
Phase 2Go-To-Market Strategy Phase
15
Chapters
Entry strategy evaluation, execution roadmap, partner recommendations, and profitability outlook.
Complete Report Coverage
201+ detailed sections covering every aspect of the market
143
Assessment Sections
58
Strategy Sections
CHAPTER 11 - Our Approach
Research Methodology
Desk Research
- Artificial corundum trade flow mapping
- Producer capacity and grade review
- Alumina feedstock price benchmarking
- Refractory and abrasive demand screening
Primary Research
- Procurement heads at abrasive producers
- Refractory plant technical managers interviewed
- Fused alumina distributors consulted globally
- Ceramic powder buyers validated specifications
Validation and Triangulation
- 196 respondents across value chain
- ASP triangulated against shipment data
- Volume checked against furnace capacity
- Forecast reviewed by end-users
CHAPTER 12 - FAQ
FAQs
Still have questions?
Our research team is here to help you find the right solution
CHAPTER 13 - Related Research
Explore Related Reports
Expand your market intelligence with complementary research across regions and adjacent markets.
Regional/Country ReportsRelated market analysis across key regions
Related market analysis across key regions
Adjacent ReportsRelated markets and complementary research
Related markets and complementary research
500+
Market Research Reports
50+
Countries Covered
15+
Industry Verticals