About the Report
Base Year 2024Philippines Lithium Ion Battery Recycling Market Overview
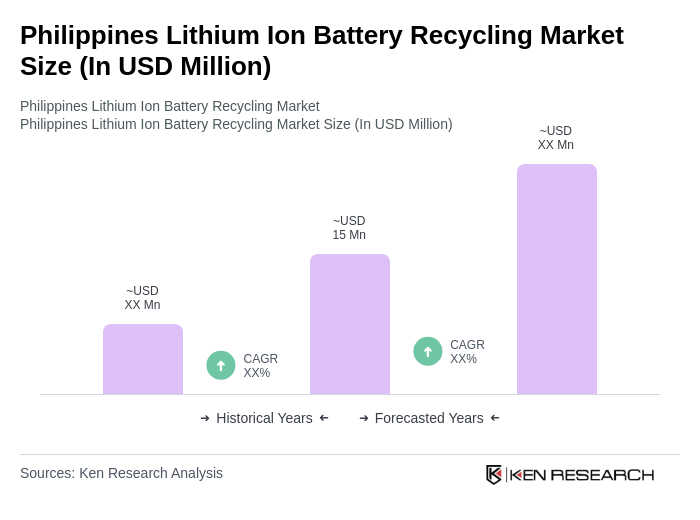
- The Philippines Lithium Ion Battery Recycling Market is valued at USD 15 million, based on a five-year historical analysis. This growth is primarily driven by the rising adoption of electric vehicles and consumer electronics, as well as heightened environmental concerns regarding battery waste management. The need for sustainable recycling solutions has accelerated investments and innovations in advanced recycling technologies, such as hydrometallurgical processes, which are gaining traction for their efficiency and resource recovery capabilities .
- Key cities including Manila, Cebu, and Davao continue to lead the market due to their robust industrial activities and rapid urbanization. Manila, as the capital, remains a hub for technological innovation and policy implementation, while Cebu and Davao are strengthening their roles as manufacturing and logistics centers, further supporting the expansion of the battery recycling sector .
- In 2023, the Philippine government enacted Republic Act No. 11898, known as the Extended Producer Responsibility (EPR) Act of 2022, issued by the Congress of the Philippines. This legislation mandates manufacturers and importers to manage the full lifecycle of their products, including end-of-life collection and recycling. The EPR Act requires compliance reporting, recovery targets, and the establishment of take-back systems, thereby reinforcing circular economy practices and advancing lithium-ion battery recycling nationwide .
Philippines Lithium Ion Battery Recycling Market Segmentation
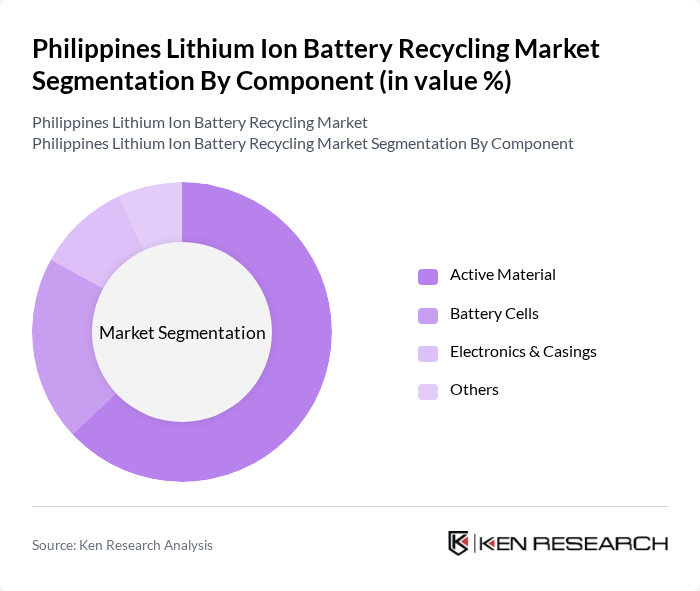
By Component:The components of lithium-ion batteries are central to the recycling process. The primary subsegments include Active Material, Battery Cells, Electronics & Casings, and Others. Among these, Active Material currently holds the largest market share, driven by its high value in resource recovery, while Battery Cells remain a critical focus due to their volume in discarded batteries and the demand for efficient extraction of lithium, cobalt, and nickel. The surge in electric vehicle adoption and consumer electronics is intensifying the need for advanced recycling of both active materials and battery cells .
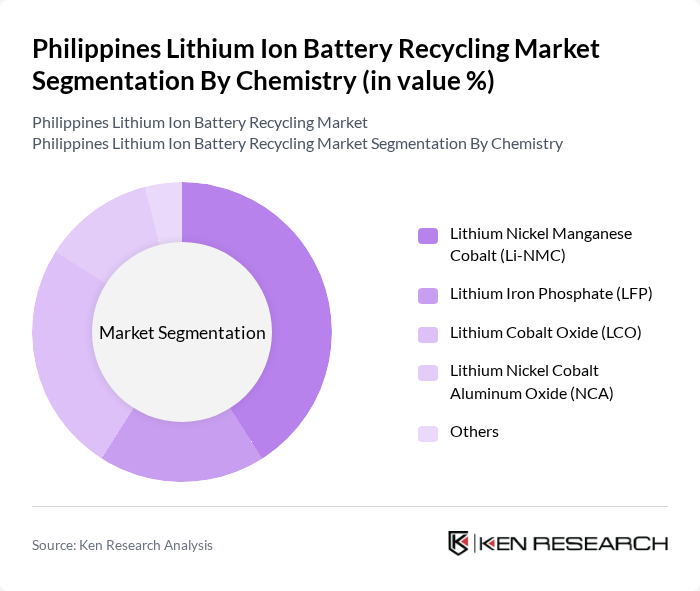
By Chemistry:The chemistry of lithium-ion batteries significantly affects recycling strategies. The main subsegments include Lithium Nickel Manganese Cobalt (Li-NMC), Lithium Iron Phosphate (LFP), Lithium Cobalt Oxide (LCO), Lithium Nickel Cobalt Aluminum Oxide (NCA), and Others. Li-NMC is the leading segment, reflecting its dominance in electric vehicles and portable electronics, which are increasingly recycled for valuable metals. The growing focus on sustainability and resource recovery is driving innovation in Li-NMC recycling technologies, while LFP and LCO chemistries are also gaining attention due to their expanding applications .
Philippines Lithium Ion Battery Recycling Market Competitive Landscape
The Philippines Lithium Ion Battery Recycling Market is characterized by a dynamic mix of regional and international players. Leading participants such as Envirocycle Inc., Oriental & Motolite Marketing Corporation (OMMC), Green Li-ion Pte Ltd., TES-AMM Philippines Inc., Globe Telecom (Battery Recycling Initiative), Philippine Recyclers Inc. (PRI), Integrated Recycling Industries Philippines Inc., Li-Cycle Corp., Umicore S.A., Retriev Technologies, Inc., Duesenfeld GmbH, Accurec Recycling GmbH, Green Lithium, Neometals Ltd., Battery Solutions, Inc. contribute to innovation, geographic expansion, and service delivery in this space.
Philippines Lithium Ion Battery Recycling Market Industry Analysis
Growth Drivers
- Increasing Demand for Electric Vehicles:The Philippines is witnessing a surge in electric vehicle (EV) adoption, with sales projected to reach 50,000 units in future, up from 20,000 previously. This growth is driven by government incentives and a growing consumer preference for sustainable transportation. As EVs rely heavily on lithium-ion batteries, the demand for effective recycling solutions is critical to manage the increasing battery waste and recover valuable materials, thus supporting the recycling market.
- Government Initiatives for Sustainable Waste Management:The Philippine government has implemented various policies aimed at enhancing waste management practices, including the Ecological Solid Waste Management Act. In future, the government allocated approximately PHP 1.5 billion for waste management initiatives, which includes funding for battery recycling programs. These initiatives are designed to promote environmentally responsible disposal and recycling, thereby driving the growth of the lithium-ion battery recycling market.
- Rising Awareness of Environmental Impacts:Public awareness regarding the environmental impacts of battery waste is increasing, with over 70% of Filipinos expressing concern about pollution from discarded batteries. This heightened awareness is leading to greater demand for recycling solutions, as consumers and businesses seek to minimize their ecological footprint. The push for sustainable practices is expected to drive investments in recycling technologies and infrastructure, further bolstering the market.
Market Challenges
- High Initial Investment Costs:Establishing lithium-ion battery recycling facilities requires significant capital investment, often exceeding PHP 100 million for advanced processing plants. This high cost can deter potential investors and limit the number of operational facilities in the Philippines. Additionally, the return on investment may take several years, making it a challenging proposition for new entrants in the recycling market.
- Lack of Consumer Awareness:Despite growing environmental concerns, consumer awareness regarding battery recycling remains low, with only 30% of the population knowledgeable about proper disposal methods. This lack of awareness can lead to improper disposal practices, which ultimately hampers the effectiveness of recycling initiatives. Educational campaigns are essential to inform consumers about the importance of recycling and the available options, which is currently a significant challenge for the market.
Philippines Lithium Ion Battery Recycling Market Future Outlook
The future of the lithium-ion battery recycling market in the Philippines appears promising, driven by increasing EV adoption and supportive government policies. As the country moves towards a circular economy, investments in recycling technologies are expected to rise, enhancing efficiency and material recovery rates. Furthermore, collaboration between stakeholders, including manufacturers and recyclers, will be crucial in developing sustainable practices. The market is likely to evolve with innovative solutions that address both environmental concerns and economic viability, fostering a robust recycling ecosystem.
Market Opportunities
- Expansion of Battery Recycling Facilities:There is a significant opportunity for establishing new recycling facilities across the Philippines, particularly in urban areas. With the government’s support and funding, the establishment of at least five new facilities in future could enhance local recycling capabilities and create jobs, while also reducing the environmental impact of battery waste.
- Partnerships with Automotive Manufacturers:Collaborating with automotive manufacturers presents a lucrative opportunity for recycling companies. By forming partnerships, recyclers can secure a steady supply of used batteries for processing. Such collaborations can also lead to shared investments in recycling technologies, ultimately benefiting both parties and promoting sustainable practices within the automotive industry.
Scope of the Report
| Segment | Sub-Segments |
|---|---|
| By Component | Active Material Battery Cells Electronics & Casings Others |
| By Chemistry | Lithium Nickel Manganese Cobalt (Li-NMC) Lithium Iron Phosphate (LFP) Lithium Cobalt Oxide (LCO) Lithium Nickel Cobalt Aluminum Oxide (NCA) Others |
| By Recycling Process | Hydrometallurgical Pyrometallurgical Direct Recycling |
| By End-User | Automotive Consumer Electronics Industrial Applications Energy Storage Systems |
Key Target Audience
Investors and Venture Capitalist Firms
Government and Regulatory Bodies (e.g., Department of Environment and Natural Resources, Department of Energy)
Battery Manufacturers
Recycling Facility Operators
Automotive Manufacturers
Electronics Manufacturers
Waste Management Companies
Industry Associations (e.g., Philippine Chamber of Commerce and Industry)
Players Mentioned in the Report:
Envirocycle Inc.
Oriental & Motolite Marketing Corporation (OMMC)
Green Li-ion Pte Ltd.
TES-AMM Philippines Inc.
Globe Telecom (Battery Recycling Initiative)
Philippine Recyclers Inc. (PRI)
Integrated Recycling Industries Philippines Inc.
Li-Cycle Corp.
Umicore S.A.
Retriev Technologies, Inc.
Duesenfeld GmbH
Accurec Recycling GmbH
Green Lithium
Neometals Ltd.
Battery Solutions, Inc.
Table of Contents
Market Assessment Phase
1. Executive Summary and Approach
2. Philippines Lithium Ion Battery Recycling Market Overview
2.1 Key Insights and Strategic Recommendations
2.2 Philippines Lithium Ion Battery Recycling Market Overview
2.3 Definition and Scope
2.4 Evolution of Market Ecosystem
2.5 Timeline of Key Regulatory Milestones
2.6 Value Chain & Stakeholder Mapping
2.7 Business Cycle Analysis
2.8 Policy & Incentive Landscape
3. Philippines Lithium Ion Battery Recycling Market Analysis
3.1 Growth Drivers
3.1.1 Increasing demand for electric vehicles
3.1.2 Government initiatives for sustainable waste management
3.1.3 Rising awareness of environmental impacts
3.1.4 Technological advancements in recycling processes
3.2 Market Challenges
3.2.1 High initial investment costs
3.2.2 Lack of consumer awareness
3.2.3 Regulatory compliance complexities
3.2.4 Limited recycling infrastructure
3.3 Market Opportunities
3.3.1 Expansion of battery recycling facilities
3.3.2 Partnerships with automotive manufacturers
3.3.3 Development of innovative recycling technologies
3.3.4 Export opportunities for recycled materials
3.4 Market Trends
3.4.1 Shift towards circular economy practices
3.4.2 Increased investment in green technologies
3.4.3 Growth of second-life applications for batteries
3.4.4 Enhanced regulatory frameworks promoting recycling
3.5 Government Regulation
3.5.1 Extended Producer Responsibility (EPR) policies
3.5.2 Environmental Compliance Certificate (ECC) requirements
3.5.3 Import regulations for used batteries
3.5.4 Incentives for recycling investments
4. SWOT Analysis
5. Stakeholder Analysis
6. Porter's Five Forces Analysis
7. Philippines Lithium Ion Battery Recycling Market Market Size, 2019-2024
7.1 By Value
7.2 By Volume
7.3 By Average Selling Price
8. Philippines Lithium Ion Battery Recycling Market Segmentation
8.1 By Component
8.1.1 Active Material
8.1.2 Battery Cells
8.1.3 Electronics & Casings
8.1.4 Others
8.2 By Chemistry
8.2.1 Lithium Nickel Manganese Cobalt (Li-NMC)
8.2.2 Lithium Iron Phosphate (LFP)
8.2.3 Lithium Cobalt Oxide (LCO)
8.2.4 Lithium Nickel Cobalt Aluminum Oxide (NCA)
8.2.5 Others
8.3 By Recycling Process
8.3.1 Hydrometallurgical
8.3.2 Pyrometallurgical
8.3.3 Direct Recycling
8.4 By End-User
8.4.1 Automotive
8.4.2 Consumer Electronics
8.4.3 Industrial Applications
8.4.4 Energy Storage Systems
9. Philippines Lithium Ion Battery Recycling Market Competitive Analysis
9.1 Market Share of Key Players
9.2 Cross Comparison of Key Players
9.2.1 Company Name
9.2.2 Group Size (Large, Medium, or Small as per industry convention)
9.2.3 Revenue Growth Rate
9.2.4 Market Share in Philippines
9.2.5 Volume of Batteries Recycled (tons/year)
9.2.6 Recovery Rate of Valuable Materials (%)
9.2.7 Operational Efficiency (Cost per ton recycled)
9.2.8 Compliance with Local Environmental Regulations
9.2.9 Sustainability Index (ESG Score)
9.2.10 Investment in R&D (as % of revenue)
9.3 SWOT Analysis of Top Players
9.4 Pricing Analysis
9.5 Detailed Profile of Major Companies
9.5.1 Envirocycle Inc.
9.5.2 Oriental & Motolite Marketing Corporation (OMMC)
9.5.3 Green Li-ion Pte Ltd.
9.5.4 TES-AMM Philippines Inc.
9.5.5 Globe Telecom (Battery Recycling Initiative)
9.5.6 Philippine Recyclers Inc. (PRI)
9.5.7 Integrated Recycling Industries Philippines Inc.
9.5.8 Li-Cycle Corp.
9.5.9 Umicore S.A.
9.5.10 Retriev Technologies, Inc.
9.5.11 Duesenfeld GmbH
9.5.12 Accurec Recycling GmbH
9.5.13 Green Lithium
9.5.14 Neometals Ltd.
9.5.15 Battery Solutions, Inc.
10. Philippines Lithium Ion Battery Recycling Market End-User Analysis
10.1 Procurement Behavior of Key Ministries
10.1.1 Department of Environment and Natural Resources
10.1.2 Department of Energy
10.1.3 Department of Trade and Industry
10.2 Corporate Spend on Infrastructure & Energy
10.2.1 Investment in Recycling Facilities
10.2.2 Budget Allocation for Sustainability Initiatives
10.3 Pain Point Analysis by End-User Category
10.3.1 Cost of Recycling Services
10.3.2 Availability of Recycling Options
10.3.3 Compliance with Regulations
10.4 User Readiness for Adoption
10.4.1 Awareness of Recycling Benefits
10.4.2 Accessibility of Recycling Programs
10.5 Post-Deployment ROI and Use Case Expansion
10.5.1 Financial Returns from Recycled Materials
10.5.2 Expansion into New Markets
11. Philippines Lithium Ion Battery Recycling Market Future Size, 2025-2030
11.1 By Value
11.2 By Volume
11.3 By Average Selling Price
Go-To-Market Strategy Phase
1. Whitespace Analysis + Business Model Canvas
1.1 Market Gaps Identification
1.2 Business Model Development
2. Marketing and Positioning Recommendations
2.1 Branding Strategies
2.2 Product USPs
3. Distribution Plan
3.1 Urban Retail Strategies
3.2 Rural NGO Tie-ups
4. Channel & Pricing Gaps
4.1 Underserved Routes
4.2 Pricing Bands Analysis
5. Unmet Demand & Latent Needs
5.1 Category Gaps
5.2 Consumer Segments
6. Customer Relationship
6.1 Loyalty Programs
6.2 After-sales Service
7. Value Proposition
7.1 Sustainability Initiatives
7.2 Integrated Supply Chains
8. Key Activities
8.1 Regulatory Compliance
8.2 Branding Efforts
8.3 Distribution Setup
9. Entry Strategy Evaluation
9.1 Domestic Market Entry Strategy
9.1.1 Product Mix Considerations
9.1.2 Pricing Band Strategy
9.1.3 Packaging Solutions
9.2 Export Entry Strategy
9.2.1 Target Countries Identification
9.2.2 Compliance Roadmap Development
10. Entry Mode Assessment
10.1 Joint Ventures
10.2 Greenfield Investments
10.3 Mergers & Acquisitions
10.4 Distributor Model Evaluation
11. Capital and Timeline Estimation
11.1 Capital Requirements
11.2 Timelines for Implementation
12. Control vs Risk Trade-Off
12.1 Ownership Considerations
12.2 Partnerships Evaluation
13. Profitability Outlook
13.1 Breakeven Analysis
13.2 Long-term Sustainability Strategies
14. Potential Partner List
14.1 Distributors
14.2 Joint Ventures
14.3 Acquisition Targets
15. Execution Roadmap
15.1 Phased Plan for Market Entry
15.1.1 Market Setup
15.1.2 Market Entry
15.1.3 Growth Acceleration
15.1.4 Scale & Stabilize
15.2 Key Activities and Milestones
15.2.1 Milestone Planning
Research Methodology
Phase 1: Approach1
Desk Research
- Analysis of industry reports from government agencies and environmental organizations
- Review of academic publications on lithium-ion battery recycling technologies and processes
- Examination of market trends and forecasts from trade associations and industry journals
Primary Research
- Interviews with key stakeholders in the battery manufacturing and recycling sectors
- Surveys targeting waste management companies and recycling facilities
- Field visits to operational recycling plants to gather firsthand insights
Validation & Triangulation
- Cross-validation of data from multiple sources including industry reports and expert interviews
- Triangulation of findings through comparison of recycling rates and market demand data
- Sanity checks conducted with a panel of industry experts to ensure data accuracy
Phase 2: Market Size Estimation1
Top-down Assessment
- Estimation of total lithium-ion battery usage in the Philippines based on import/export data
- Segmentation of the market by battery type, application, and end-of-life management
- Incorporation of government policies promoting recycling and sustainability initiatives
Bottom-up Modeling
- Collection of operational data from leading recycling facilities to establish processing capacities
- Cost analysis based on the average price of recycling services and materials recovery
- Volume estimates derived from historical recycling rates and projected growth in battery usage
Forecasting & Scenario Analysis
- Development of predictive models using historical data and market growth indicators
- Scenario planning based on potential regulatory changes and technological advancements
- Creation of multiple forecasts (baseline, optimistic, and pessimistic) through 2030
Phase 3: CATI Sample Composition1
| Scope Item/Segment | Sample Size | Target Respondent Profiles |
|---|---|---|
| Battery Manufacturers | 100 | Production Managers, Quality Assurance Officers |
| Recycling Facilities | 80 | Operations Managers, Environmental Compliance Officers |
| Government Regulatory Bodies | 50 | Policy Makers, Environmental Analysts |
| Research Institutions | 40 | Research Scientists, Industry Analysts |
| Consumer Electronics Companies | 60 | Product Managers, Sustainability Coordinators |
Frequently Asked Questions
What is the current value of the Philippines Lithium Ion Battery Recycling Market?
The Philippines Lithium Ion Battery Recycling Market is valued at approximately USD 15 million, reflecting a growing demand driven by the rise in electric vehicles and consumer electronics, alongside increasing environmental concerns regarding battery waste management.
What factors are driving the growth of lithium-ion battery recycling in the Philippines?
Which cities are leading the lithium-ion battery recycling market in the Philippines?
What is the Extended Producer Responsibility (EPR) Act of 2022?
Other Regional/Country Reports
Indonesia Lithium Ion Battery Recycling Market
Malaysia Lithium Ion Battery Recycling Market
KSA Lithium Ion Battery Recycling Market
APAC Lithium Ion Battery Recycling Market
SEA Lithium Ion Battery Recycling Market
Vietnam Lithium Ion Battery Recycling Market
Other Adjacent Reports
Egypt Lithium Ion Battery Manufacturing Market
Germany Electric Vehicle Battery Market
Thailand Consumer Electronics Battery Market
Philippines Battery Material Recovery Market
UAE Metal Recycling Market
South Korea E-Waste Management Market
Malaysia Renewable Energy Storage Market
South Africa Automotive Recycling Market
Belgium Sustainable Waste Processing Market
Japan Circular Economy Services Market
Why Buy From Us?

What makes us stand out is that our consultants follow Robust, Refine and Result (RRR) methodology. Robust for clear definitions, approaches and sanity checking, Refine for differentiating respondents' facts and opinions, and Result for presenting data with story.

We have set a benchmark in the industry by offering our clients with syndicated and customized market research reports featuring coverage of entire market as well as meticulous research and analyst insights.

While we don't replace traditional research, we flip the method upside down. Our dual approach of Top Bottom & Bottom Top ensures quality deliverable by not just verifying company fundamentals but also looking at the sector and macroeconomic factors.

With one step in the future, our research team constantly tries to show you the bigger picture. We help with some of the tough questions you may encounter along the way: How is the industry positioned? Best marketing channel? KPI's of competitors? By aligning every element, we help maximize success.

Our report gives you instant access to the answers and sources that other companies might choose to hide. We elaborate each steps of research methodology we have used and showcase you the sample size to earn your trust.

If you need any support, we are here! We pride ourselves on universe strength, data quality, and quick, friendly, and professional service.