








Vietnam
May 2026

Vietnam Tea Market Outlook to 2030

2030

Vietnam Tea Market is projected to reach $1,446 Mn by 2030, growing at 8.3% CAGR, driven by RTD tea, organic growth, and premiumization trends.

Report Details

Base Year

2024

Pages

80

Region

Asia

Author

Piyush

Product Code
KR-RPT-V2-AA-001134
CHAPTER 1 - MARKET SUMMARY

Market Overview

The Vietnam Tea Market operates through a dual engine, habitual domestic consumption and processor-led commercialization into packaged, RTD, and specialty formats. Demand depth is anchored by a population of 101.1 million people in 2024 and domestic tea use of about 1.4 kg per capita , which sustains high everyday offtake and gives producers a recurring base beyond export cycles.

Northern Vietnam remains the economic center of the Vietnam Tea Market because it concentrates cultivation, primary processing, and reputation-led premium supply. Thai Nguyen alone had 22,500 hectares of tea area in 2023 , produced 267,500 tonnes of fresh tea buds , and had built 6,500 hectares of concentrated safe-production and linked processing zones, making it the country’s most important quality and sourcing hub.

Market Value

USD 895 million

2024

Dominant Region

Northern Vietnam

2024

Dominant Segment

Ready-to-Drink

RTD

Total Number of Players

10

Future Outlook

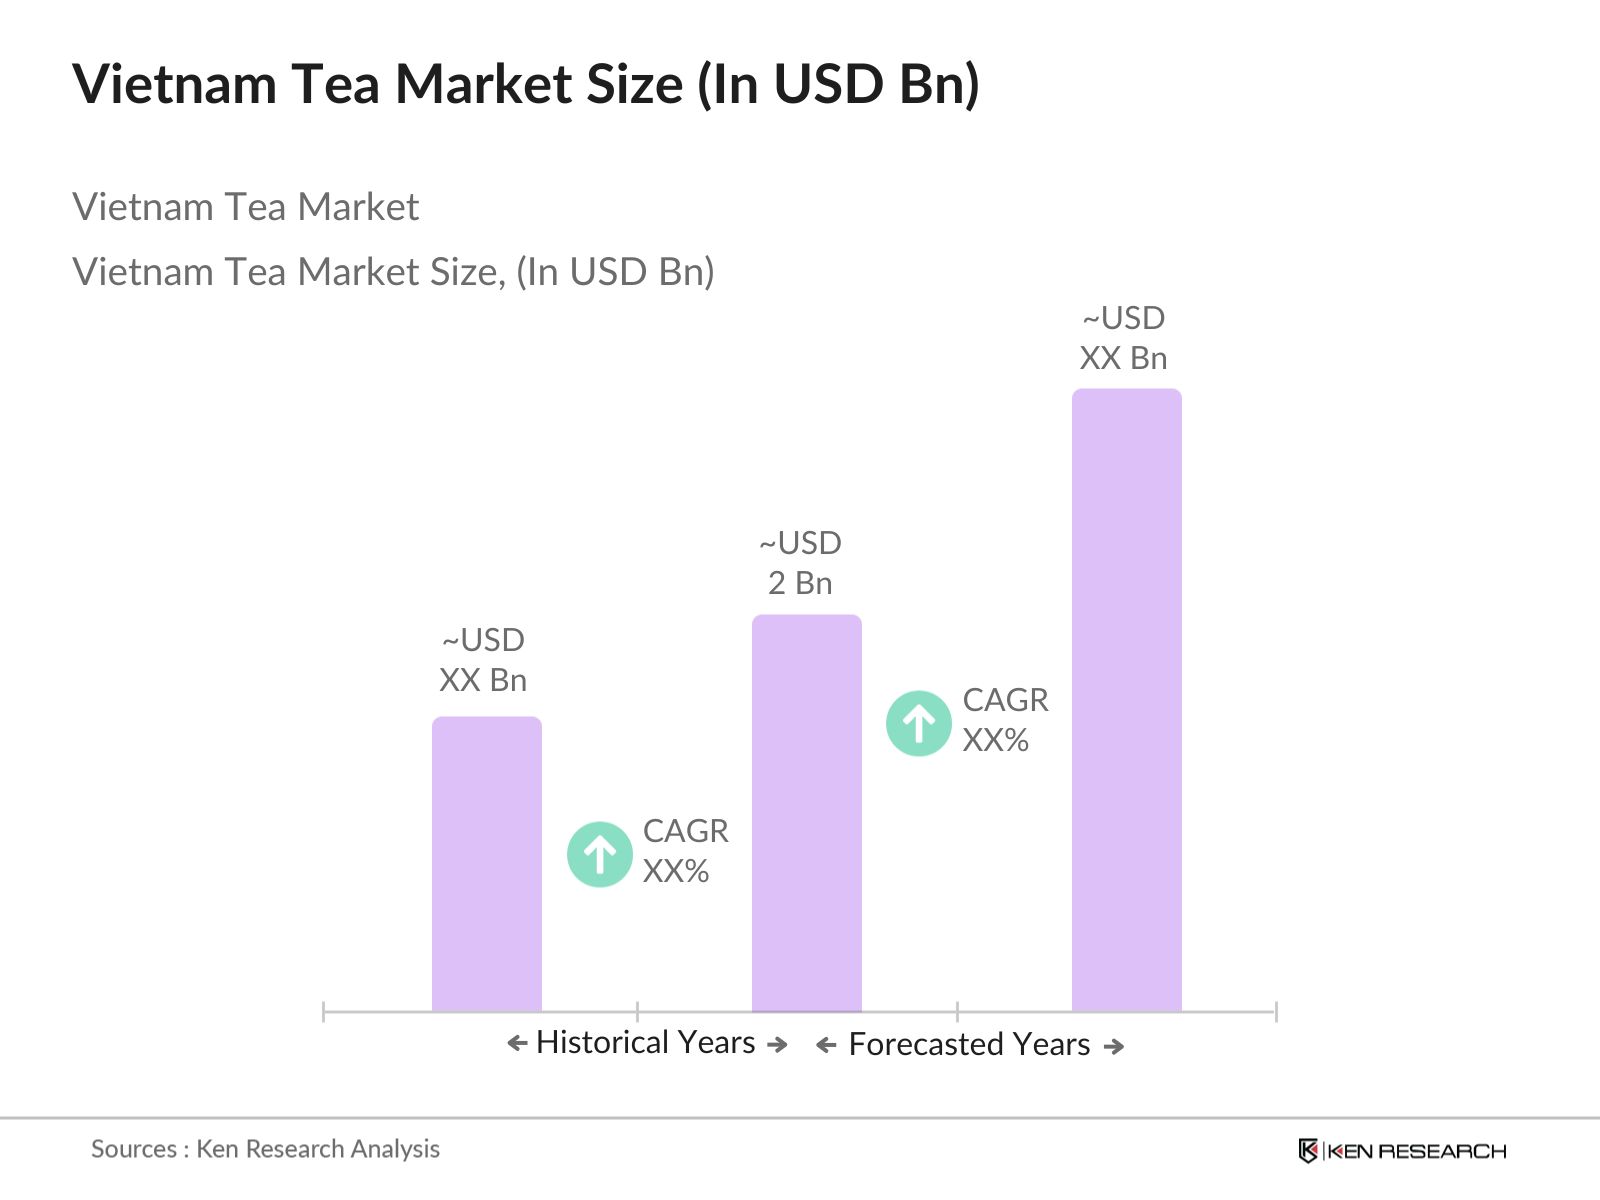
The Vietnam Tea Market is projected to advance from USD 895 Mn in 2024 to USD 1,446 Mn by 2030 . Historical expansion between 2019 and 2024 implies a 6.9% CAGR , with recovery led first by reopening of modern retail and foodservice, then by stronger export execution and wider commercialization of RTD tea. The next phase should be more value-accretive than the last because premiumization is no longer limited to export tea. Specialty, organic, and origin-linked products are moving into domestic retail, while RTD formats continue to absorb branded marketing spend, shelf space, and convenience-led consumption occasions across urban centers.

Forecast growth for 2025-2030 is modeled at 8.3% CAGR , above the historical rate, because the product mix is improving faster than cultivation growth. Market volume is expected to move from 415,000 tonnes in 2024 to about 557,000 tonnes in 2030 , while realized revenue per tonne continues to rise as RTD tea, specialty teas, and better packaged formats gain share. Strategically, this shifts capital allocation away from undifferentiated bulk tea and toward processing, packaging, traceability, and premium route-to-market execution. Companies with stronger control of branded channels and certified sourcing should capture a disproportionate share of industry profit pools through 2030.

8.3%

Forecast CAGR

$1,446 Mn

2030 Projection

Base Year

2024

Historical Period

2019-2024

Forecast Period

2025-2030

Historical CAGR

6.9%

CHAPTER 2 - SCOPE OF REPORT

Scope of the Market

Click to Explore Interactive Mind Map
CHAPTER 3 - Key Stakeholders

Key Target Audience

Key stakeholders who can leverage from this market analysis for investment, strategy, and operational planning.

Investors

CAGR, premiumization, export risk, cash conversion, capex intensity

Corporates

sourcing cost, channel mix, packaging, pricing, brand scale

Government

traceability, GI protection, export diversification, rural income, compliance

Operators

leaf yield, processing uptime, QA, route-to-market, wastage

Financial institutions

project finance, working capital, offtake visibility, covenant strength

What You'll Gain

  • Market sizing and trajectory
  • Policy and compliance mapping
  • Trade exposure indicators
  • Segment structure and levers
  • Competitive landscape shortlist
  • CEO-grade risk priorities

80+

Pages of insights

CHAPTER 4 - Market Size & Growth

Market Size, Growth Forecast and Trends

This section evaluates the historical market size, analyzes year-over-year growth dynamics, and presents forecast projections supported by market performance indicators and demand-side drivers.

Historical & Projected Market Size ($ Million)

Historical (2019-2024)
Projected (2025-2030)

Year-over-Year Growth Rate (%)

Market Value vs Volume Growth (%)

Historical Market Performance (2019-2024)

The Vietnam Tea Market moved through a clear trough and recovery cycle during 2019-2024. Market value fell to USD 618 Mn in 2020 before rebounding to USD 895 Mn in 2024 , implying a 6.9% historical CAGR across the five-year window. Profit pools also became more concentrated in convenience-oriented formats, with RTD tea accounting for 46.9% of 2024 revenue . The strongest historical inflection came in 2021-2022, when value growth remained above volume growth, indicating that mix improvement, not only tonnage recovery, was rebuilding market economics after the pandemic shock.

Forecast Market Outlook (2025-2030)

The forecast period shows a structurally stronger market than the historical base. The Vietnam Tea Market is projected to reach USD 1,446 Mn by 2030 , with value growth sustained by faster monetization of specialty and branded formats. The most important mix lever is the 11.5% CAGR expected for specialty, organic, and oolong tea, while realized market revenue per tonne rises from about USD 2,157 per tonne in 2024 to about USD 2,596 per tonne in 2030 . That gap between value growth and volume growth indicates a market becoming more packaging-intensive, quality-sensitive, and pricing-resilient.

CHAPTER 5 - Market Data

Market Breakdown

The Vietnam Tea Market is shifting from a cultivation-led industry to a multi-format beverage and branded processing market. For CEOs and investors, the relevant issue is not only tonnage growth, but where value accrues across export, RTD, premium packaged tea, and specialty channels.

Market Breakdown

Historical Data (2019-2023) • Base Data (2024) • Forecast Data (2025-2030)

Year
Market Size (USD Mn)
YoY Growth (%)
Market Volume (000 tonnes)
Export FOB Value (USD Mn)
Average Revenue per Tonne (USD/t)
Period
2019$640 Mn+-340237
$#%
Forecast
2020$618 Mn+-3.4%332218
$#%
Forecast
2021$688 Mn+11.3%356214
$#%
Forecast
2022$761 Mn+10.6%378215
$#%
Forecast
2023$826 Mn+8.5%396211
$#%
Forecast
2024$895 Mn+8.4%415256
$#%
Forecast
2025$970 Mn+8.4%436267
$#%
Forecast
2026$1,050 Mn+8.2%458278
$#%
Forecast
2027$1,138 Mn+8.4%481290
$#%
Forecast
2028$1,232 Mn+8.3%505302
$#%
Forecast
2029$1,335 Mn+8.4%530315
$#%
Forecast
2030$1,446 Mn+8.3%557329
$#%
Forecast

Market Volume

415,000 tonnes, 2024, Vietnam . Processing economics increasingly depend on handling, blending, and packaging efficiency rather than raw-leaf expansion alone. The operating implication is that investment returns will favor plants with higher throughput flexibility and yield control. Supporting stat: Vietnam’s tea area reached 128,000 hectares with 230,000 tonnes of dried tea output in 2024. Source: Vietnam Tea Association, 2024.

Export FOB Value

USD 256.4 Mn, 2024, Vietnam . Export remains a strategic cash-flow channel, but low realized unit value keeps bulk tea margins exposed. Companies able to move from commodity shipments into traceable, branded, or specialty exports should outperform on earnings quality. Supporting stat: Vietnam exported 146,107 tonnes in 2024, implying an average export value of about USD 1,755 per tonne. Source: General Department of Customs, 2024.

Average Revenue per Tonne

USD 2,157/t, 2024, Vietnam Tea Market . This KPI captures the shift toward better monetized formats, especially RTD and premium packaged tea. Revenue intensity should keep rising as specialty and branded channels expand faster than raw volume. Supporting stat: Specialty, Organic & Oolong Tea is the fastest-growing segment with an 11.5% CAGR over the forecast period. Source: Market model, 2024-2029.

CHAPTER 6 - Segmentation

Market Segmentation Framework

Comprehensive analysis across key market segmentation dimensions providing insights into market structure, revenue pools, buyer behavior, and distribution patterns.

No of Segments

5

Dominant Segment

By Tea Type

Fastest Growing Segment

By Distribution Channel

By Tea Type

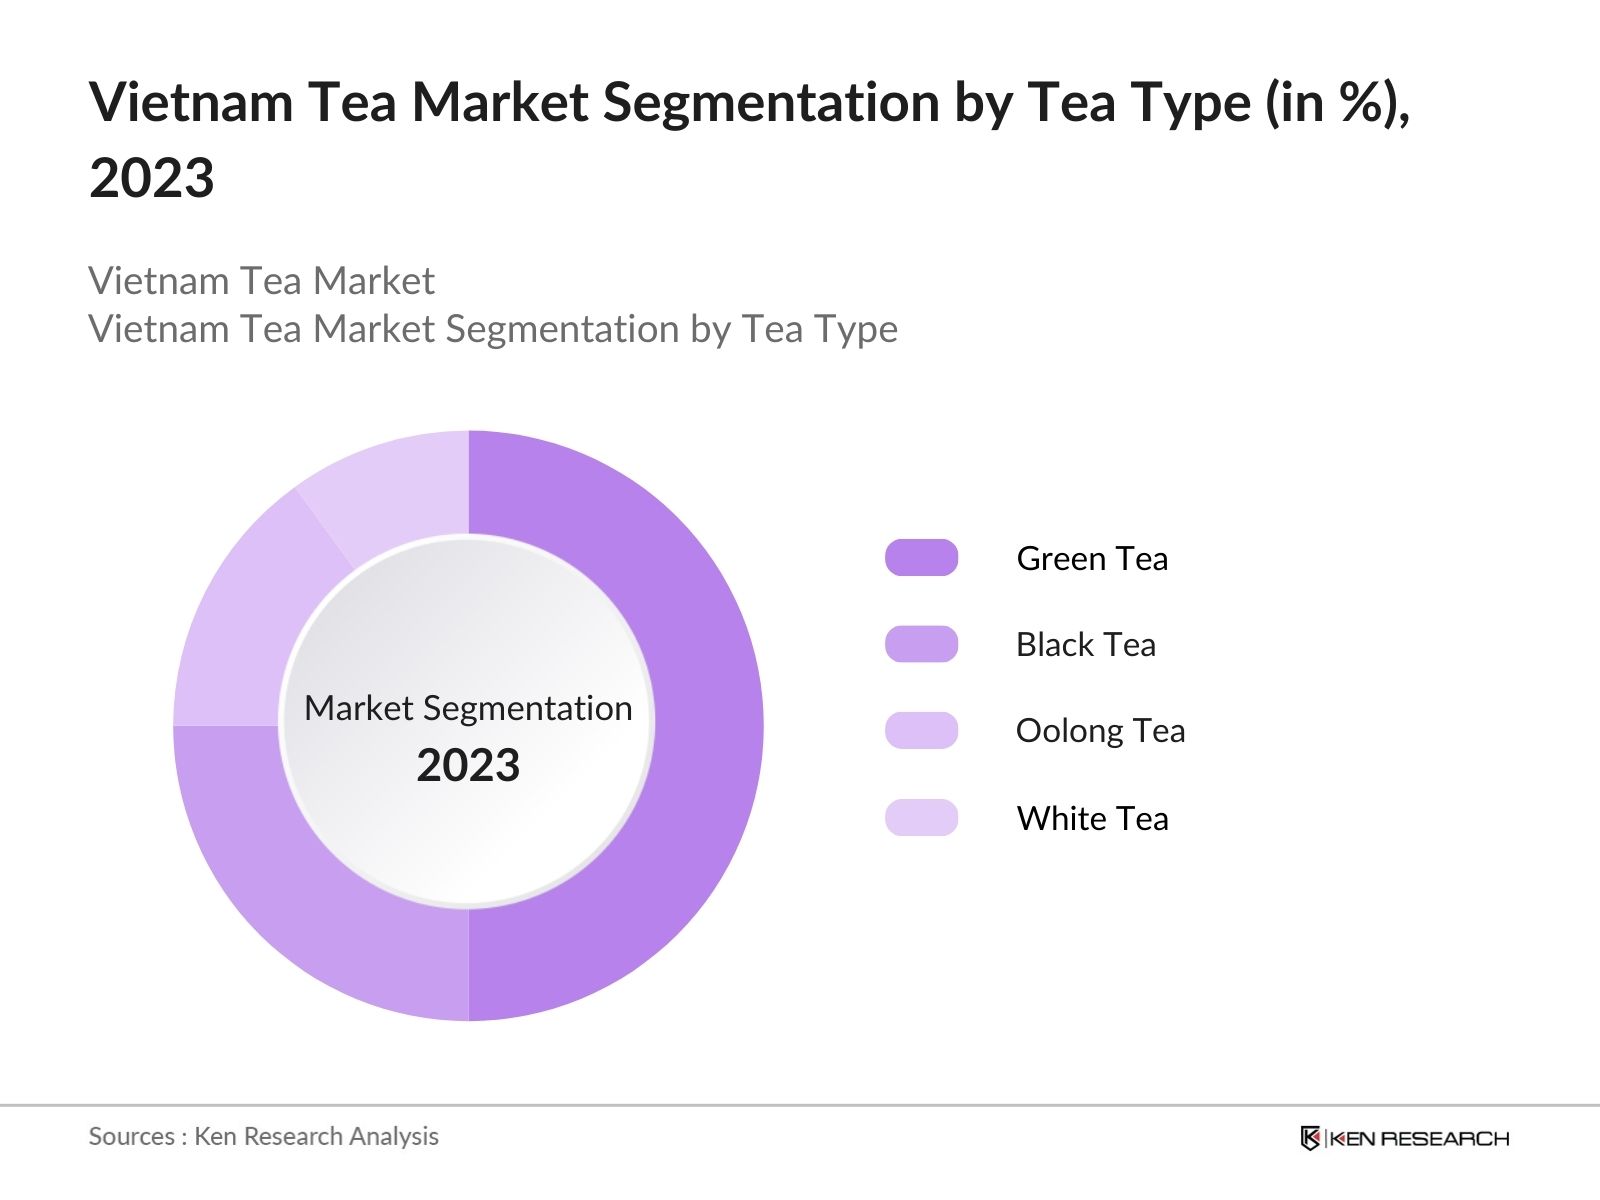
Classifies the Vietnam Tea Market by product form and consumption proposition, with Green Tea commercially dominant in domestic and gifting demand.

Green Tea
$&%
Black Tea
$&%
Oolong Tea
$&%
White Tea
$&%
Herbal/Flavored Tea
$&%

By Distribution Channel

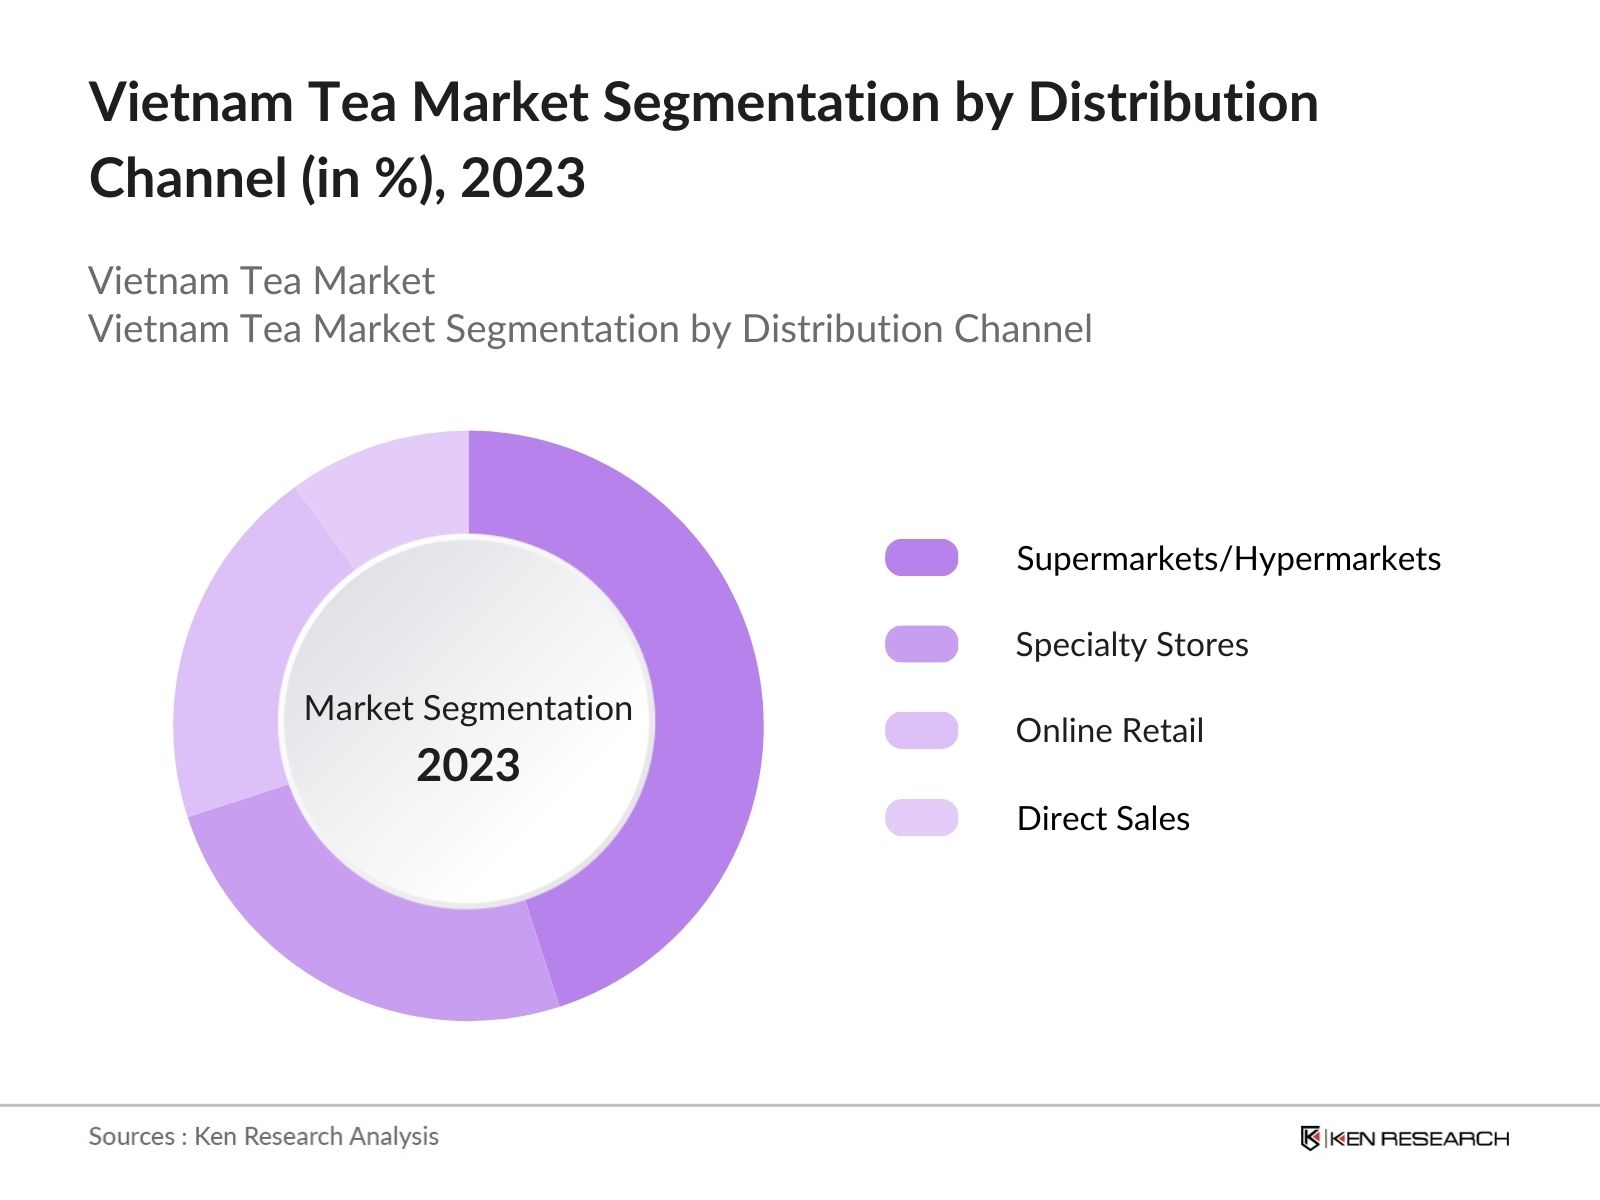
Maps how tea is sold to end buyers, with Supermarkets/Hypermarkets leading branded packaged tea and RTD shelf visibility.

Supermarkets/Hypermarkets
$&%
Specialty Stores
$&%
Online Retail
$&%
Direct Sales
$&%

By Packaging Type

Tracks monetization by format and convenience, where Loose Leaf Tea remains culturally entrenched despite rapid bottled product commercialization.

Loose Leaf Tea
$&%
Tea Bags
$&%
Bottled Tea
$&%
Canned Tea
$&%

By End User

Separates demand by purchaser economics, with Household remaining the core base while industrial buyers anchor RTD tea procurement.

Household
$&%
Food Service (Restaurants | Cafes)
$&%
Industrial (Ready-to-Drink Tea Manufacturers)
$&%

By Region

Organizes the Vietnam Tea Market by commercial geography, with Northern Vietnam dominant due to cultivation scale, origin branding, and processing density.

Northern Vietnam
$&%
Central Vietnam
$&%
Southern Vietnam
$&%
Export Markets (Europe | USA | Middle East | Africa)
$&%

Key Segmentation Takeaways

Comprehensive analysis across all segmentation dimensions providing insights into market structure, buyer preferences, revenue concentration, and distribution patterns.

By Tea Type

This is the commercially dominant segmentation axis because product mix determines pricing, margin, sourcing needs, and route-to-market. Green Tea leads because it spans daily household use, gifting, and foodservice, while still feeding premium local brands. The axis is strategically useful because it separates commodity exposure from higher-value specialty and flavored demand pools.

By Distribution Channel

This is the fastest-growing segmentation axis because competitive advantage is moving toward shelf control, omni-channel packaging, and digital customer acquisition. Online Retail is scaling from a smaller base, while modern trade continues to shape visibility for RTD and packaged tea. For investors, channel execution increasingly determines brand velocity and realized pricing more than cultivation footprint alone.

CHAPTER 7 - Regional Analysis

Regional Analysis

Within a selected ASEAN peer set, Vietnam ranks as a scale leader in tea production and one of the faster-expanding consumer tea markets. Its position is supported by a large cultivated base, strong domestic drinking culture, and the ability to monetize both export tea and branded beverage formats, placing it ahead of most regional peers on supply depth and above the peer average on growth outlook.

Regional Ranking

2nd

Regional Share vs Global (ASEAN)

26.3%

Vietnam CAGR (2025-2030)

8.3%

Regional Analysis (Current Year)

Regional Analysis Comparison

MetricVietnamASEAN Peer Benchmark
Market SizeUSD 895 MnUSD 760 Mn
CAGR (%)8.3%6.5%
Per Capita Tea Consumption (kg/person)1.40.9
Tea Production (000 tonnes)23098

Market Position

Vietnam ranks 2nd in the selected ASEAN peer set by market size at USD 895 Mn in 2024 , supported by far stronger tea production depth of 230,000 tonnes than most regional comparators.

Growth Advantage

Vietnam’s 8.3% CAGR for 2025-2030 places it above the peer benchmark of 6.5% , reflecting faster value migration into RTD, specialty, and branded packaged tea.

Competitive Strengths

Vietnam combines 101.1 million people , 128,000 hectares of tea area, and a large processing/export base, giving it better raw material security, domestic scale, and premiumization runway than most ASEAN peers.

CHAPTER 8 - INDUSTRY ANALYSIS

Growth Drivers, Market Challenges & Market Opportunities

Comprehensive analysis of key factors shaping the Vietnam Tea Market, including growth catalysts, operational challenges, and emerging opportunities across production, distribution, and consumer segments.

Growth Drivers

RTD Commercialization and Convenience-Led Consumption

  • RTD tea represents 46.9% of total market value (2024, Vietnam) , making it the largest profit pool and the clearest route for scaling brands beyond loose-leaf consumption. Value accrues to processors, bottlers, and route-to-market partners rather than growers alone.
  • Vietnam’s urban population reached 38.6 million people, 38.2% of total population (2024, Vietnam) , supporting on-the-go packaged beverage demand and accelerating tea consumption outside traditional home preparation. This favors brands with modern trade execution and cold-chain discipline.
  • Vietnam’s e-commerce market exceeded USD 25 Bn (2024, Vietnam) , equivalent to about 9% of total retail goods and consumer-service sales , giving packaged tea and functional beverage brands a lower-cost discovery and repeat-purchase channel.

Export Recovery and Broader Market Reach

  • Export value rose from USD 211 Mn (2023, Vietnam) to USD 256.4 Mn (2024, Vietnam) , improving plant utilization and working-capital absorption across bulk and semi-processed tea chains. Export-oriented processors capture the first-order benefit through higher shipment volumes and improved cash generation.
  • Vietnam exported tea to more than 70 markets (2024, Vietnam) , which matters because geographic diversification lowers dependence on any one buyer cluster and improves optionality for higher-value origin-led tea. The strategic winner is the exporter with flexible product mix and market access documentation.
  • Pakistan-related logistics support remained commercially important, with nearly 500 Vietnamese tea containers cleared for re-export in early 2026 . This demonstrates how active trade facilitation can protect receivables and channel continuity for Vietnamese exporters when corridor friction emerges.

Traceability, Premiumization, and Origin Branding

  • Specialty, Organic & Oolong Tea is projected to grow at 11.5% CAGR (2024-2029, Vietnam) , the fastest among all segments. This is economically important because premium teas raise revenue intensity without requiring proportional leaf-volume expansion, improving returns on sourcing, packaging, and branding.
  • Thai Nguyen’s safe-production and linked processing zones already cover 6,500 hectares (2024, Thai Nguyen) , while one protected GI, Tan Cuong, is recognized in the EU through EVFTA. That improves pricing power for compliant producers and supports premium export positioning.
  • Vietnam’s organic farming area exceeded 174,000 hectares (2025, Vietnam) , showing that premium compliance systems are scaling beyond niche pilots. Tea processors that can integrate certified raw material into branded lines should gain from margin expansion and stronger buyer acceptance in developed markets.

Market Challenges

Low Export Unit Value and Margin Compression

  • The 2024 export average equates to roughly USD 1,755 per tonne (2024, Vietnam) , well below the monetization level implied by domestic branded, RTD, and specialty formats. Economically, this keeps bulk exporters exposed to price competition and limits cash available for reinvestment.
  • Tea export prices were volatile through 2024, with the first-quarter average cited at about USD 1,616 per tonne (Q1 2024, Vietnam) . Price instability complicates procurement planning, hedging, and receivables forecasting for processors operating on thin commodity margins.
  • When export tea remains a slow-growth segment at 4.2% CAGR (2024-2029, Vietnam) , capital naturally migrates toward RTD and premium domestic formats. Firms that fail to upgrade product mix risk becoming volume suppliers with structurally weaker earnings quality.

Geographic and Corridor Concentration Risk

  • High single-market dependence matters because any payment, border, or policy disruption can affect a disproportionate share of annual export cash flows. Exporters with narrow customer concentration face greater revenue volatility than branded domestic players.
  • The re-export case involving nearly 500 containers (2026, Pakistan corridor) showed that logistics bottlenecks can freeze inventory and working capital even when end-demand remains intact. This raises the value of diversified routing and stronger market portfolios.
  • Market concentration also weakens pricing leverage, because bulk sellers have less flexibility to redirect volumes quickly into premium or alternate destination channels. Strategy teams should therefore treat customer diversification as a margin-protection tool, not only a sales target.

Fragmented Compliance and Uneven Quality Upgrading

  • Even in the lead province, Thai Nguyen had 45 planting area codes across 22,500 hectares (2024, Thai Nguyen) , showing that formal traceability still covers only part of the supply base. This limits the share of tea that can seamlessly enter premium, export-compliant channels.
  • Compliance costs rise when processors must segregate raw material, document origin, and manage different residue or certification requirements across buyers. Smaller firms usually absorb these costs less efficiently, which widens the profitability gap with larger branded operators.
  • Government and industry have emphasized sustainable chains, yet the commercial result depends on execution at farm and processor level. Without broader certification and traceability, Vietnam risks remaining overrepresented in low-value bulk tea rather than premium branded tea.

Market Opportunities

Premium Organic and Origin-Led Tea Platforms

  • Premium teas monetize through higher unit pricing, curated gifting, specialty retail, and export niches rather than mass tonnage. With market revenue per tonne already at USD 2,157/t (2024, Vietnam Tea Market) , successful premium brands can widen margin without proportionate raw-material growth.
  • Producers, processors, and investors benefit most where GI protection, organic certification, and estate-linked storytelling are strongest. B?n Li?n’s organic Shan Tuyet tea area exceeded 422 hectares (2023, Lao Cai) , with reported profitability of VND 80-100 million per hectare , illustrating premium economics.
  • For this opportunity to scale, more sourcing zones need certification, traceability, and buyer-facing documentation. The commercial unlock is not only higher price, but access to buyers that will not purchase unverified tea at all.

Digitally Enabled Branded Tea Expansion

  • The monetizable angle lies in direct-to-consumer packs, subscription gifting, limited-edition specialty drops, and cross-border marketplace storefronts. Digital channels reduce the dependence on distributor markups and improve data visibility on repeat consumption and price sensitivity.
  • Brand owners, specialty processors, and export-focused SMEs benefit because online channels make smaller premium SKUs commercially viable. This is especially relevant in a market where RTD and packaged tea are more branding-sensitive than bulk leaf tea.
  • The opportunity requires better digital merchandising, compliance labeling, fulfillment reliability, and brand protection. Vietnam’s new e-commerce law framework, approved in December 2025 , should gradually formalize seller accountability and platform obligations, which favors more organized tea brands.

Processing and Traceability Capex in Production Hubs

  • The revenue model is attractive where processors can lock in leaf sourcing, upgrade drying and packaging yield, and shift output into higher-value domestic or export channels. That is more scalable than competing solely on farmgate leaf procurement.
  • Investors, branded operators, and lenders benefit because asset-backed processing in strong tea clusters improves supply security and raises the probability of premium channel success. It also creates clearer underwriting metrics than fragmented raw-leaf trading.
  • To fully materialize, more estates and cooperatives need planting area codes, digital traceability, and commercial alignment with branded processors. The value unlock comes when traceability becomes standard enough to support scale, not only niche premium batches.
CHAPTER 9 - Competitive Landscape

Competitive Landscape Overview

The Vietnam Tea Market remains fragmented in branded and regional tea niches, while scale advantages sit with processors controlling sourcing, export relationships, packaging assets, and origin-linked brands. Entry barriers are moderate in loose tea, higher in RTD, certified specialty tea, and export-compliant processing.

Market Share Distribution

Thai Nguyen Tea Joint Stock Company
Vietnam National Tea Corporation (VINATEA)
Tan Cuong Hoang Binh Tea JSC
Phu Da Tea Joint Stock Company

Top 5 Players

1
Thai Nguyen Tea Joint Stock Company
!$*
2
Vietnam National Tea Corporation (VINATEA)
^&
3
Tan Cuong Hoang Binh Tea JSC
#@
4
Phu Da Tea Joint Stock Company
$
5
Hiep Thanh Tea Co., Ltd.
&@$
Combined Share$%

Market Dynamics

Local Players70%
Regional/Int'l30%

8 new entrants in the past 5 years, indicating strong market attractiveness and growth potential.

Company Profiles (Top 10 Players)
Company Name
Market Share
Headquarters
Founding Year
Core Market Focus
Thai Nguyen Tea Joint Stock Company
---Loose-leaf and packaged Thai Nguyen tea
Vietnam National Tea Corporation (VINATEA)
-Hanoi, Vietnam1958Bulk black and green tea, processing, export, branded tea
Tan Cuong Hoang Binh Tea JSC
-Thai Nguyen, Vietnam2012Premium green tea, black tea, packaged and export tea
Phu Da Tea Joint Stock Company
---Tea processing and export-oriented production
Hiep Thanh Tea Co., Ltd.
---Organic and packaged tea, tea bags, specialty tea
Do Huu Tea Company
---Bao Loc branded tea and flavored local tea
Dong Nai Tea Corporation
---Plantation-linked tea processing and commercial tea supply
Cau Dat Farm
-Da Lat, Lam Dong, Vietnam1927Highland specialty tea, oolong tea, tea tourism, branded beverages
BLao Tea JSC
---Bao Loc tea, highland specialty tea, packaged tea
Hanoi Tea Processing and Exporting JSC
---Tea processing, packaging, and export trading

Cross Comparison Parameters

The report provides detailed cross-comparison of key players across 10 performance parameters to identify competitive strengths and weaknesses.

1

Product Breadth

2

Export Reach

3

Processing Capacity

4

Plantation Control

5

Certification Depth

6

Premiumization Capability

7

RTD Exposure

8

Modern Retail Presence

9

Digital Commerce Reach

10

Value-added Mix

Analysis Covered

Market Share Analysis:

Assesses relative positioning across branded, export, and specialty tea pools.

Cross Comparison Matrix:

Benchmarks companies on scale, channel strength, compliance, and focus.

SWOT Analysis:

Identifies structural strengths, weaknesses, risks, and expansion headroom.

Pricing Strategy Analysis:

Compares mass, premium, export, and specialty pricing models.

Company Profiles:

Summarizes ownership, location, founding, and strategic operating focus.

CHAPTER 10 - REPORT TOC

Market Report Structure

Comprehensive coverage across three strategic phases — Market Assessment, Go-To-Market Strategy, and Survey — delivering end-to-end insights from market analysis and execution roadmap to customer demand validation.

80Pages
34Chapters
10Companies Profiled
7Segmentation Types

Phase 1
Market Assessment Phase

11

Chapters

Supply-side and competitive intelligence covering market sizing, segmentation, competitive dynamics, regulatory landscape, and future forecasts.

Phase 2
Go-To-Market Strategy Phase

15

Chapters

Entry strategy evaluation, execution roadmap, partner recommendations, and profitability outlook.

Phase 3
Survey Phase

8

Chapters

Demand-side primary research conducted through structured interviews and online surveys with end users across priority metros and Tier 2/3 cities to capture consumption behavior, unmet needs, and purchase drivers.

Complete Report Coverage

201+ detailed sections covering every aspect of the market

143

Assessment Sections

58

Strategy Sections

CHAPTER 11 - Our Approach

Research Methodology

Desk Research

  • Tea area and output mapping
  • RTD beverage revenue benchmarking
  • Export customs series validation
  • Regional tea cluster policy review

Primary Research

  • Interviews with tea factory directors
  • Discussions with plantation procurement heads
  • Inputs from branded beverage managers
  • Consultations with export sales leaders

Validation and Triangulation

  • 126 expert calls across value chain
  • Supply-demand revenue cross-check model
  • Volume-price corridor sanity checks
  • Segment share reconciliation testing
CHAPTER 12 - FAQ

FAQs

Still have questions?

Our research team is here to help you find the right solution

Contact Research Team
CHAPTER 13 - Related Research

Explore Related Reports

Expand your market intelligence with complementary research across regions and adjacent markets.

Regional/Country Reports

Related market analysis across key regions

  • Africa Tea MarketKenya
  • USA Tea Market Outlook to 2030United States
  • India Tea Market Outlook to 2030India
  • Global Tea Market Outlook to 2030Global
  • Indonesia Tea MarketIndonesia
  • Thailand Tea MarketThailand
  • Malaysia Tea MarketMalaysia
  • Philippines Tea MarketPhilippines
  • Singapore Tea MarketSingapore
  • UAE Tea MarketUnited Arab Emirates
  • KSA Tea Market Outlook to 2030Saudi Arabia
  • South Korea Tea MarketSouth Korea
  • Japan Tea MarketJapan
  • Egypt Tea MarketEgypt
  • South Africa Tea MarketSouth Africa
  • Kuwait Tea MarketKuwait
  • Qatar Tea MarketQatar
  • Brazil Tea MarketBrazil
  • Belgium Tea MarketBelgium
  • Oman Tea MarketOman
  • Bahrain Tea MarketBahrain
  • Mexico Tea MarketMexico
  • Germany Tea MarketGermany
  • APAC Tea MarketAPAC
  • MEA Tea MarketMEA
  • SEA Tea MarketSEA
  • GCC Tea MarketGCC
  • Comoros Tea MarketComoros
  • Djibouti Tea MarketDjibouti
  • Eritrea Tea MarketEritrea
  • Ethiopia Tea MarketEthiopia
  • Madagascar Tea MarketMadagascar
  • Malawi Tea MarketMalawi
  • Mauritius Tea MarketMauritius
  • Mayotte Tea MarketMayotte
  • Mozambique Tea MarketMozambique
  • Reunion Tea MarketReunion
  • Rwanda Tea MarketRwanda
  • Seychelles Tea MarketSeychelles
  • Somalia Tea MarketSomalia
  • Tanzania Tea MarketTanzania
  • Uganda Tea MarketUganda
  • Zambia Tea MarketZambia
  • Zimbabwe Tea MarketZimbabwe
  • Angola Tea MarketAngola
  • Cameroon Tea MarketCameroon
  • Central African Republic Tea MarketCentral African Republic
  • Chad Tea MarketChad
  • Congo Tea MarketCongo
  • Equatorial Guinea Tea MarketEquatorial Guinea
  • Gabon Tea MarketGabon
  • Sao Tome and Principe Tea MarketSao Tome and Principe
  • Algeria Tea MarketAlgeria
  • Egypt Tea MarketEgypt
  • Libyan Arab Jamahiriya Tea MarketLibyan Arab Jamahiriya
  • Morroco Tea MarketMorroco
  • South Sudan Tea MarketSouth Sudan
  • Sudan Tea MarketSudan
  • Tunisia Tea MarketTunisia
  • Western Sahara Tea MarketWestern Sahara
  • Botswana Tea MarketBotswana
  • Lesotho Tea MarketLesotho
  • Namibia Tea MarketNamibia
  • South Africa Tea MarketSouth Africa
  • Swaziland Tea MarketSwaziland
  • Benin Tea MarketBenin
  • Burkina Faso Tea MarketBurkina Faso
  • Cape Verde Tea MarketCape Verde
  • Ivory Coast Tea MarketIvory Coast
  • Gambia Tea MarketGambia
  • Ghana Tea MarketGhana
  • Guinea Tea MarketGuinea
  • Guinea-Bissau Tea MarketGuinea-Bissau
  • Liberia Tea MarketLiberia
  • Mali Tea MarketMali
  • Mauritania Tea MarketMauritania
  • Niger Tea MarketNiger
  • Nigeria Tea MarketNigeria
  • Saint Helena Tea MarketSaint Helena
  • Senegal Tea MarketSenegal
  • Sierra Leone Tea MarketSierra Leone
  • Togo Tea MarketTogo
  • Anguilla Tea MarketAnguilla
  • Antigua and Barbuda Tea MarketAntigua and Barbuda
  • Aruba Tea MarketAruba
  • Bahamas Tea MarketBahamas
  • Barbados Tea MarketBarbados
  • Bonaire Tea MarketBonaire
  • British Virgin Islands Tea MarketBritish Virgin Islands
  • Cayman Islands Tea MarketCayman Islands
  • Cuba Tea MarketCuba
  • Curacao Tea MarketCuracao
  • Dominica Tea MarketDominica
  • Dominican Republic Tea MarketDominican Republic
  • Grenada Tea MarketGrenada
  • Guadeloupe Tea MarketGuadeloupe
  • Haiti Tea MarketHaiti
  • Jamaica Tea MarketJamaica
  • Martinique Tea MarketMartinique
  • Monserrat Tea MarketMonserrat
  • Puerto Rico Tea MarketPuerto Rico
  • Saint Lucia Tea MarketSaint Lucia
  • Saint Martin Tea MarketSaint Martin
  • Saint Vincent and the Grenadines Tea MarketSaint Vincent and the Grenadines
  • Sint Maarten Tea MarketSint Maarten
  • Trinidad and Tobago Tea MarketTrinidad and Tobago
  • Turks and Caicos Islands Tea MarketTurks and Caicos Islands
  • Virgin Islands Tea MarketVirgin Islands
  • Belize Tea MarketBelize
  • Costa Rica Tea MarketCosta Rica
  • El Salvador Tea MarketEl Salvador
  • Guatemala Tea MarketGuatemala
  • Honduras Tea MarketHonduras
  • Mexico Tea MarketMexico
  • Nicaragua Tea MarketNicaragua
  • Panama Tea MarketPanama
  • Argentina Tea MarketArgentina
  • Bolivia Tea MarketBolivia
  • Brazil Tea MarketBrazil
  • Chile Tea MarketChile
  • Colombia Tea MarketColombia
  • Ecuador Tea MarketEcuador
  • Falkland Islands Tea MarketFalkland Islands
  • French Guiana Tea MarketFrench Guiana
  • Guyana Tea MarketGuyana
  • Paraguay Tea MarketParaguay
  • Peru Tea MarketPeru
  • Suriname Tea MarketSuriname
  • Uruguay Tea MarketUruguay
  • Venezuela Tea MarketVenezuela
  • Bermuda Tea MarketBermuda
  • Canada Tea MarketCanada
  • Greenland Tea MarketGreenland
  • Saint Pierre and Miquelon Tea MarketSaint Pierre and Miquelon
  • Afganistan Tea MarketAfganistan
  • Armenia Tea MarketArmenia
  • Azerbaijan Tea MarketAzerbaijan
  • Bangladesh Tea MarketBangladesh
  • Bhutan Tea MarketBhutan
  • Brunei Darussalam Tea MarketBrunei Darussalam
  • Cambodia Tea MarketCambodia
  • China Tea MarketChina
  • Georgia Tea MarketGeorgia
  • Hong Kong Tea MarketHong Kong
  • Indonesia Tea MarketIndonesia
  • Japan Tea MarketJapan
  • Kazakhstan Tea MarketKazakhstan
  • North Korea Tea MarketNorth Korea
  • South Korea Tea MarketSouth Korea
  • Kyrgyzstan Tea MarketKyrgyzstan
  • Laos Tea MarketLaos
  • Macao Tea MarketMacao
  • Malaysia Tea MarketMalaysia
  • Maldives Tea MarketMaldives
  • Mongolia Tea MarketMongolia
  • Myanmar Tea MarketMyanmar
  • Nepal Tea MarketNepal
  • Pakistan Tea MarketPakistan
  • Singapore Tea MarketSingapore
  • Sri Lanka Tea MarketSri Lanka
  • Taiwan Tea MarketTaiwan
  • Tajikistan Tea MarketTajikistan
  • Thailand Tea MarketThailand
  • Timor Leste Tea MarketTimor Leste
  • Turkmenistan Tea MarketTurkmenistan
  • Uzbekistan Tea MarketUzbekistan
  • Australia Tea MarketAustralia
  • Fiji Tea MarketFiji
  • French Polynesia Tea MarketFrench Polynesia
  • Guam Tea MarketGuam
  • Kiribati Tea MarketKiribati
  • Marshall Islands Tea MarketMarshall Islands
  • Micronesia Tea MarketMicronesia
  • New Caledonia Tea MarketNew Caledonia
  • New Zealand Tea MarketNew Zealand
  • Papua New Guinea Tea MarketPapua New Guinea
  • Samoa Tea MarketSamoa
  • Samoa (American) Tea MarketSamoa (American)
  • Solomon (Islands) Tea MarketSolomon (Islands)
  • Tonga Tea MarketTonga
  • Vanuatu Tea MarketVanuatu
  • Albania Tea MarketAlbania
  • Andorra Tea MarketAndorra
  • Belarus Tea MarketBelarus
  • Bosnia Herzegovina Tea MarketBosnia Herzegovina
  • Croatia Tea MarketCroatia
  • European Union Tea MarketEuropean Union
  • Faroe Islands Tea MarketFaroe Islands
  • Gibraltar Tea MarketGibraltar
  • Guerney & Alderney Tea MarketGuerney & Alderney
  • Iceland Tea MarketIceland
  • Jersey Tea MarketJersey
  • Kosovo Tea MarketKosovo
  • Liechtenstein Tea MarketLiechtenstein
  • Macedonia Tea MarketMacedonia
  • Man (Island of) Tea MarketMan (Island of)
  • Moldova Tea MarketMoldova
  • Monaco Tea MarketMonaco
  • Montenegro Tea MarketMontenegro
  • Norway Tea MarketNorway
  • Russia Tea MarketRussia
  • San Marino Tea MarketSan Marino
  • Serbia Tea MarketSerbia
  • Svalbard and Jan Mayen Islands Tea MarketSvalbard and Jan Mayen Islands
  • Switzerland Tea MarketSwitzerland
  • Ukraine Tea MarketUkraine
  • Vatican City Tea MarketVatican City
  • Austria Tea MarketAustria
  • Belgium Tea MarketBelgium
  • Bulgaria Tea MarketBulgaria
  • Cyprus Tea MarketCyprus
  • Czech Republic Tea MarketCzech Republic
  • Denmark Tea MarketDenmark
  • Estonia Tea MarketEstonia
  • Finland Tea MarketFinland
  • France Tea MarketFrance
  • Germany Tea MarketGermany
  • Greece Tea MarketGreece
  • Hungary Tea MarketHungary
  • Ireland Tea MarketIreland
  • Italy Tea MarketItaly
  • Latvia Tea MarketLatvia
  • Lithuania Tea MarketLithuania
  • Luxembourg Tea MarketLuxembourg
  • Malta Tea MarketMalta
  • Netherlands Tea MarketNetherlands
  • Poland Tea MarketPoland
  • Portugal Tea MarketPortugal
  • Romania Tea MarketRomania
  • Slovakia Tea MarketSlovakia
  • Slovenia Tea MarketSlovenia
  • Spain Tea MarketSpain
  • Sweden Tea MarketSweden
  • United Kingdom Tea MarketUnited Kingdom
  • Bahrain Tea MarketBahrain
  • Iraq Tea MarketIraq
  • Iran Tea MarketIran
  • Israel Tea MarketIsrael
  • Jordan Tea MarketJordan
  • Kuwait Tea MarketKuwait
  • Lebanon Tea MarketLebanon
  • Oman Tea MarketOman
  • Palestine Tea MarketPalestine
  • Qatar Tea MarketQatar
  • Saudi Arabia Tea MarketSaudi Arabia
  • Syria Tea MarketSyria
  • United Arab Emirates Tea MarketUnited Arab Emirates
  • Yemen Tea MarketYemen
  • Great Britain Tea MarketGreat Britain
  • Macau Tea MarketMacau
  • Turkey Tea MarketTurkey
  • Asia Tea MarketAsia
  • Europe Tea MarketEurope
  • North America Tea MarketNorth America
  • Philippines Tea MarketPhilippines
  • Middle East Tea MarketMiddle East
  • Central and South America Tea MarketCentral and South America
  • Niue Tea MarketNiue
  • Morocco Tea MarketMorocco
  • Australasia Tea MarketAustralasia
  • Cote d'Ivoire Tea MarketCote d'Ivoire
  • Balkans Tea MarketBalkans
  • BRICS Tea MarketBRICS
  • Minnesota Tea MarketMinnesota
  • Scandinavia Tea MarketScandinavia
  • Palau Tea MarketPalau
  • Isle of Man Tea MarketIsle of Man
  • Asia Tea MarketAsia

Adjacent Reports

Related markets and complementary research

  • Philippines Ready-to-Drink (RTD) Beverage Market
  • Philippines Organic Food and Beverage Market
  • Vietnam Specialty Tea and Coffee Market
  • Philippines Packaging Machinery and Materials Market
  • Thailand Agricultural Traceability Technology Market
  • Brazil Export Compliance and Certification Market
  • Malaysia Agri-Food Processing Equipment Market
  • Vietnam Branded Food and Beverage Retail Market
  • Thailand Sustainable Agriculture Solutions Market
  • Qatar Cold Chain and Logistic Services Market

500+

Market Research Reports

50+

Countries Covered

15+

Industry Verticals

Want the full report and an analyst walkthrough?

Unlock the complete dataset, segmentation cuts, and competitive analysis—plus a discovery call that maps insights to your go-to-market priorities.