Cross-Border Payments & FX Decision Survey: Why India's Businesses Now Buy on Transparency, Not Just the Headline Rate
Ken Research
July 30, 2026 - 7 min read

July 30, 2026
by Ken ResearchIndia's Cross-Border Payment Flows Are Surging, but the Decision Is Still Opaque
India's business payments engine is scaling fast and going global. The India B2B payments market was valued at roughly USD 41.9 billion in 2025 and is projected to reach about USD 84.2 billion by 2034 at a 7.64% CAGR, while total digital payment value is set to triple from around INR 299 trillion to INR 907 trillion by FY30. Cross-border transactions now rank among the top growth priorities industry leaders cite.
Yet the volume hides a decision that remains stubbornly opaque. To map how businesses actually choose providers and manage currency risk, Ken Research conducted its Cross-Border Payments & FX Decision Survey across India, surveying corporate treasury teams alongside exporter and importer SME owners. The first chart frames the market structure: which providers each segment turns to, sized by the cross-border value they move.
The relationship bank still owns the flow. Primary banks handle 62% of large-enterprise cross-border value and 71% among exporter SMEs, with specialist FX and fintech providers capturing only 12–22% even in the most contested mid-market segment. Despite a decade of fintech entry, the default for most Indian businesses remains the bank they already hold an account with.
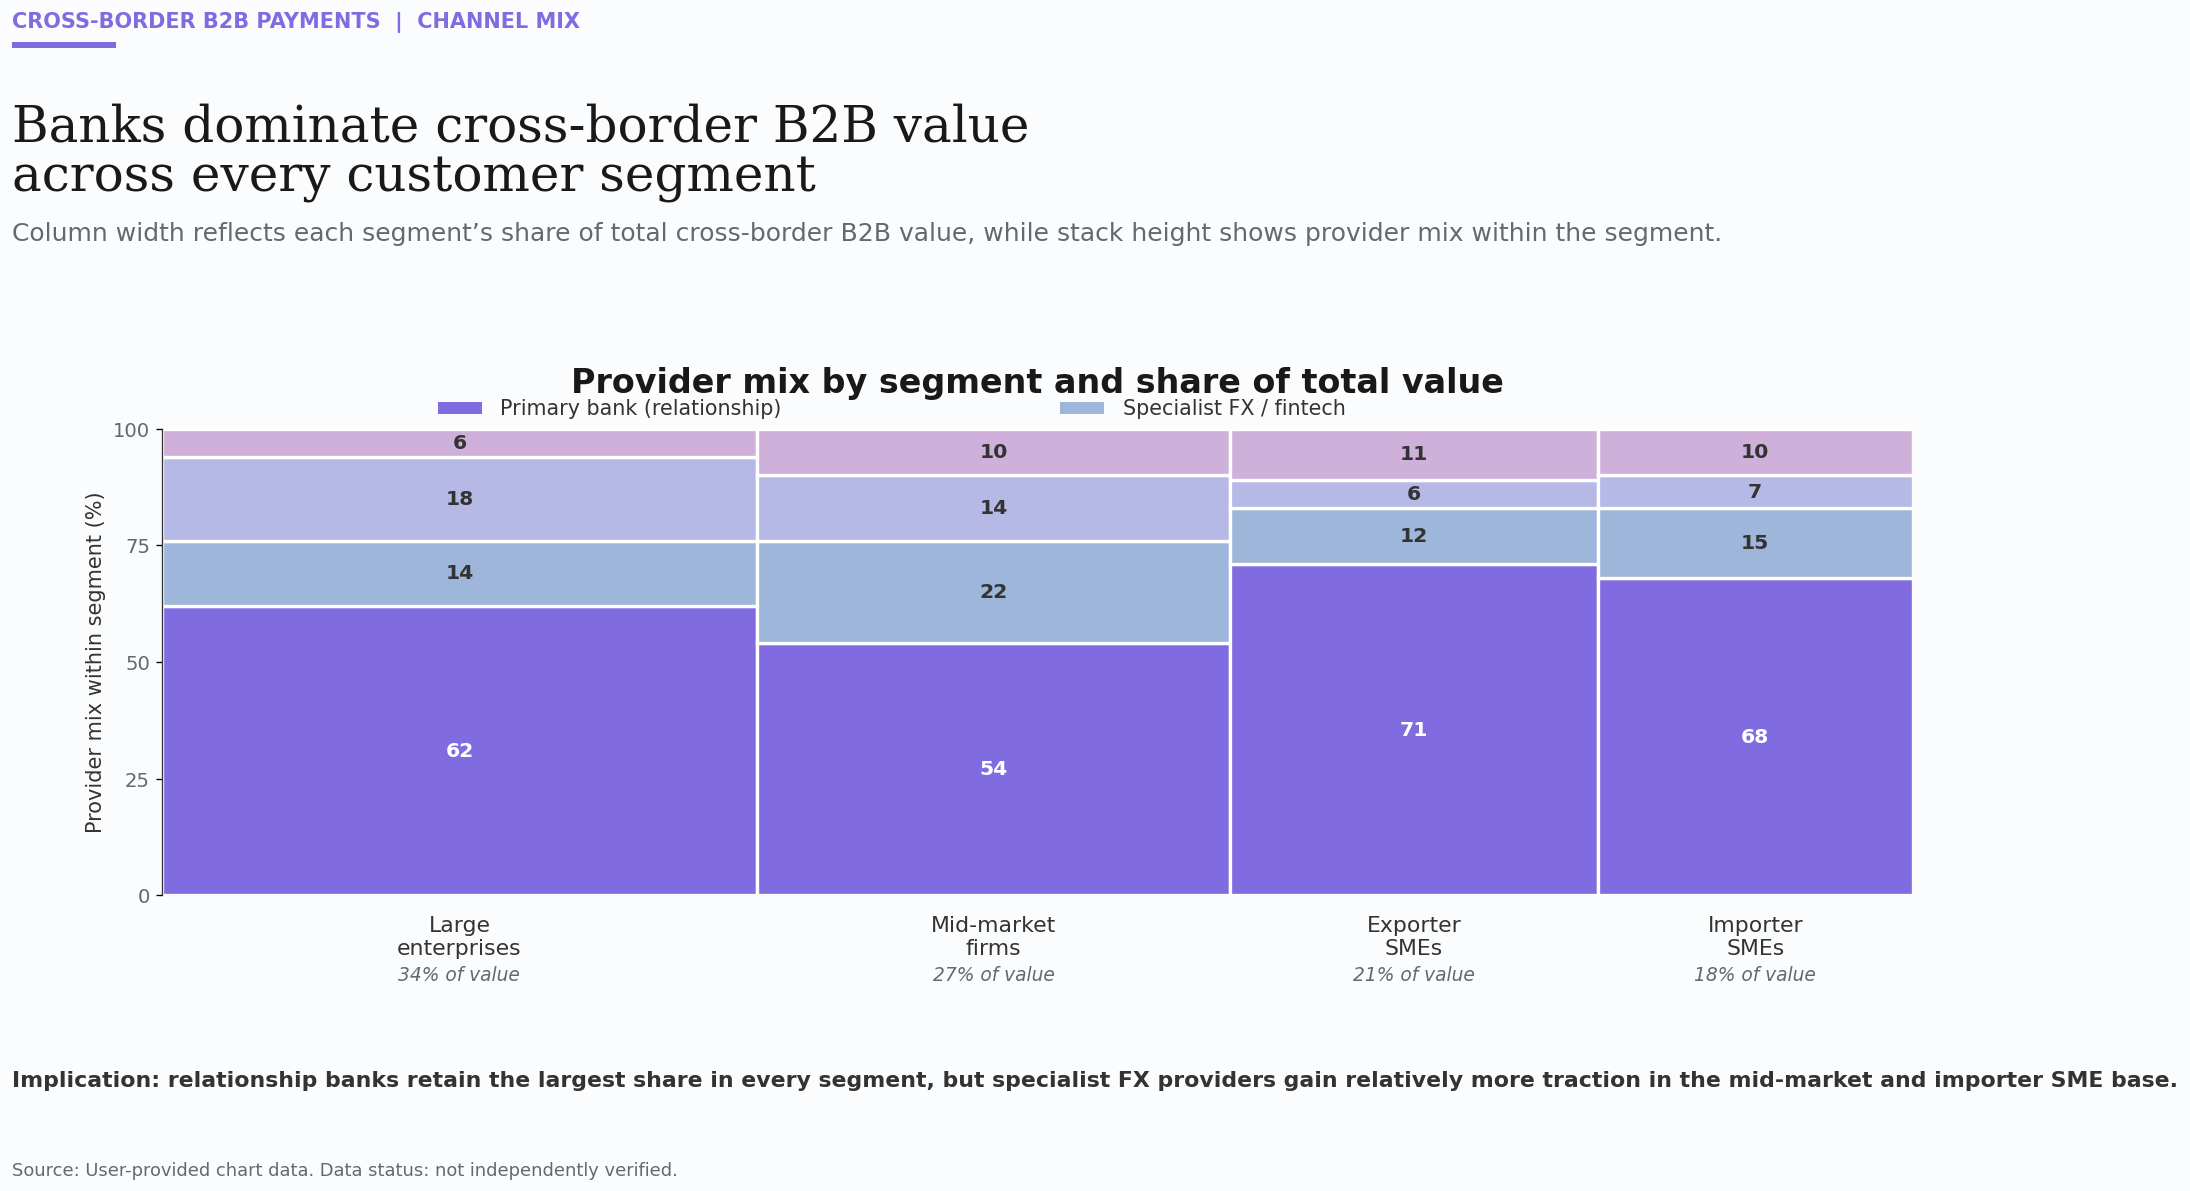
The implication is that incumbency, not price, drives the decision today. Businesses route cross-border payments through the bank of record by habit, even where cheaper, faster alternatives exist, which is precisely the inertia this survey set out to interrogate.
Survey Profile: Who We Studied, Where, and Why It Matters
Sample and Geography
The survey was conducted in Q1 of 2026 across a stratified sample of 2,400 cross-border payment decision-makers spanning North, West, South, and East India, including Mumbai, Delhi-NCR, Bengaluru, Chennai, Hyderabad, Pune, Ahmedabad, and Surat. The frame covered manufacturing, IT and ITeS, pharma, gems and jewellery, textiles, and trading houses, weighted by foreign-currency transaction value. Fieldwork combined online panels, treasury interviews, and assisted telephone surveys.
Respondent Profile
- Role mix: 38% corporate treasury and CFO-office leaders, 34% finance managers, and 28% exporter or importer SME owner-operators who make FX calls directly
- Business type: 41% exporters, 33% importers, 26% with two-way foreign-currency exposure across goods and services trade
- Exposure currency: the US dollar dominates receivables and payables, followed by the euro, pound, and UAE dirham, reflecting India's main trade corridors
- FX maturity: a large share still take rate decisions on a single main-bank quote, with structured hedging concentrated among larger firms
The Hidden Friction: How Long an FX Payment Decision Really Takes
A cross-border payment is not one action but a chain of them, and each link adds time and uncertainty. The chart below traces the elapsed time across each stage, from getting a quote to final reconciliation, showing both the typical range and the median.
The slow, variable middle is where value leaks. Comparing and negotiating the rate takes a median of 1.5 days and stretches to three, internal approval runs a median of two days and can reach four, and reconciliation adds up to 2.5 more. The transfer itself is near instant; it is the human decision and control steps around it that consume the week.
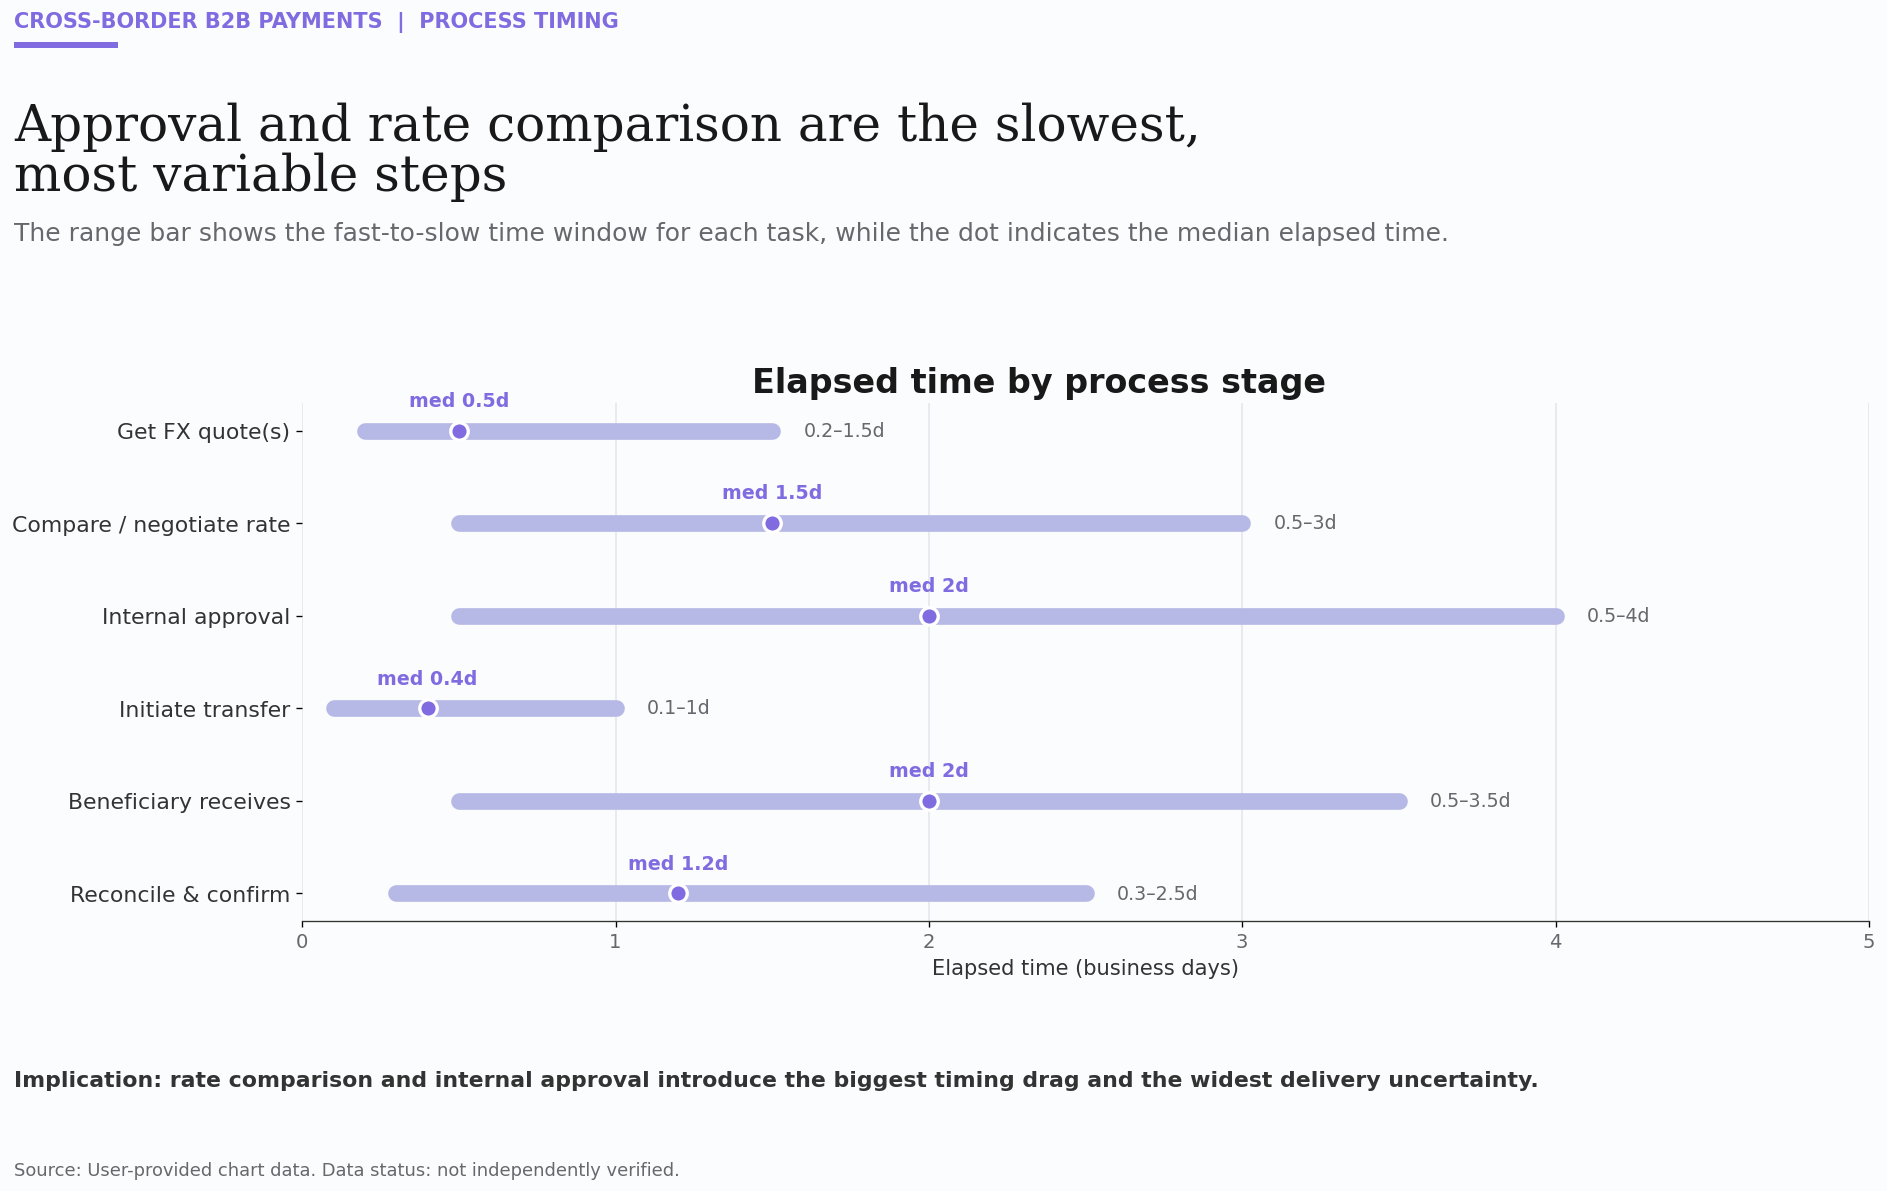
For finance teams the message is that speed is a process problem, not a rails problem. The cost of a cross-border payment is paid in approval lag and reconciliation effort as much as in fees, and that is where automation earns its return.
Where the Money Goes: The FX Margin Is the Cost Nobody Quotes
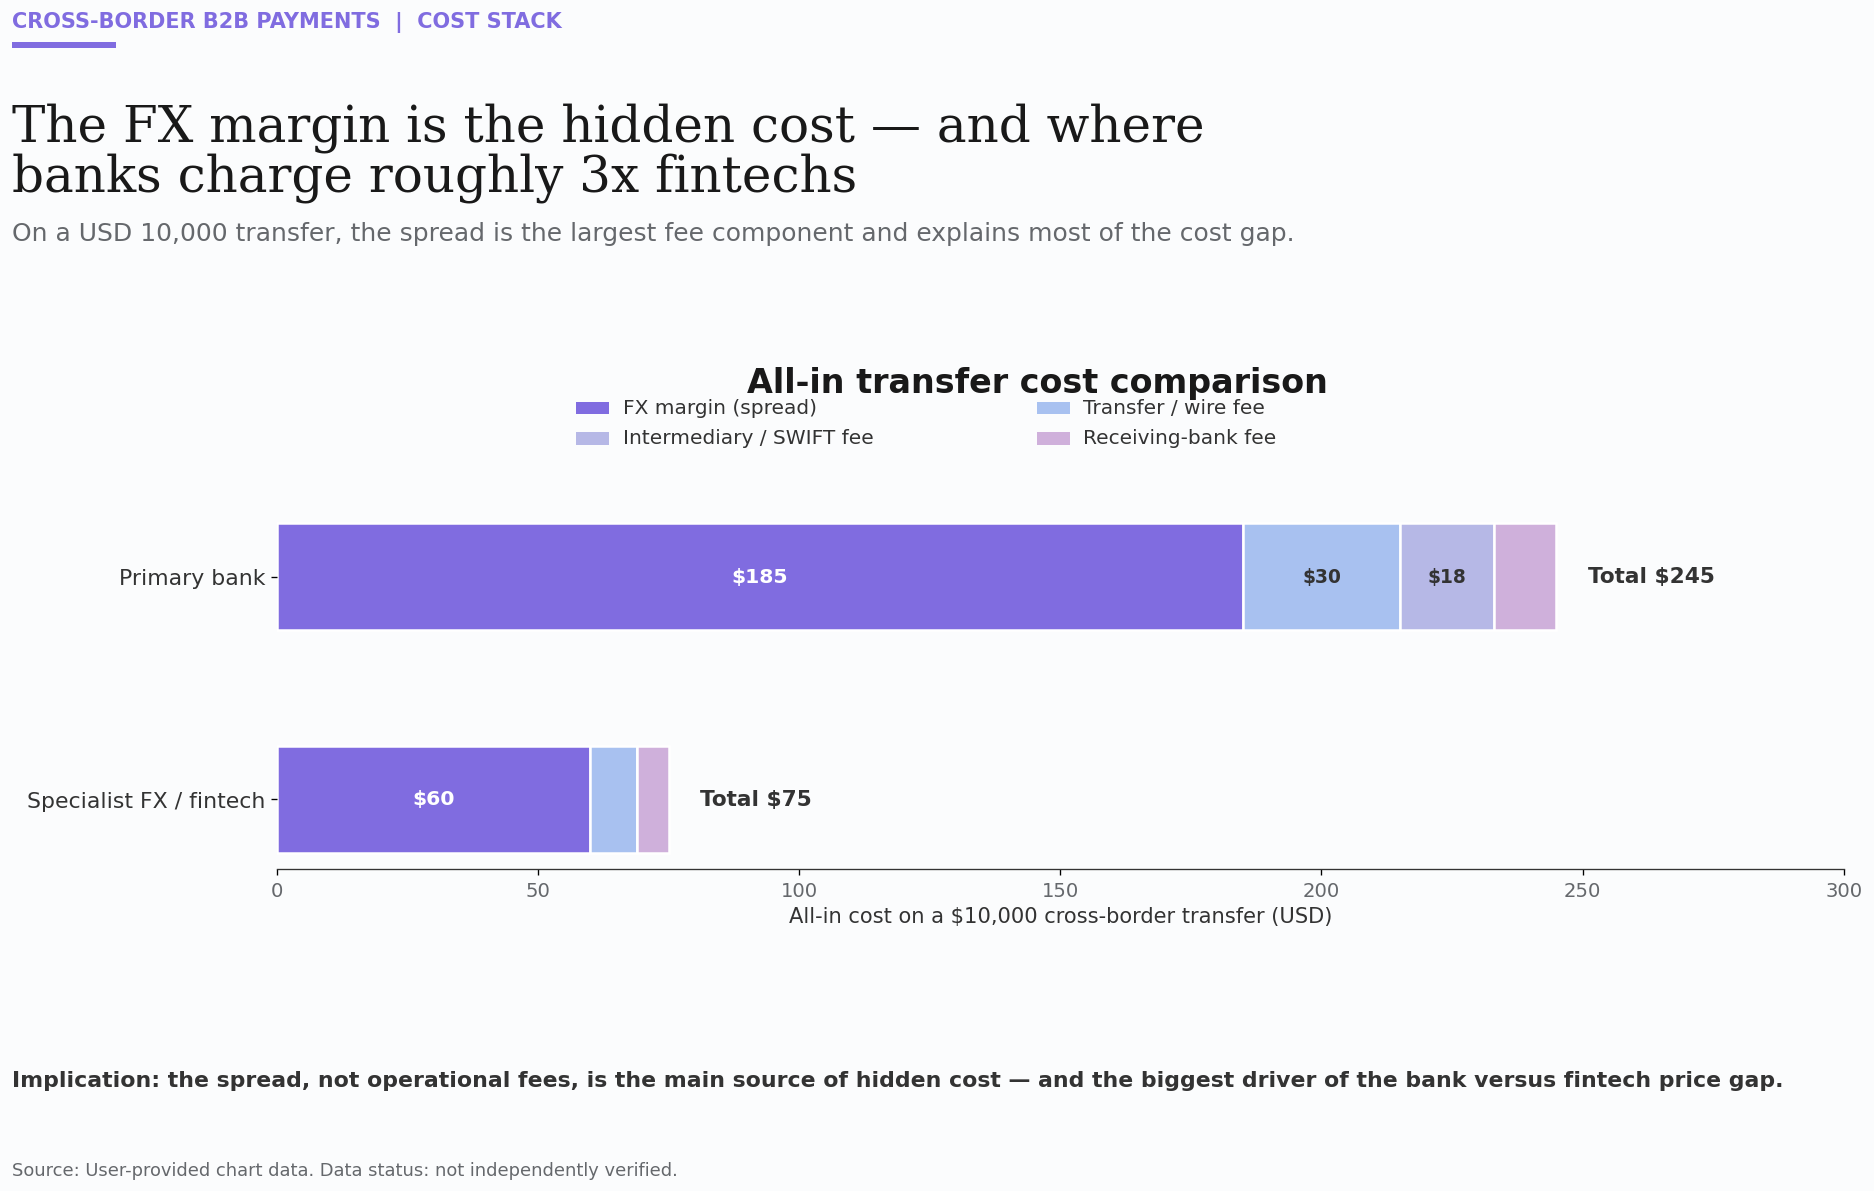
Businesses fixate on the visible wire fee, but the real cost hides in the exchange-rate margin. The chart below breaks down the all-in cost of a USD 10,000 transfer through a primary bank versus a specialist FX provider.
The gap is stark and it sits in the spread. A bank transfer costs about USD 245 all-in, of which USD 185 is FX margin alone, versus roughly USD 75 through a specialist provider whose margin is a third of the bank's. The headline wire fee of USD 30 that businesses negotiate over is the smallest line on the invoice.
What the Cost Stack Reveals
- The margin is the product: the exchange-rate spread is where providers earn, yet it is the one number rarely shown on a quote.
- Fee negotiation misses the point: haggling over the wire fee saves tens while the spread costs hundreds, a misallocation of attention most finance teams make.
- Transparency is the differentiator: providers that show the mid-market rate and a clear margin win trust, because businesses can finally compare like for like.
The Hedging Divide: Importers Protect, Exporters Wait
Currency risk is universal, but the response to it is not. Tracking forward-hedging activity month by month exposes a sharp behavioural split between importers and exporters. The chart below maps booked forward hedges through early 2026.
Importers hedge aggressively; exporters hold back. Importers booked USD 54–64 billion in forward hedges each month against USD 24–33 billion for exporters, roughly double the coverage, mirroring market data showing importer hedging up about 52% year on year versus 15% for exporters. Exporters, hoping a weaker rupee lifts realisations, leave far more exposure open.
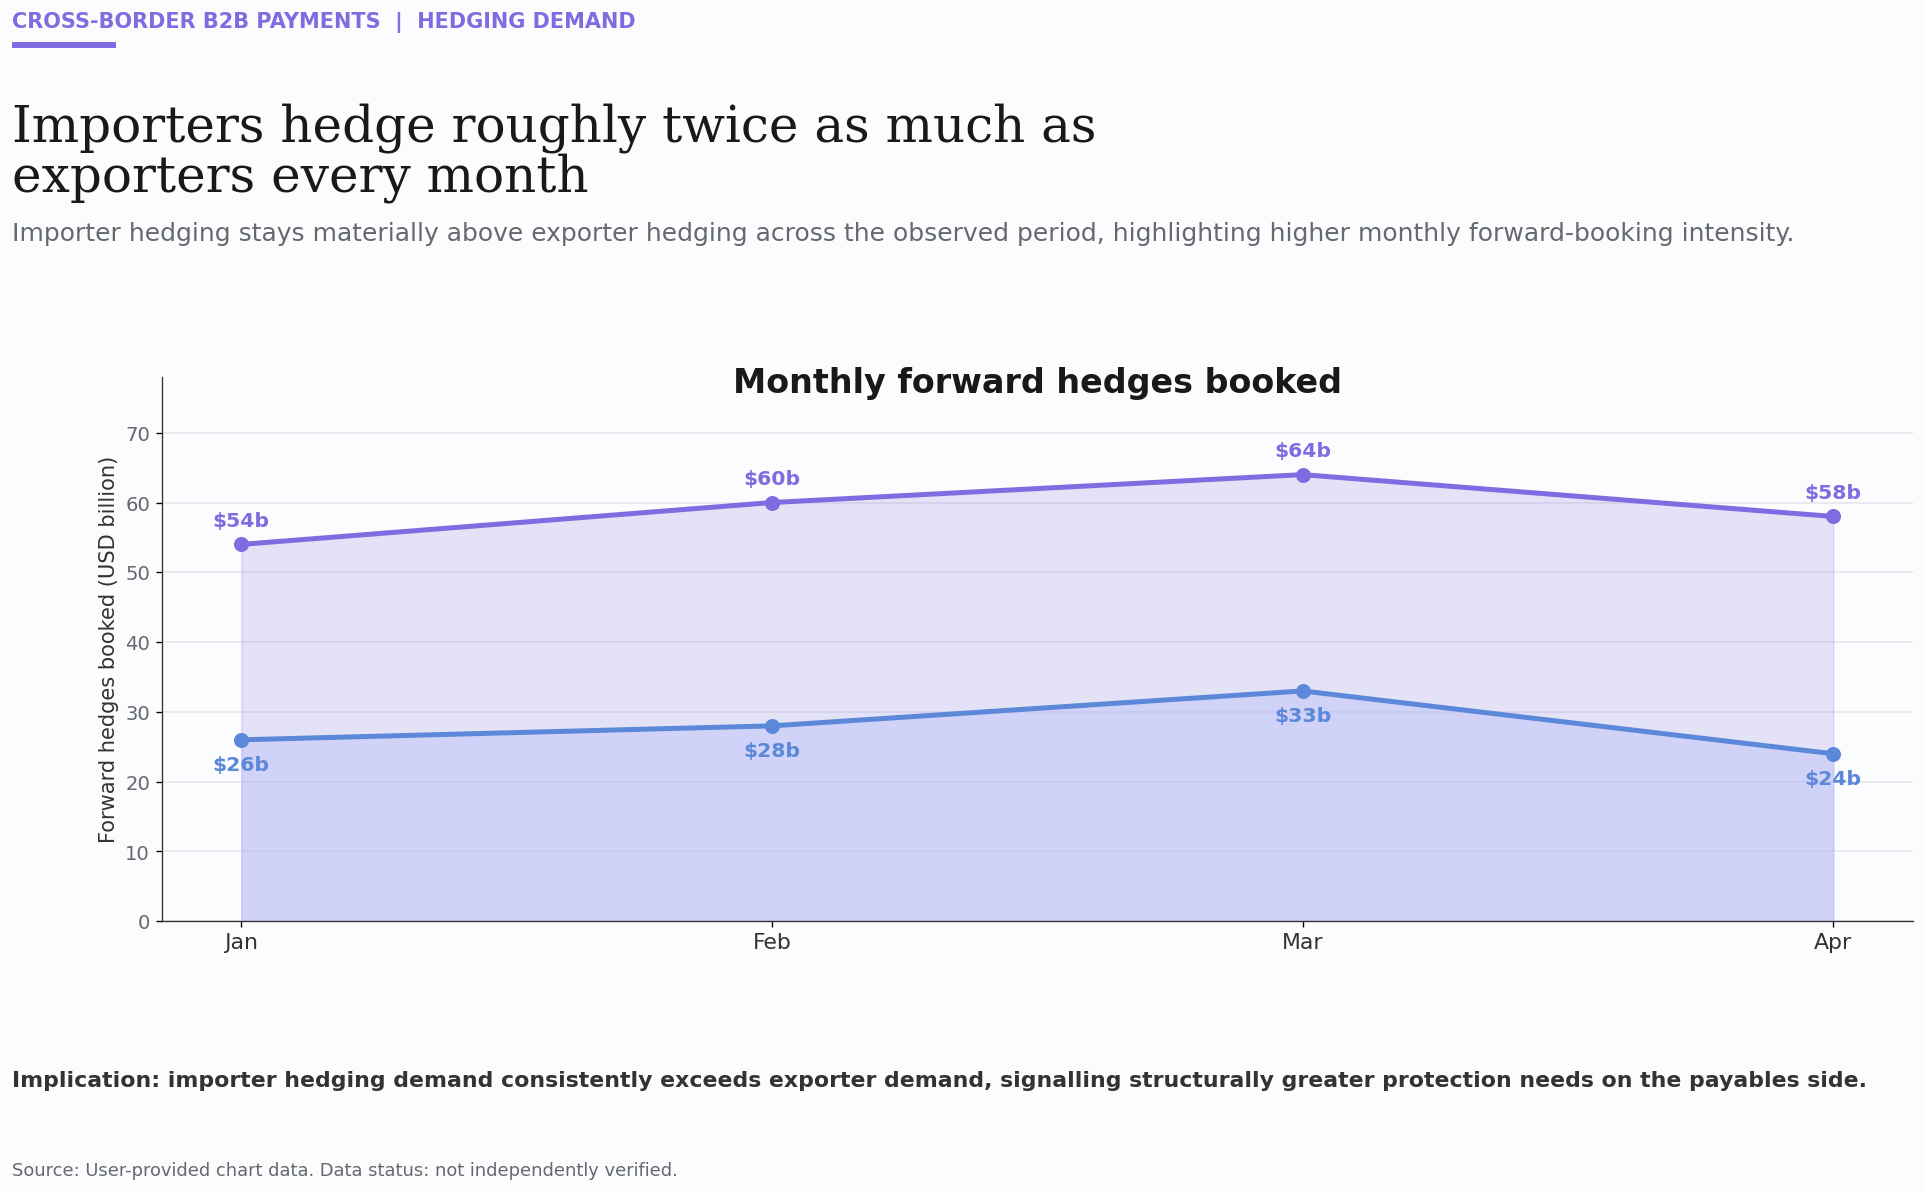
The strategic risk is asymmetric and under-managed. Exporters who treat an open position as a free bet are running unhedged speculation, not a trade business, and a sharp rupee reversal turns that gap into a loss the margin cannot absorb.
Who Feels the Pain: FX Friction Falls Hardest on SMEs
The cost and complexity of cross-border payments are not felt evenly. Mapping pain-point severity against business segment shows exactly where the friction concentrates. The chart below rates each pain from low to severe across four segments.
Smaller traders bear the heaviest burden. Opaque FX margins and limited rate transparency score severe (5 of 5) for both exporter and importer SMEs, while large enterprises with treasury teams rate the same issues only moderate. The firms least equipped to absorb hidden costs are precisely the ones paying the widest spreads and chasing the slowest reconciliations.
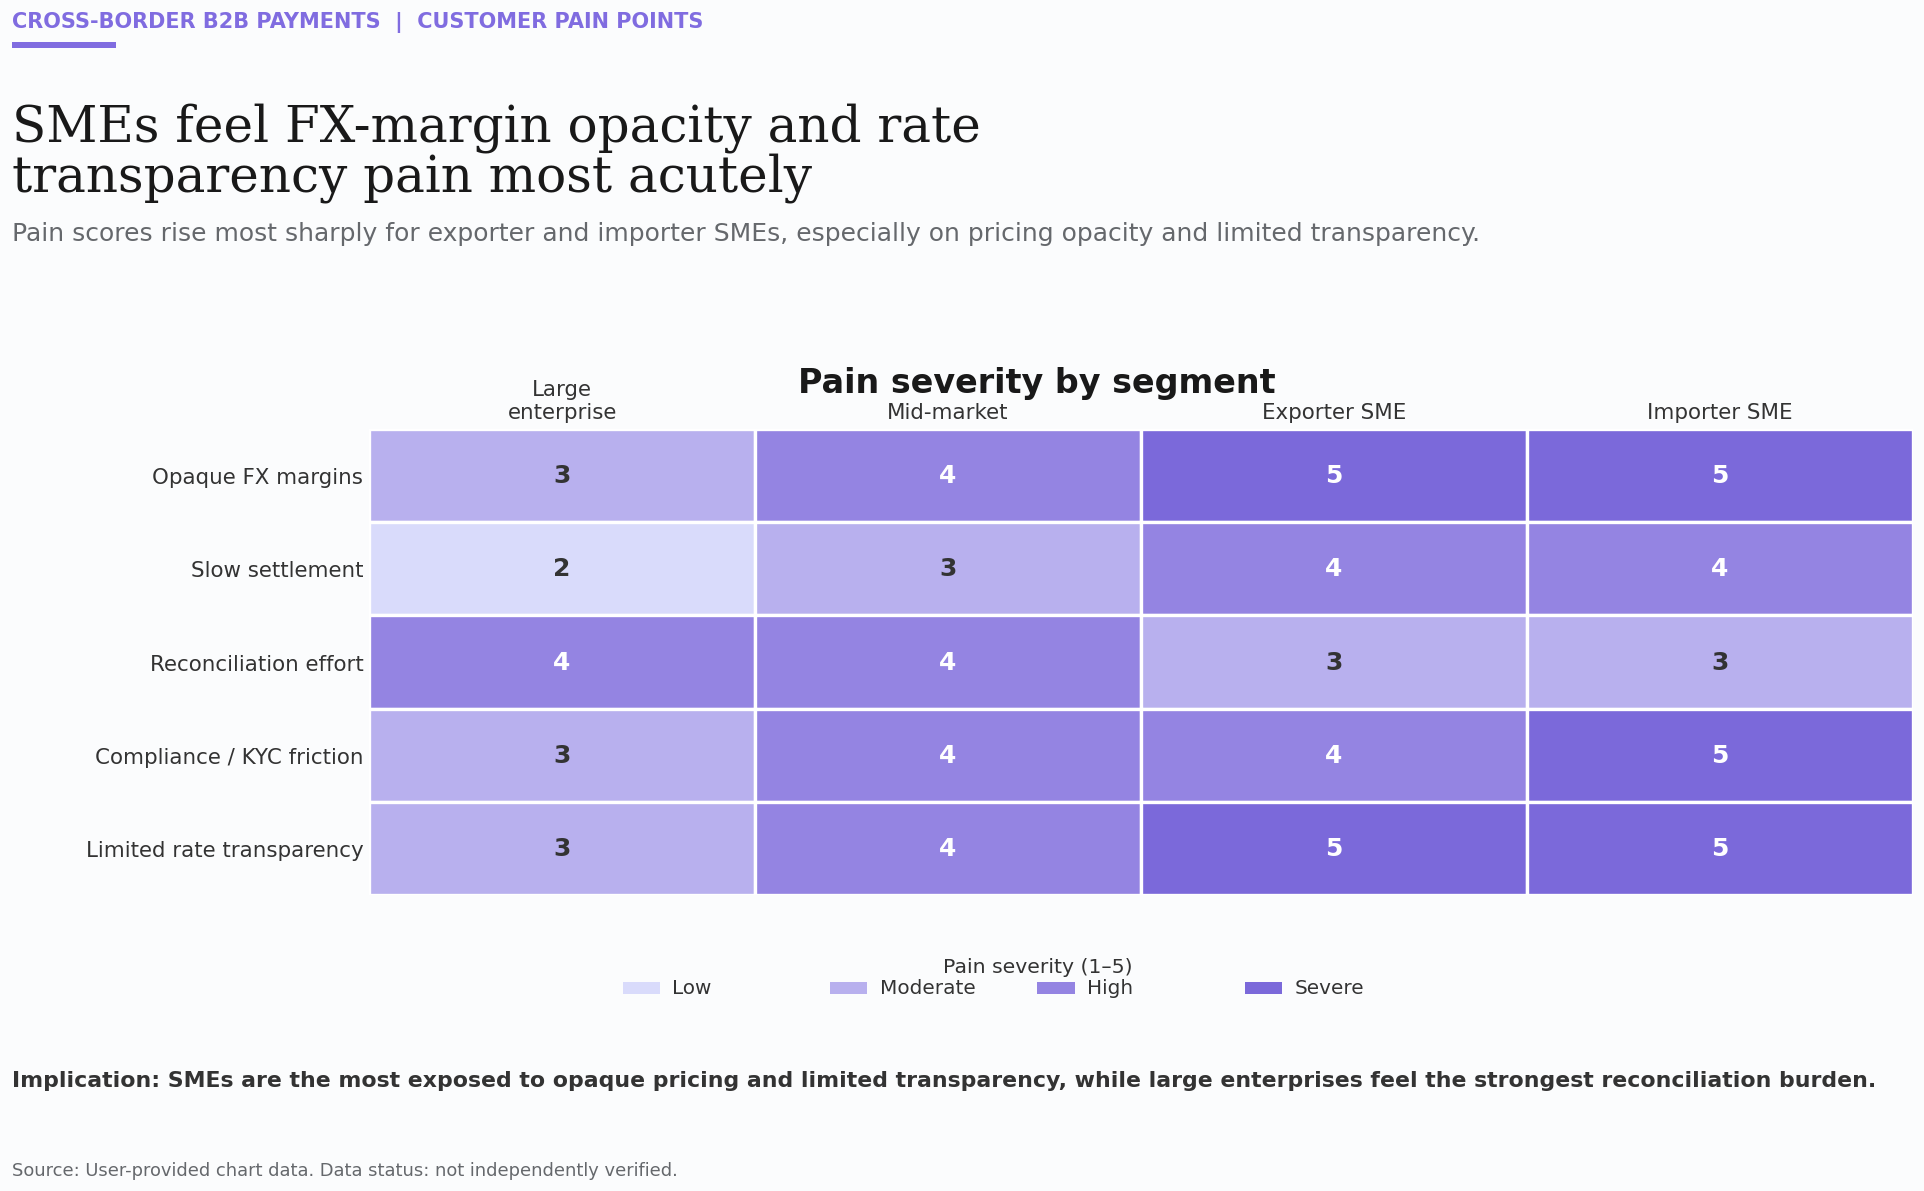
For providers and policymakers the leverage point is clear. Solve transparency and reconciliation for the SME segment and the largest pool of underserved cross-border value opens up, because that is where the friction, and the opportunity, is greatest.
What Lies Ahead: The Strategic Reckoning for India's Finance Teams
The rise of transparency as the deciding factor has turned India's cross-border payments market into a trust contest as much as a price one. Rapid growth in B2B flows, deeper trade integration, real-time settlement rails, and a maturing fintech alternative all point the same way: the provider that wins is the one that shows the true rate and the true cost, not the one with the longest-standing banking relationship.
Treasury leaders and SME owners must now confront hard strategic questions:
Do they keep routing flows through the relationship bank by habit, or test the all-in cost of a specialist provider on a real transfer?
Do they manage the FX margin as the real cost it is, or keep negotiating the wire fee that barely moves the total?
Do exporters keep leaving exposure open in the hope of a weaker rupee, or hedge with the discipline importers already apply?
Choosing on the headline rate and the incumbent relationship, while the spread and the approval lag quietly erode margin, is no longer sufficient. India's cross-border payment decisions are being judged on transparency and total cost, and the return is earned by clarity, not by familiarity.
The data shows that value does not require the biggest bank, it requires the clearest quote and the tightest process. For India's finance teams the message is direct: see the real margin, hedge the real exposure, automate the slow steps, and choose the provider that shows you everything, or keep paying for the costs you were never shown.
About the Author
Pranshu Mittal is a survey research associate at Ken Research with expertise in primary research, survey analytics, and consumer behavior studies. He supports organizations by converting research findings into actionable insights that drive strategic decision-making and market understanding.
From the Author:
“At Ken Research, we have been mapping cross-border payment choice at the level of the people who actually make the call, the treasury leaders and SME owners who move foreign currency every week, and the data tells a clear story. Businesses are not short of providers; they are short of transparency. The gap between the headline rate they are quoted and the all-in cost they actually pay is what decides the return. India's cross-border payments market is no longer a relationship game, it is a transparency game, and the winners will be those who show the true cost of every transfer more clearly than their competitors do.”
About Ken Research:
Ken Research is a market intelligence and strategy consulting firm delivering actionable insights across the various sectors in dynamic markets. We support industry stakeholders with data-driven analysis on emerging trends, competitive benchmarking, pricing strategies, and shifting consumer preferences. Our expertise enables clients to refine market entry and penetration strategies, optimize product positioning, and respond effectively to evolving competitive landscapes.
Related tags
Banking
Banking Financial Services and Insurance
Get started
We've helped companies around the world future-proof
their businesses - and we can do the same for you.