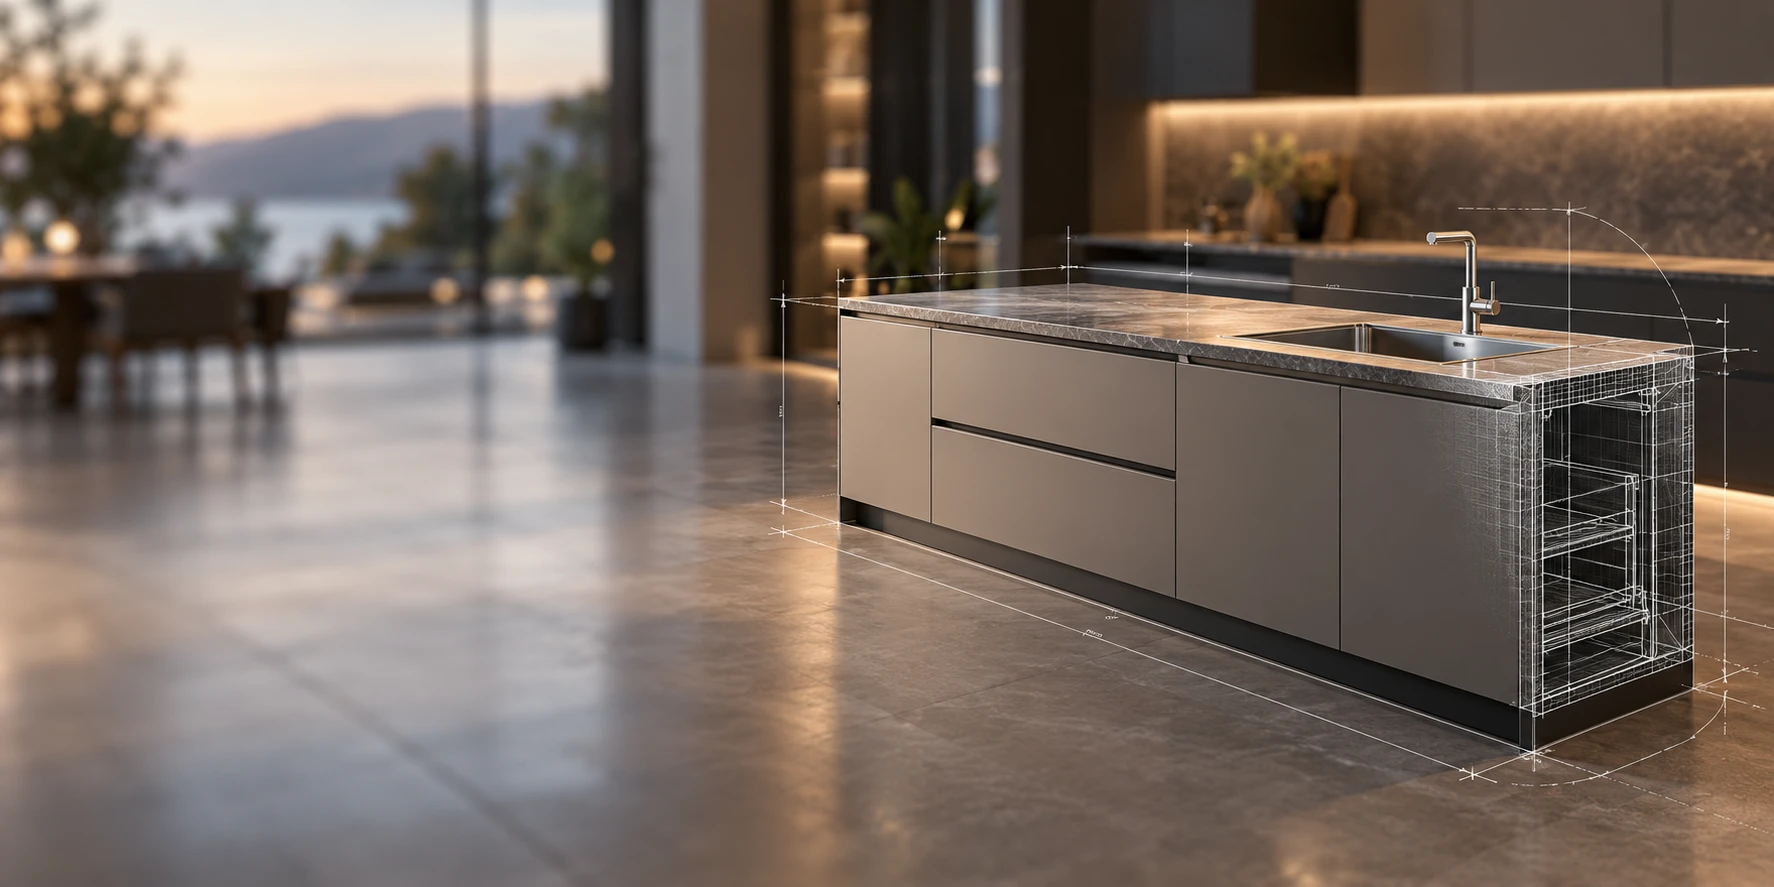
CHAPTER 1 - MARKET SUMMARY
Market Overview
The Global Modular Kitchen Market operates around repeat residential fit-out cycles, new housing completions and replacement-led renovation. Approximately 900 million households were addressable in 2025, with an estimated annual kitchen-purchase incidence of 3.3%, translating to approximately 29.7 million annual purchase events. This recurring purchase base gives manufacturers, installers and retailers a diversified demand structure rather than dependence on new construction alone.
Asia Pacific and Europe form the market's principal commercial centers. Asia Pacific represented approximately 34.0% of 2025 market value, while Europe represented 33.0%. Asia Pacific benefits from higher unit volumes and formalization of previously carpenter-led demand, while Europe combines high kitchen penetration, strong renovation economics and a mature manufacturing cluster centered around Germany and Italy.
Market Value
USD 35,900 Mn
2025
Dominant Region
Asia Pacific
2025
Dominant Segment
Smart Storage & IoT-Ready Kitchens
fastest growing
Total Number of Players
380,045+
Future Outlook
The Global Modular Kitchen Market is projected to expand from USD 35,900 Mn in 2025 to USD 50,902 Mn by 2032, representing a forecast CAGR of 5.11%. The model extends the validated 2025-2030 trajectory through 2032 without changing the underlying scope. Value growth is expected to exceed unit growth as premium surfaces, integrated storage systems, digitally configured cabinetry and higher-specification hardware lift the blended system value. The market is projected to reach approximately USD 48,432 Mn in 2031 before crossing USD 50,000 Mn in 2032.
Historical growth between 2020 and 2025 is estimated at a scope-normalized CAGR of 4.72%, compared with forecast growth of 5.11% through 2032. Asia Pacific is expected to remain the strongest incremental value contributor as branded modular formats penetrate India and other emerging Asian markets, while Europe remains strongly linked to the replacement cycle. The European renovation backdrop is structurally supportive because approximately 85% of buildings were constructed before 2000 and current energy renovation activity remains near 1% annually, creating a broad ecosystem of home-upgrade expenditure.
5.11%
Forecast CAGR
$50,902 Mn
2030 Projection
Base Year
2025
Historical Period
2020-2025
Forecast Period
2025-2032
Historical CAGR
4.72%
CHAPTER 2 - SCOPE OF REPORT
Scope of the Market
CHAPTER 3 - Key Stakeholders
Key Target Audience
Key stakeholders who can leverage from this market analysis for investment, strategy, and operational planning.
Investors
CAGR, consolidation potential, margins, capex, formalization, exit multiples
Corporates
category growth, pricing, channel mix, sourcing, product architecture
Government
housing activity, material compliance, trade flows, manufacturing competitiveness
Operators
installation productivity, lead times, utilization, dealer economics, fulfillment
Financial institutions
housing cycles, working capital, credit exposure, demand resilience
CHAPTER 4 - Market Size & Growth
Market Size, Growth Forecast and Trends
This section evaluates the historical market size, analyzes year-over-year growth dynamics, and presents forecast projections supported by market performance indicators and demand-side drivers.
Historical & Projected Market Size ($ Million)
Year-over-Year Growth Rate (%)
Market Value vs Volume Growth (%)
Historical Market Performance (2020-2025)
Historical growth remained resilient despite housing-cycle disruption, with the scope-normalized market increasing at a 4.72% CAGR between 2020 and 2025. Annual growth ranged from 4.21% in 2021 to 5.05% in 2022. Estimated purchase volume increased from approximately 25.0 million systems in 2020 to 30.0 million in 2025, while the blended value per purchase rose from about USD 1,140 to USD 1,197. The combination indicates that volume recovery, branded conversion and modest specification inflation contributed jointly rather than price being the sole growth mechanism.
Forecast Market Outlook (2025-2032)
Forecast value growth accelerates to a 5.11% CAGR through 2032, while unit growth remains below value growth. Annual system volume is projected to approach 39.0 million by 2032, compared with 30.0 million in 2025. The implied blended system value rises toward USD 1,305 as premium storage, engineered surfaces, higher-grade hardware and design services increase the revenue captured per installation. The strongest value acceleration occurs during 2028-2030 as housing conditions normalize and Asian market formalization supports both additional units and richer product mix.
CHAPTER 5 - Market Data
Market Breakdown
The Global Modular Kitchen Market combines recurring residential replacement demand with a gradually formalizing supply base. For CEOs and investors, the key variables are annual system volumes, value captured per installed kitchen and the expansion of the household pool able to purchase factory-configured solutions.
Year | Market Size (USD Mn) | YoY Growth (%) | Annual Purchase Events (Mn Systems) | Blended ASP (USD/System) | Addressable Households (Mn) | Period |
|---|---|---|---|---|---|---|
| 2020 | $28,500 Mn | +- | 25.00 | 1,140 | Forecast | |
| 2021 | $29,700 Mn | +4.21% | 25.80 | 1,151 | Forecast | |
| 2022 | $31,200 Mn | +5.05% | 26.90 | 1,160 | Forecast | |
| 2023 | $32,700 Mn | +4.81% | 27.80 | 1,176 | Forecast | |
| 2024 | $34,200 Mn | +4.59% | 28.80 | 1,188 | Forecast | |
| 2025 | $35,900 Mn | +4.97% | 30.00 | 1,197 | Forecast | |
| 2026 | $37,454 Mn | +4.33% | 30.87 | 1,213 | Forecast | |
| 2027 | $39,244 Mn | +4.78% | 31.86 | 1,232 | Forecast | |
| 2028 | $41,285 Mn | +5.20% | 33.01 | 1,251 | Forecast | |
| 2029 | $43,556 Mn | +5.50% | 34.30 | 1,270 | Forecast | |
| 2030 | $46,082 Mn | +5.80% | 35.75 | 1,289 | Forecast | |
| 2031 | $48,432 Mn | +5.10% | 37.32 | 1,298 | Forecast | |
| 2032 | $50,902 Mn | +5.10% | 39.00 | 1,305 | Forecast |
Annual Purchase Events
30.0 million systems, 2025, global. This establishes a broad recurring transaction pool rather than a niche luxury category. The UK alone has approximately 28 million households, illustrating the depth of mature fitted-kitchen demand.
Blended ASP
USD 1,197 per system, 2025, global. Value growth increasingly depends on product mix, surfaces, fittings and installation rather than unit growth alone. Wall cabinets represented 51.62% of one independently reported 2025 product mix, demonstrating the revenue weight of storage-intensive modules.
Addressable Households
900 million households, 2025, global model. The denominator expands as household income and urban living increase. Cities accounted for approximately 45% of an 8.2 billion global population in the 2025 urbanization revision, supporting continued density-led kitchen standardization.
CHAPTER 6 - Segmentation
Market Segmentation Framework
Comprehensive analysis across key dimensions providing insights into market structure, consumer preferences, and distribution patterns.
No of Segments
7
Dominant Segment
Geography
Fastest Growing Segment
Technology
Product Type
Application
End User
Technology
Price Tier
Distribution Channel
Geography
Key Segmentation Takeaways
Comprehensive analysis across all extracted segmentation dimensions providing insights into market structure, consumer preferences, and distribution patterns.
Geography
Asia Pacific is the largest regional value pool and an even larger contributor by system volume because China and India operate at lower blended price points than mature European markets. Formalization, urban apartment construction and conversion from site-built carpenter kitchens into branded factory modules create greater incremental unit potential than in already penetrated Western European markets.
Technology
Smart Storage and IoT-Ready Kitchens represent the fastest-growing technology layer as manufacturers integrate motorized fittings, sensor-assisted storage, configurator-led design and appliance-ready cabinet architecture. The value opportunity extends beyond electronics because smart-compatible kitchens generally require premium hardware, better cable management, higher installation precision and more sophisticated design services, supporting above-market revenue per installation.
CHAPTER 7 - Regional Analysis
Regional Analysis
The Global Modular Kitchen Market is balanced between Asia Pacific and Europe, which together account for approximately two-thirds of 2025 value. Asia Pacific leads on unit demand and formalization potential, while Europe retains the strongest export manufacturing cluster and a renovation-intensive installed base.
Asia Pacific Ranking
1st
Asia Pacific Share of Global
34.0%
Asia Pacific CAGR (2025-2032)
6.3%
Asia Pacific Ranking
1st
Asia Pacific Share of Global
34.0%
Asia Pacific CAGR (2025-2032)
6.3%
Regional Analysis (Current Year)
Regional Analysis Comparison
| Metric | Asia Pacific | Europe | North America | Middle East and Africa | Latin America |
|---|---|---|---|---|---|
| Market Size | USD 12,206 Mn | USD 11,850 Mn | USD 6,462 Mn | USD 3,231 Mn | USD 2,151 Mn |
| CAGR (%) | 6.3% | 3.6% | 4.6% | 6.1% | 5.0% |
Market Position
Asia Pacific ranks first with USD 12,206 Mn in 2025 value and approximately 14.2 million systems, benefiting from China's established industrial base and rapid organized-market conversion in India and Southeast Asia.
Growth Advantage
Asia Pacific's modeled 6.3% CAGR exceeds Europe's 3.6% and North America's 4.6%, reflecting faster household formation, apartment construction and migration from carpenter-built kitchens toward standardized branded systems.
Competitive Strengths
Asia Pacific combines high unit demand with meaningful export capacity. Vietnam exported USD 1.012 Bn and China USD 0.733 Bn of HS 940340 kitchen furniture in 2023.
CHAPTER 8 - INDUSTRY ANALYSIS
Growth Drivers, Challenges & Opportunities
Comprehensive analysis of key factors shaping the Global Modular Kitchen Market, including growth catalysts, operational challenges, and emerging opportunities across production, distribution, and consumer segments.
Growth Drivers
Urban Household Expansion and Formalization
- Global population reached approximately 8.2 billion (2024, global), supporting continued household formation and residential fit-out demand across emerging markets.
- The demand model identifies approximately 900 million addressable households (2025, global), making even modest penetration gains commercially meaningful for manufacturers and design-installation platforms.
- Standardization reduces dependence on skilled on-site fabrication, while digital design and repeatable cabinet modules allow branded operators to expand across secondary cities with lower customization complexity.
Renovation of Aging Housing Stock
- Approximately 75% (current stock, EU) of buildings have poor energy performance, creating a wider renovation ecosystem in which kitchens are frequently upgraded alongside building works.
- The annual EU energy renovation rate remains near 1% (current, EU), implying substantial deferred renovation potential for residential interiors and fitted-kitchen replacement.
- The policy objective covers approximately 35 million buildings (target to 2030, EU), supporting contractors, cabinet suppliers and specialist retailers participating in broader home improvement expenditure.
Digital Configuration and Industrialized Customization
- One major Asian producer reported approximately 860,162 kitchen sets (2023, global shipments), demonstrating the scalability of mass-customized kitchen manufacturing.
- A leading global home retailer operates 3 modular kitchen systems (current, retail platform) with dedicated planning tools, reinforcing consumer acceptance of configurable standardized architectures.
- A major UK kitchen supplier increased group revenue by 4.1% (2025, company) despite continued kitchen-market headwinds, showing that share gains and operating execution can outperform weak underlying housing conditions.
Market Challenges
Housing-Cycle and Interest-Rate Sensitivity
- Residential kitchen purchases are discretionary enough to be deferred when financing conditions weaken, making new-build and high-ticket renovation volumes more cyclically sensitive than basic furniture replacement.
- A major North American cabinet producer reported gross margin of 25.3% (Q1 2026, company), down 530 basis points year on year amid lower volume, mix pressure, inflation and tariffs.
- The combination of fixed manufacturing capacity and lower utilization can compress profit faster than revenue, increasing the strategic importance of flexible production scheduling and dealer inventory discipline.
Material Compliance and Testing Costs
- United States requirements cap particleboard formaldehyde emissions at 0.09 ppm (current, US), requiring certified panel sourcing and documentation throughout the supply chain.
- MDF is subject to a 0.11 ppm limit (current, US), affecting a core cabinet substrate used extensively in painted and laminated modular-kitchen components.
- Compliance raises supplier qualification costs but also creates differentiation for vertically integrated manufacturers capable of certified material procurement, testing and traceability across export markets.
Price Competition and Fragmented Local Supply
- China added approximately USD 0.733 Bn (2023, global) of HS 940340 exports, reinforcing competitive pressure on standardized cabinet modules in importing markets.
- The market model identifies approximately 380,000 micro-workshops (2025, global estimate), making local price comparison difficult and limiting the ability of branded operators to capture the entire replacement market.
- A major Chinese home-furnishing network reduced its store base from 7,813 to 7,345 locations (2024-2025, China), illustrating channel rationalization even among scaled players.
Market Opportunities
Asia Pacific Branded-Market Conversion
- The monetizable opportunity lies in converting carpenter-led purchases into bundled design, manufacturing and installation contracts, allowing brands to capture design fees, hardware upgrades and repeat referrals.
- Manufacturers, digital interior platforms and project developers benefit as branded systems improve quality consistency and reduce dependence on site-level fabrication labor.
- Scale requires localized installation networks and faster fulfillment; one manufacturer reports products across more than 130 countries and regions (2023, company footprint).
Low-Emission and Certified Cabinet Systems
- Producers can monetize low-emission panels, certified adhesives and traceable material packages through specification-led sales to developers and premium homeowners.
- Large manufacturers and compliant panel suppliers benefit because certification requirements raise the relative cost burden on small workshops with limited testing infrastructure.
- Adoption depends on verified material documentation and certification systems capable of meeting standards such as the 0.05 ppm hardwood plywood limit (current, US).
Omnichannel Design-to-Installation Platforms
- Revenue can be captured across design consultation, cabinet modules, countertops, hardware, delivery and installation, increasing average transaction value beyond cabinet manufacturing alone.
- Retailers and design platforms benefit from lower acquisition friction as consumers can configure layouts before visiting showrooms, shortening early-stage design cycles.
- International project channels provide further scale; one documented residential project supplied approximately 1,100 units (project example, Australia) using integrated kitchen and interior packages.
CHAPTER 9 - Competitive Landscape
Competitive Landscape Overview
The market has a barbell structure: CR10 is approximately 34.1%, while a long tail of local workshops and carpenters accounts for at least 21.1% of value, creating simultaneous scale advantages and intense local fragmentation.
Market Share Distribution
Top 5 Players
Market Dynamics
8 new entrants in the past 5 years, indicating strong market attractiveness and growth potential.
Company Name | Market Share | Headquarters | Founding Year | Core Market Focus |
|---|---|---|---|---|
IKEA | - | Delft, Netherlands | 1943 | Flat-pack and modular kitchen systems, cabinetry, storage and omnichannel planning |
MasterBrand, Inc. | - | Beachwood, Ohio, United States | 1954 | Stock, semi-custom and premium residential cabinetry |
Howden Joinery Group Plc | - | London, United Kingdom | 1995 | Trade-focused fitted kitchens, cabinetry and kitchen-related joinery |
nobilia-Werke J. Stickling GmbH & Co. KG | - | Verl, Germany | 1945 | Industrial-scale fitted kitchens and modular cabinet systems |
OPPEIN Home Group Inc. | - | Guangzhou, China | 1994 | Customized kitchen cabinets and integrated home-furnishing systems |
Nobia AB | - | Stockholm, Sweden | 1996 | Kitchen design, manufacturing and retail brands across Northern Europe |
Schmidt Groupe | - | Lièpvre, France | 1934 | Bespoke fitted kitchens and interior storage systems |
Häcker Küchen GmbH & Co. KG | - | Rödinghausen, Germany | 1898 | Factory-manufactured fitted kitchens across mid-premium and premium tiers |
Wren Kitchens Limited | - | Barton-upon-Humber, United Kingdom | 2009 | Vertically integrated kitchen manufacturing, retail design and installation |
Poggenpohl Manufacturing GmbH | - | Herford, Germany | 1892 | Luxury kitchen architecture and bespoke premium cabinetry |
Cross Comparison Parameters
The report provides detailed cross-comparison of key players across 10 performance parameters to identify competitive strengths and weaknesses.
Kitchen Systems Shipped
Order-to-Installation Lead Time
Kitchen-Segment Revenue Growth
Gross Margin
Analysis Covered
Market Share Analysis:
Benchmarks revenue concentration across scaled brands and fragmented local suppliers
Cross Comparison Matrix:
Compares operating scale, delivery efficiency, growth and profitability performance
SWOT Analysis:
Assesses brand strength, production capability, channel exposure and vulnerabilities globally
Pricing Strategy Analysis:
Evaluates economy, mid-market, premium and luxury kitchen pricing architectures globally
Company Profiles:
Reviews strategy, geographic footprint, channel model and kitchen specialization
CHAPTER 10 - REPORT TOC
Table of Contents
Market Assessment Phase
Supply-side and competitive intelligence covering market sizing, segmentation, competitive dynamics, regulatory landscape, and future forecasts.
Go-To-Market Strategy Phase
15 chapters
Entry strategy evaluation, execution roadmap, partner recommendations, and profitability outlook.
Survey Phase
8 chapters
Demand-side primary research conducted through structured interviews and online surveys with end users across priority metros and Tier 2/3 cities to capture consumption behavior, unmet needs, and purchase drivers.
Complete Report Coverage
201+ detailed sections covering every aspect of the market
143
Assessment Sections
58
Strategy Sections
CHAPTER 11 - Our Approach
Research Methodology
Desk Research
- Kitchen furniture trade-flow mapping
- Residential renovation demand benchmarking
- Cabinet manufacturer financial analysis
- Material compliance requirement review
Primary Research
- Kitchen manufacturing directors interviewed
- Retail category managers consulted
- Residential developers and contractors interviewed
- Interior design principals surveyed
Validation and Triangulation
- 372 stakeholder responses cross-validated
- Company revenues reconciled to scope
- Volume and ASP models compared
- Household demand assumptions stress-tested
CHAPTER 12 - FAQ
FAQs
Still have questions?
Our research team is here to help you find the right solution
CHAPTER 13 - Related Research
Explore Related Reports
Expand your market intelligence with complementary research across regions and adjacent markets.
Regional/Country ReportsRelated market analysis across key regions
Related market analysis across key regions
- Saudi Arabia Modular Kitchen Market
- Asia Pacific Modular Kitchen Market
- Indonesia Modular Kitchen Market
- Vietnam Modular Kitchen Market
- Thailand Modular Kitchen Market
Adjacent ReportsRelated markets and complementary research
Related markets and complementary research
- Kuwait Modular Furniture Market
- UAE Home Renovation Services Market
- Indonesia Kitchen Appliance Market
- Qatar Smart Home Technology Market
- Global Interior Design Services Market Size, Share & Forecast, By Service Type, Customer Type & End-Use Industry, 2026–2031
500+
Market Research Reports
50+
Countries Covered
15+
Industry Verticals